Tactical Asset Allocation: October 2022

We remain underweight risk relative to benchmark1.
Synopsis
- Our framework remains in a contraction regime. We expect decelerating earnings to drive equities lower.
- Underweight risk relative to benchmark in the Global Tactical Asset Allocation model1, favoring fixed income over equities, underweighting credit risk2, overweighting duration, the US dollar and defensive equity factors.
Macro update
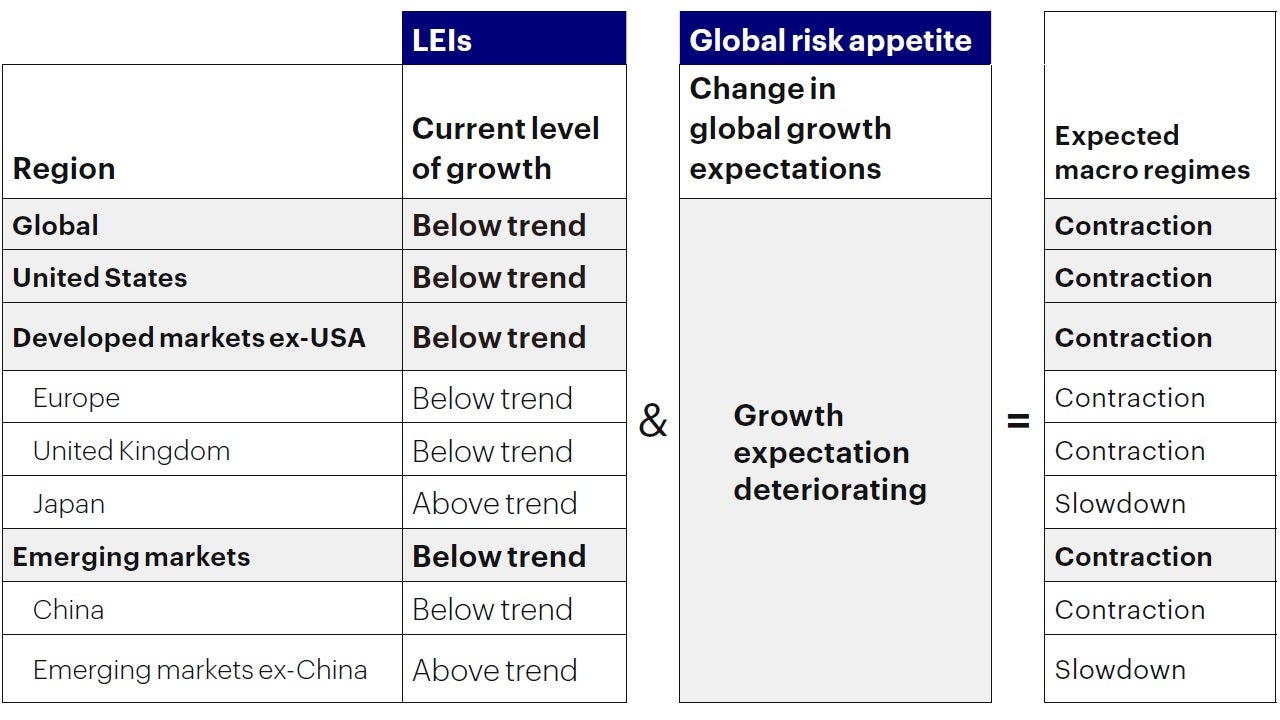
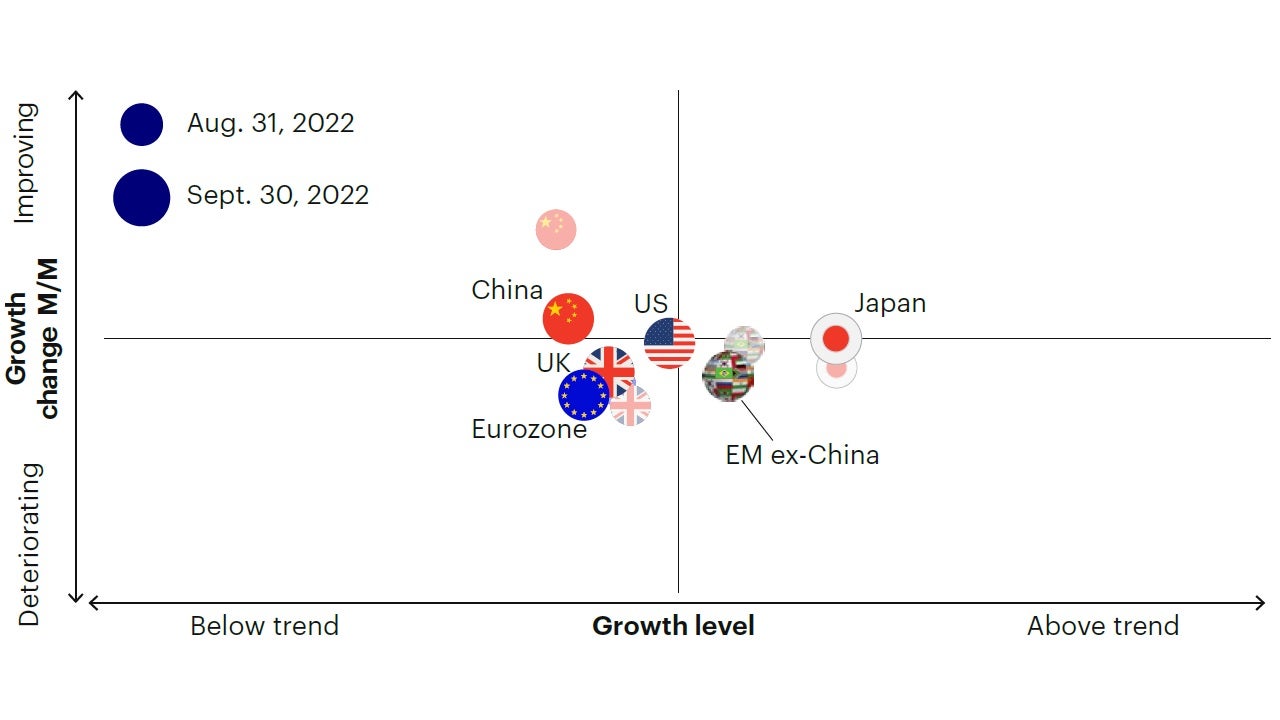
Leading economic indicators continue to weaken, suggesting growth likely to be below trend across regions. Surveys of consumer sentiment remain around all-time lows in both the United States, Eurozone, and United Kingdom, but have stabilized in the last three months. Business surveys, manufacturing activity and the construction sector continue to decline towards their long-term trend, while monetary conditions continue to tighten. Risk sentiment continues to deteriorate, with equity markets underperforming fixed income, and credit spreads widening again to recent highs. We believe this process has further to run and is indicative of deteriorating growth expectations (Figure 1 and Figure 2).

Leading economic indicators continue to weaken, suggesting growth likely to be below trend across regions.

Sources: Bloomberg L.P., Macrobond. Invesco Investment Solutions research and calculations. Proprietary leading economic indicators of Invesco Investment Solutions. Macro regime data as of Sept. 30, 2022. The Leading Economic Indicators (LEIs) are proprietary, forward-looking measures of the level of economic growth. The Global Risk Appetite Cycle Indicator (GRACI) is a proprietary measure of the markets’ risk sentiment.
Risk sentiment continues to deteriorate, with equity markets underperforming fixed income, and credit spreads widening again to recent highs. We believe this process has further to run and is indicative of deteriorating growth expectations.

Sources: Bloomberg L.P., MSCI, FTSE, Barclays, JPMorgan, Invesco Investment Solutions research and calculations, from Jan. 1, 1992 to Sept. 30, 2022. The Global Leading Economic Indicator (LEI) is a proprietary, forward-looking measure of the growth level in the economy. A reading above (below) 100 on the Global LEI signals growth above (below) a long-term average. The Global Risk Appetite Cycle Indicator (GRACI) is a proprietary measure of the markets’ risk sentiment. A reading above (below) zero signals a positive (negative) compensation for risk taking in global capital markets in the recent past. Past performance does not guarantee future results.
Despite inflation running at 40-year highs, long-term inflation expectations remain anchored at 2-2.5%, except for a brief breach of this ceiling in the spring, highlighting market confidence in central banks’ inflation targeting objectives.
The sell-off in bond yields has gathered steam over the past two months, inflicting additional pain to investors after experiencing the worst bond market performance in recorded history. A closer inspection of the dynamics in bond yields this year, however, reveals some interesting observations. Despite inflation running at 40-year highs, long-term inflation expectations remain anchored at 2-2.5%, except for a brief breach of this ceiling in the spring, highlighting market confidence in central banks’ inflation targeting objectives. Figure 3 illustrates the decomposition of nominal 10-year US Treasury yields between real rates and inflation expectations, highlighting how the entire underperformance in government bond markets this year can be attributed to the rise in real yields, i.e., the yield on inflation-protected securities (TIPS), not inflation expectations. The rise in real yields from -1.2% to +1.7% is indicative of a meaningful shift in the global supply and demand for capital, namely a sharp decline in the supply of savings relative to investment demand, leading to a rise in the real cost of capital. Expectations for quantitative tightening and liquidity withdrawal have contributed to this meaningful shift.
Why is this distinction important? In an investment world where inflation expectations remain anchored, we can assume a stable inflation volatility premium going forward, and a lower likelihood of dysfunctional bond market dynamics echoing the 1970s. While the future direction of real rates is far from certain, today’s 1.7% is more in-line with the average real rate of 2% prevailing in the pre-quantitative easing period between 2002 – 2008, increasing the likelihood of a stabilization in nominal and real bond yields over the next few months and quarters. The recent decline in inflation expectations is also consistent with the decelerating inflation momentum we registered over the past three months (Figure 4).
In an investment world where inflation expectations remain anchored, we can assume a stable inflation volatility premium going forward, and a lower likelihood of dysfunctional bond market dynamics echoing the 1970s.

Source: Bloomberg. Breakeven inflation expectations calculated as the difference between Nominal 10Y US Treasury yields and the yield on 10Y Treasury Inflation Protected Securities (TIPS). Sample January 1997 - September 2022.
The recent decline in inflation expectations is also consistent with the decelerating inflation momentum we registered over the past three months.

Sources: Bloomberg L.P. data as of Sept. 30, 2022, Invesco Investment Solutions calculations. The US Inflation Momentum Indicator (IMI) measures the change in inflation statistics on a trailing three-month basis, covering indicators across consumer and producer prices, inflation expectation surveys, import prices, wages, and energy prices. A positive (negative) reading indicates inflation has been rising (falling) on average over the past three months.
We believe equity markets are yet to reflect higher growth risks and the associated potential earnings correction.
On the other hand, we believe equity markets are yet to reflect higher growth risks and the associated potential earnings correction. The underperformance in global equities relative to credit and government bonds markets over the past month is a step in this direction, in our opinion, and consistent with a repricing of growth risk. Our framework suggests this process has further to go, as risk sentiment remains on a downward trend and leading economic indicators continue to decline.
Investment positioning
We expect defensive equities to outperform in an environment of below-trend and slowing growth, declining inflation, and peaking bond yields.
While high yield spreads have widened again to about 5.5%, average recessionary regimes see spreads widen to 7-8%, hence we remain underweight and wait for further widening before increasing exposure.
We maintain a max overweight position in the US dollar, despite expensive valuations, as global growth is underperforming consensus and monetary policy continues to tighten.
There are no changes this month in our Global Tactical Asset Allocation model. We maintain an underweight risk stance relative to benchmark, expressing a defensive bias across most levers in the portfolio, and overweight the US dollar. We remain underweight equity in favor of fixed income, which now offers attractive 5-6% yields in investment grade or 8-9% yields in risky credits. Within fixed income we remain underweight credit risk3 and overweight duration relative to benchmark (Figure 5, 6, 7).
In particular:
- Within equities we are underweight value, small and mid-cap equities, favoring defensive factors like quality, low volatility, and momentum, resulting in defensive sector exposures with higher duration characteristics and lower operating leverage such as information technology, communication services and health care, at the expense of financials, industrials, and materials. We expect these defensive characteristics to outperform in an environment of below-trend and slowing growth, declining inflation, and peaking bond yields. From a regional perspective, we maintain a moderate underweight in emerging markets relative to developed markets despite the modest improvements in China’s leading indicators. Historically, a global contraction regime with tightening financial conditions has provided headwinds to emerging markets, offsetting positive local momentum. We remain neutral between US and developed ex-US equities.
- In fixed income we are underweight risky credit as a contractionary regime has historically led to underperformance in high yield, bank loans and emerging markets relative to higher quality debt with similar duration. We favor investment grade and duration in long-dated government bonds, expecting more flattening in the yield curve. We expect further compression in breakeven inflation expectations, overweighting nominal treasuries relative to inflation-linked bonds.
In currency markets we maintain a max overweight position in the US dollar, despite expensive valuations, as global growth is underperforming consensus and monetary policy continues to tighten. Historically, this combination of cyclical forces has overcome demanding valuations in the greenback. Within developed markets we favor the euro, the British pound, Norwegian kroner and Swedish krona relative to the Swiss Franc, Japanese yen, Australian and Canadian dollars. In EM we favor high yielders with attractive valuations as the Colombian peso and Brazilian real, while we underweight the Korean won, Taiwan dollar and Chinese renminbi.

Source: Invesco Investment Solutions, Sept. 30, 2022. DM = developed markets. EM = emerging markets. FX = foreign exchange. For illustrative purposes only.

Source: Invesco Investment Solutions, Sept. 30, 2022. For illustrative purposes only. Neutral refers to an equally weighted factor portfolio.

Source: Invesco Investment Solutions, Sept. 30, 2022. For illustrative purposes only. Sector allocations derived from factor and style allocations based on proprietary sector classification methodology. As of June 2022, Cyclicals: energy, financials, industrials, materials; Defensives: consumer staples, health care, information technology, real estate, communication services, utilities; Neutral: consumer discretionary.
Footnotes
-
1
Global 60/40 benchmark (60% MSCI ACWI, 40% Bloomberg Global Aggregate USD Hedged).
-
2
Credit risk defined as duration times spread (DTS).
-
3
Credit risk defined as duration times spread (DTS).
当資料ご利用上のご注意
当資料は情報提供を目的として、インベスコ・アセット・マネジメント株式会社(以下、「当社」)のグループに属する運用プロフェッショナルが英文で作成したものであり、法令に基づく開示書類でも金融商品取引契約の締結の勧誘資料でもありません。内容には正確を期していますが、必ずしも完全性を当社が保証するものではありません。また、当資料は信頼できる情報に基づいて作成されたものですが、その情報の確実性あるいは完結性を表明するものではありません。当資料に記載されている内容は既に変更されている場合があり、また、予告なく変更される場合があります。当資料には将来の市場の見通し等に関する記述が含まれている場合がありますが、それらは資料作成時における作成者の見解であり、将来の動向や成果を保証するものではありません。また、当資料に示す見解は、インベスコの他の運用チームの見解と異なる場合があります。過去のパフォーマンスや動向は将来の収益や成果を保証するものではありません。当社の事前の承認なく、当資料の一部または全部を使用、複製、転用、配布等することを禁じます。
受託資産の運用に係るリスクについて
受託資産の運用にはリスクが伴い、場合によっては元本に損失が生じる可能性があります。各受託資産へご投資された場合、各受託資産は価格変動を伴う有価証券に投資するため、投資リスク(株価の変動リスク、株価指数先物の価格変動リスク、公社債にかかるリスク、債券先物の価格変動リスク、コモディティにかかるリスク、信用リスク、デフォルト・リスク、流動性リスク、カントリー・リスク、為替変動リスク、中小型株式への投資リスク、デリバティブ.金融派生商品.に関するリスク等)による損失が生じるおそれがあります。ご投資の際には、各受託資産の契約締結前書面、信託約款、商品説明書、目論見書等を必ずご確認下さい。
受託資産の運用に係る費用等について
投資一任契約に関しては、次の事項にご留意ください。【投資一任契約に係る報酬】直接投資の場合の投資一任契約に係る報酬は契約資産額に対して年率0.88%(税込)を上限とする料率を乗じた金額、投資先ファンドを組み入れる場合の投資一任契約に係る報酬は契約資産額に対して年率0.605%(税込)を上限とする料率を乗じた金額が契約期間に応じてそれぞれかかります。また、投資先外国籍ファンドの運用報酬については契約資産額に対して年率1.30%を上限とする料率を乗じた金額が契約期間に応じてかかります。一部の受託資産では投資一任契約に加えて成功報酬がかかる場合があります。成功報酬については、運用戦略および運用状況などによって変動するものであり、事前に料率、上限額などを表示することができません。【特定(金銭)信託の管理報酬】当該信託口座の受託銀行である信託銀行に管理報酬をお支払いいただく必要があります。具体的料率については信託銀行にご確認下さい。【組入有価証券の売買時に発生する売買委託手数料等】当該費用については、運用状況や取引量等により変動するものであり、事前に具体的な料率、金額、上限または計算方法等を示すことができません。【費用合計額】上記の費用の合計額については、運用状況などによって変動するものであり、事前に料率、上限額などを表示することができません。
20221012-2471103-JP
そのほかの投資関連情報はこちらをご覧ください。https://www.invesco.com/jp/ja/institutional/insights.html

