Wirtschaft 2021: Globaler Markt- und Wirtschaftsausblick
Welche Art von wirtschaftlicher Erholung können wir im Jahr 2021 erwarten?

As yields across the globe continue to fall to record lows, many investors are now actually paying someone to take their money.
Currently, there are more than USD12 trillion of bonds with negative yields outstanding, which equal 24% of the global bond market.1 In Europe, the search for positive yield is especially challenging. Over half (51%) of the European bond market now yields a negative rate.1 Germany recently issued €5 billion of bunds at a price of €101.5, but these will only return €100 in two years with zero coupons paid.2 And according to Reuters, Austria is also rumoured to be planning to issue a 100-year bond at roughly 1% to feed yield hungry investors.
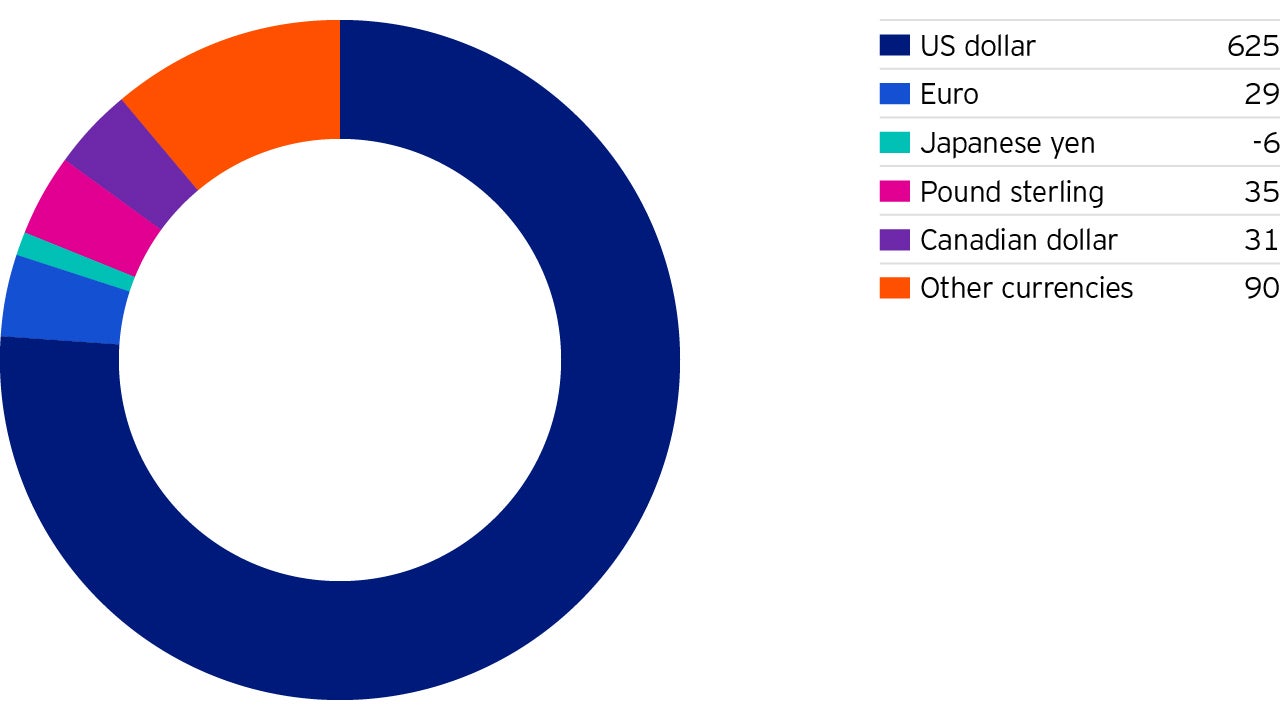
The US is currently the largest contributor of global fixed income yield While Europe and Japan account for 40.8% of the global bond market by market value, they generate only 2.8% of the income (figures 1 and 2).1 So where can yield-starved European and Asian investors find positive yields? Emerging markets like South Korea, China, Thailand and Indonesia have been positive yielding and account for 6.1% of global income generated from bonds.1 Developed but smaller debt markets such as the UK and Canada account for 8.1% of global income. The biggest source of yield is the United States, which contributes 77.9% of the globe’s fixed income yield, on only 44.7% of the debt.1


As the ECB considers rate cuts and additional bond purchases, Europe’s negative yield problem may only get worse. Potential interest rate cuts by the central banks of England, Australia, and Canada could compound the problem. To top it off, the Fed cut interest rates by 25 basis points at its July meeting.

Welche Art von wirtschaftlicher Erholung können wir im Jahr 2021 erwarten?

This white paper addresses our short-term investment views based on our forward-looking global macro framework.

Nach einer kurzen und heftigen Rezession (und einer schnelleren Erholung, als wir erwartet hatten), stellt sich die Frage, ob wir jetzt am Anfang eines neuen globalen Zyklus stehen.

