NA2891163
Important information
Image: Manu Prats / Stocksy
Some references are U.S. centric and may not apply to Canada.
All figures are in U.S. dollars.
This does not constitute a recommendation of any investment strategy or product for a particular investor. Investors should consult a financial professional before making any investment decisions.
All investing involves risk, including the risk of loss.
Diversification does not guarantee a profit or eliminate the risk of loss.
Past performance does not guarantee future results.
Investments cannot be made directly in an index.
In general, stock values fluctuate, sometimes widely, in response to activities specific to the company as well as general market, economic and political conditions.
Fixed income investments are subject to credit risk of the issuer and the effects of changing interest rates. Interest rate risk refers to the risk that bond prices generally fall as interest rates rise and vice versa. An issuer may be unable to meet interest and/or principal payments, thereby causing its instruments to decrease in value and lowering the issuer’s credit rating.
A bond's yield is the return to an investor from the bond's interest, or coupon, payments.
A cyclical sector is an equity sector whose price is affected by ups and downs in the overall economy.
The discount rate refers to the rate of interest that is applied to future cash flows of an investment to calculate its present value. It is the rate of return that companies or investors expect on their investment.
Inflation is the rate at which the general price level for goods and services is increasing.
Disinflation, a slowing in the rate of price inflation, describes instances when the inflation rate has reduced marginally over the short term.
Deflation is a decrease in the general price level of goods and services that occurs when the inflation rate falls below 0%.
The Consumer Price Index (CPI) measures change in consumer prices as determined by the U.S. Bureau of Labor Statistics. Core CPI excludes food and energy prices while headline CPI includes them.
An inflection point is an event that results in a significant positive or negative change in the progress of a company, industry, sector, economy, or geopolitical situation.
Spread represents the difference between the yield on a corporate bond and a similar maturity U.S. Treasury bond.
The ISM Manufacturing Index, which is based on Institute of Supply Management surveys of manufacturing firms in the U.S., monitors employment, production, inventories, new orders and supplier deliveries.
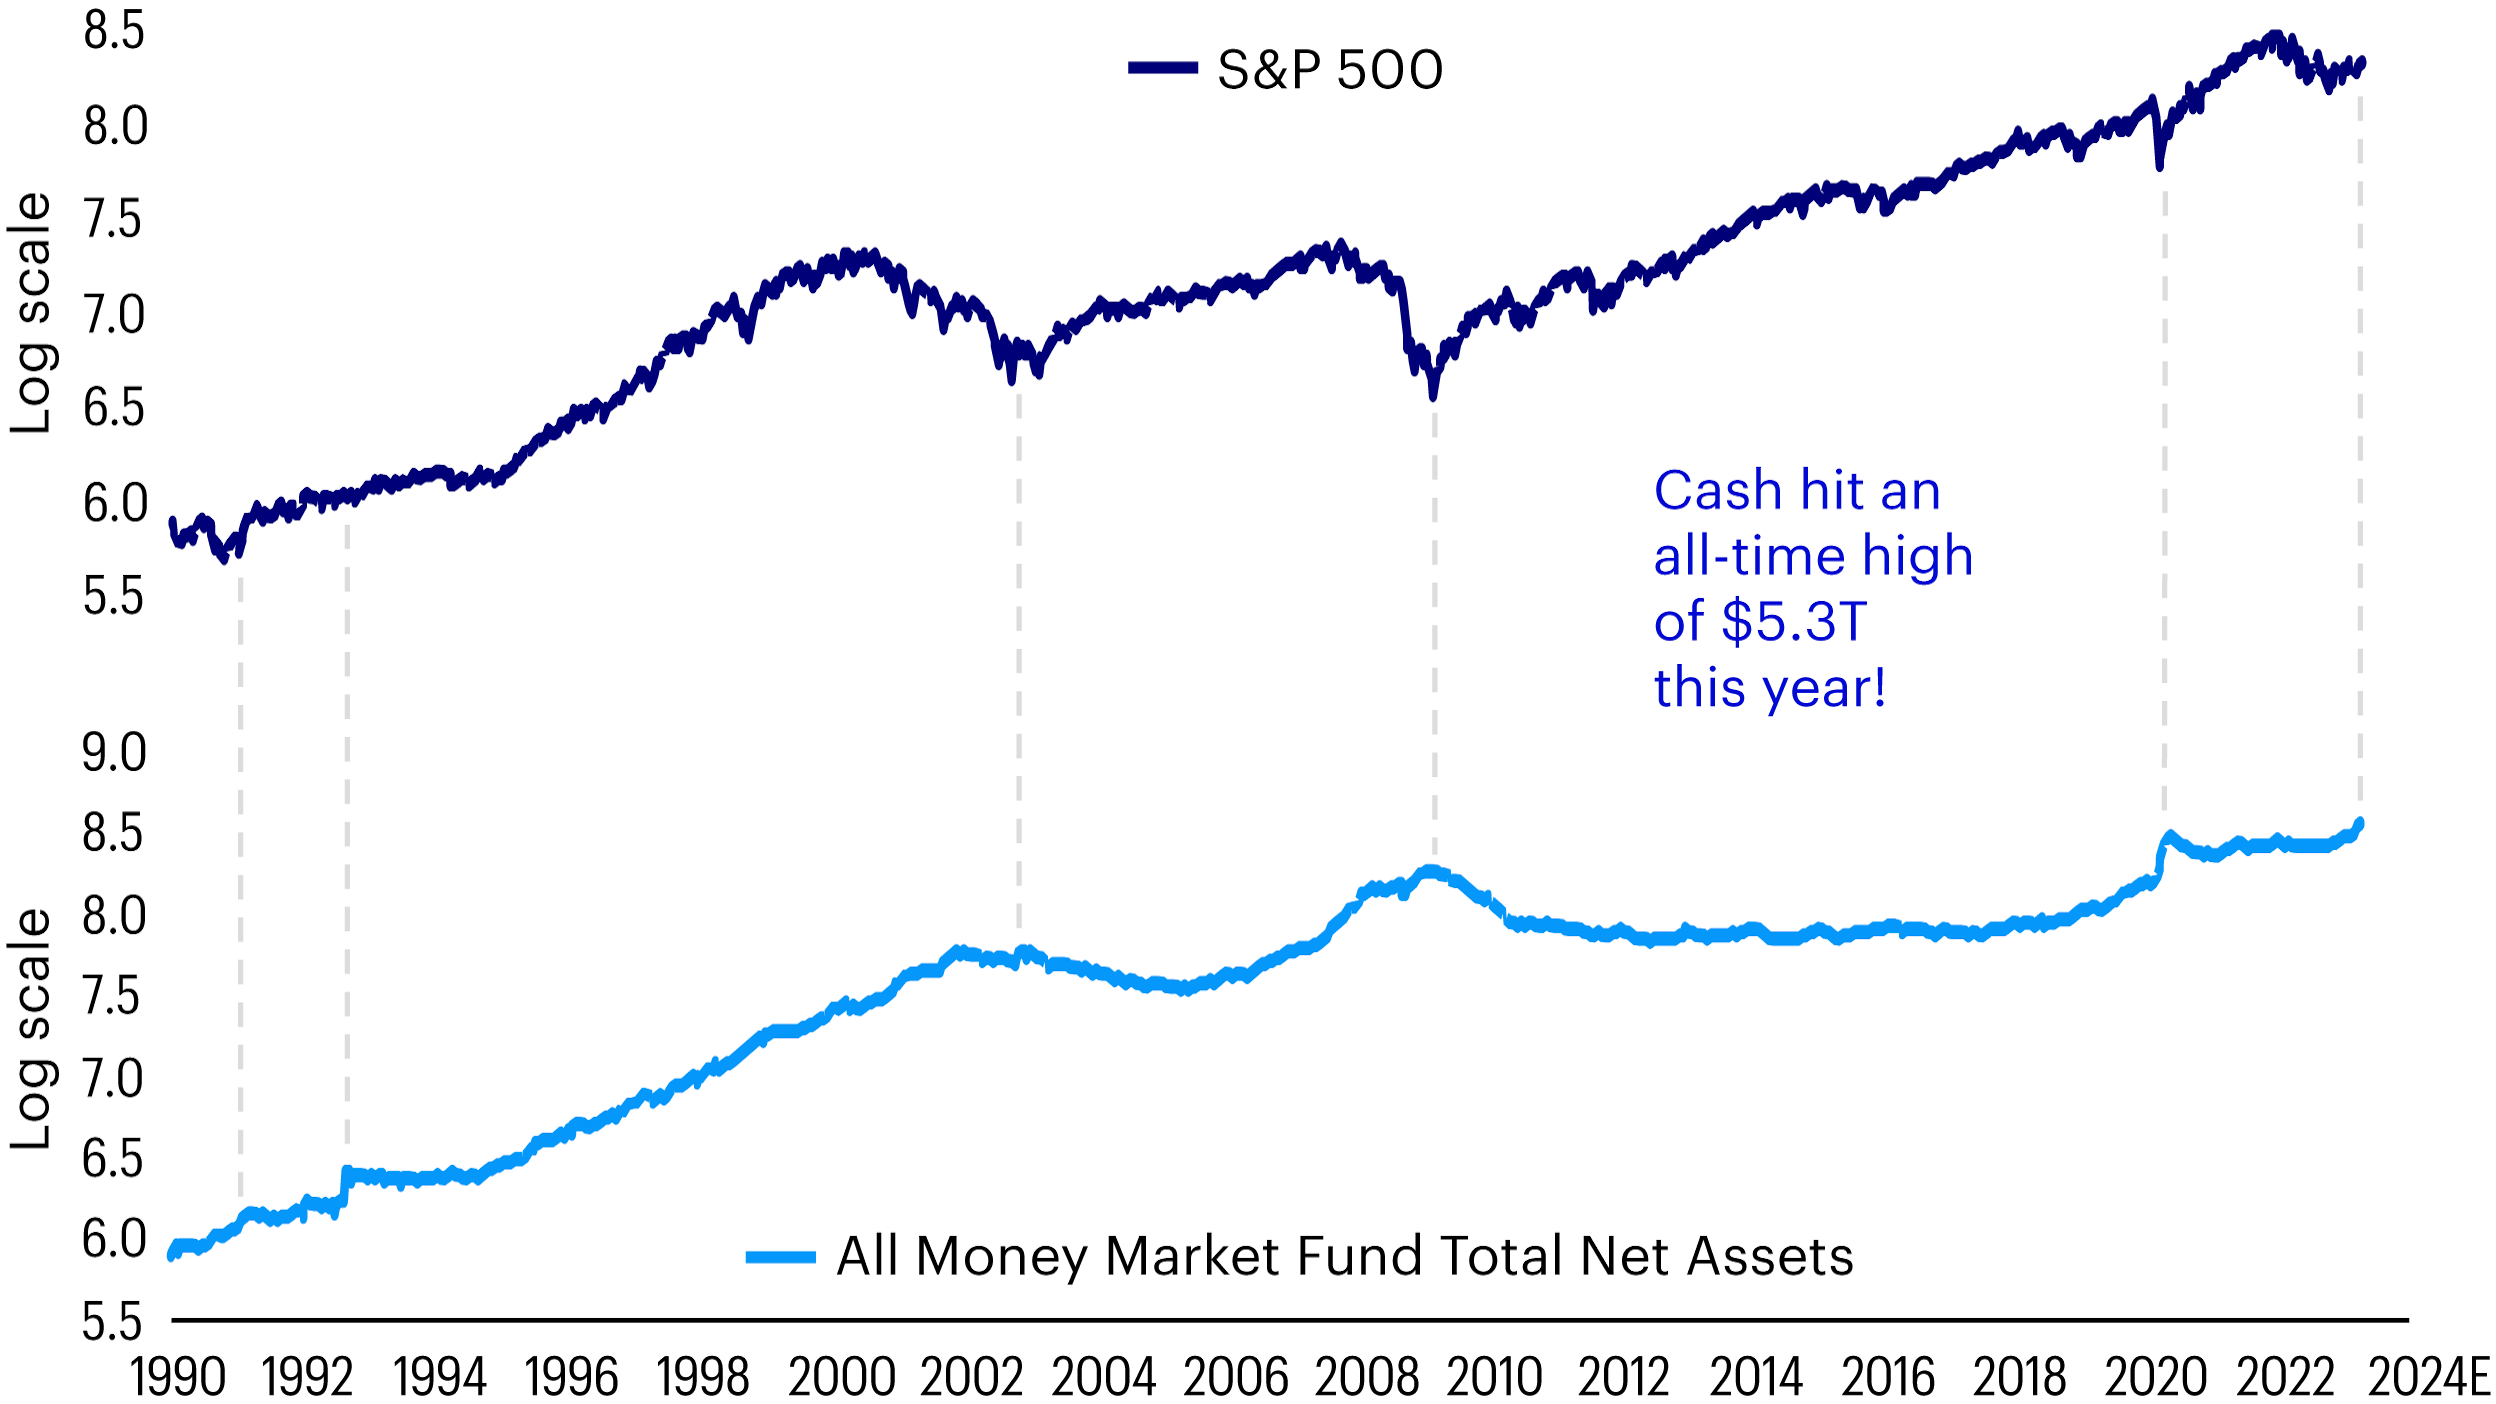
The S&P 500® Index is a market-capitalization-weighted index of the 500 largest domestic U.S. stocks.
The opinions referenced above are those of the author as of April 28, 2023. These comments should not be construed as recommendations, but as an illustration of broader themes. Forward-looking statements are not guarantees of future results. They involve risks, uncertainties and assumptions; there can be no assurance that actual results will not differ materially from expectations.


