Invesco Quantitative Strategies Factor Model Update COVID-19

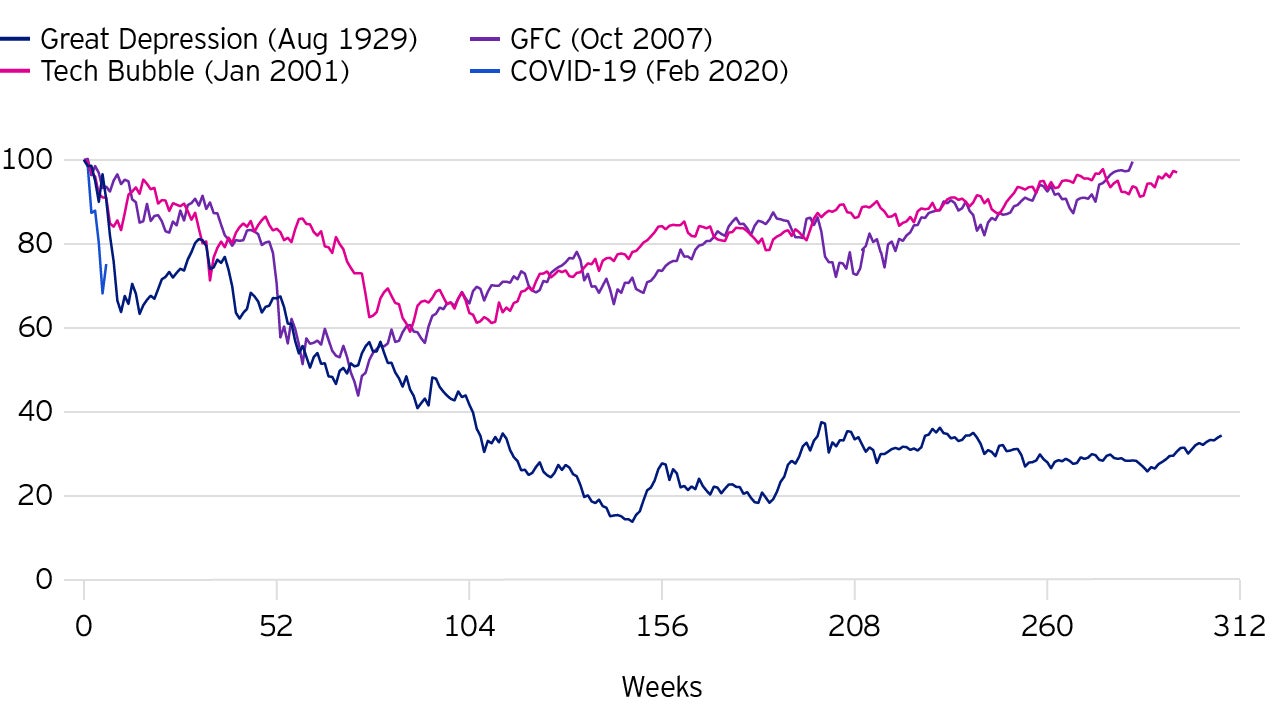
Global equity markets saw their fastest drawdown amid the outbreak of COVID-19. Uncertainty and search for liquidity have led to a sell-off of almost all asset classes; even gold and government bonds have lost their diversifying element periodically. The monetary and fiscal response from central banks and governments around the world has been drastic but so far, markets seem to be driven by the increasing number of corona cases only, resulting in the most rapid drawdown for the S&P 500 in history, as shown below.

From a factor perspective, we have observed two distinct regimes since the start of the outbreak. After the market peaked on the 19th of February, equity volatility picked up substantially. On the other hand, factor movements were comparatively muted until the end of February.
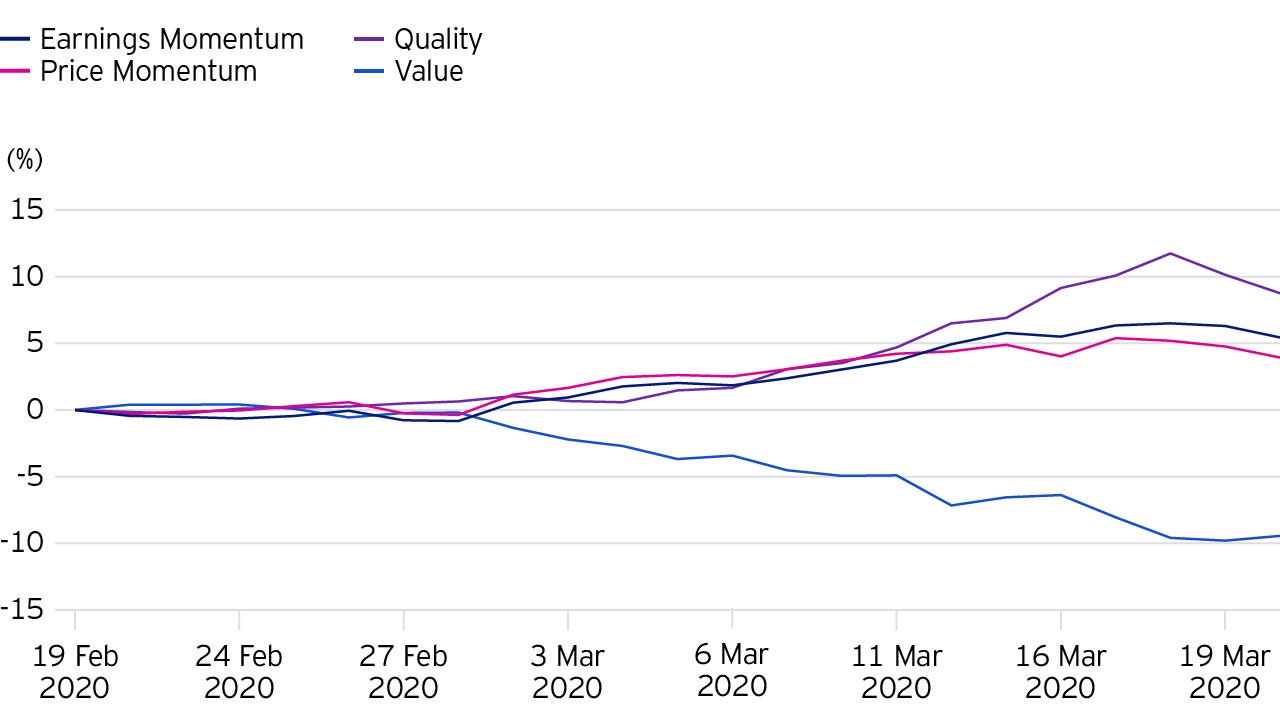
The chart below illustrates factor performance since the market peak on the 19th of February until the 20th of March 2020.

Both periods have in common that factors have largely behaved as expected. Clearly observable is that when market volatility picked up further at the beginning of March, factor movements got substantially more pronounced. As expected in an environment of sudden strong risk aversion, the Value factor, traditionally a high-risk factor, suffered the most. With the exception of a few days when markets attempted relief rallies, the factor has been delivering a negative premium through the last roughly 4 weeks.

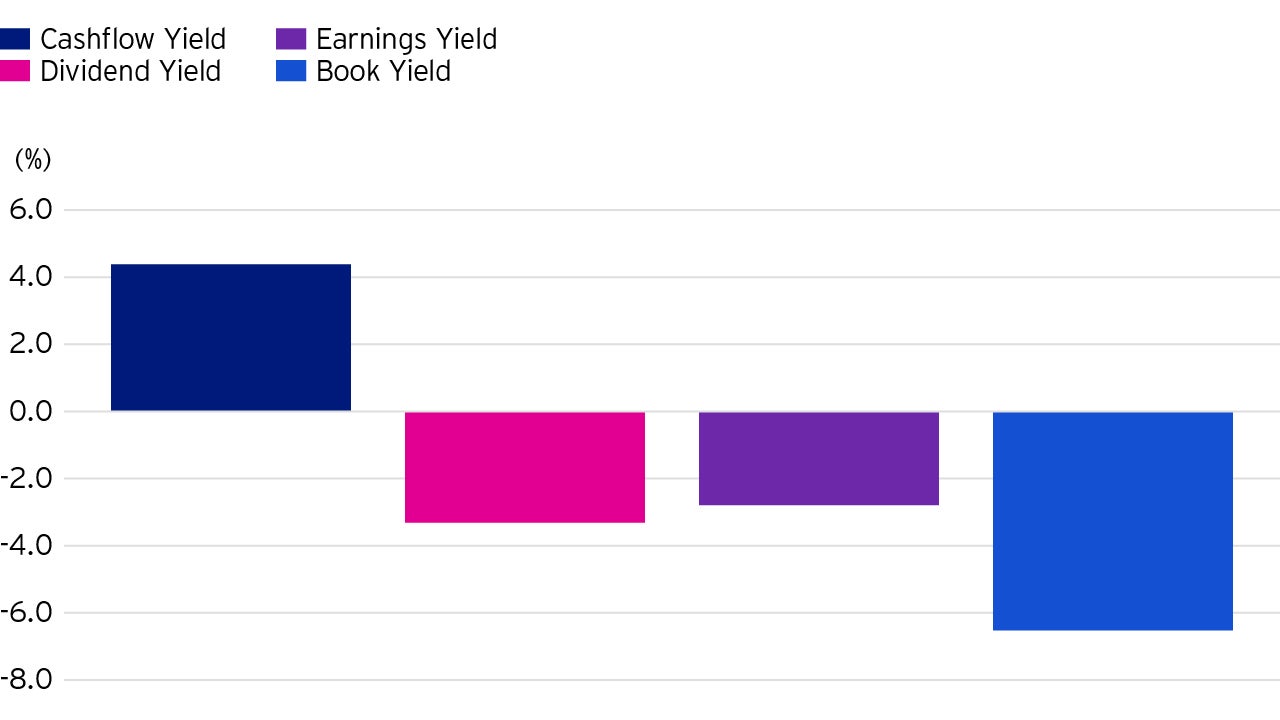
Given different risk profiles of the underlying Value signals, it is expected that more defensive measures like Cashflow or Dividend Yield can outpace more cyclical Value signals like Book or Earnings Yield in such a market environment.
Coming back to the factor performance chart, during the first weeks of a market turnaround, Momentum factors can lag the overall market as an initial sell-off often hits stocks that investors have decent gains on, i.e. those with superior recent Momentum. However, we have observed that Momentum did quite well, in line with the negative long-term correlation between Momentum and Value. Lastly, during periods of higher risk aversion, we see that high quality, low risk stocks, i.e. the Quality factor, provide some cushioning and can offset some of the weak contribution from Value.
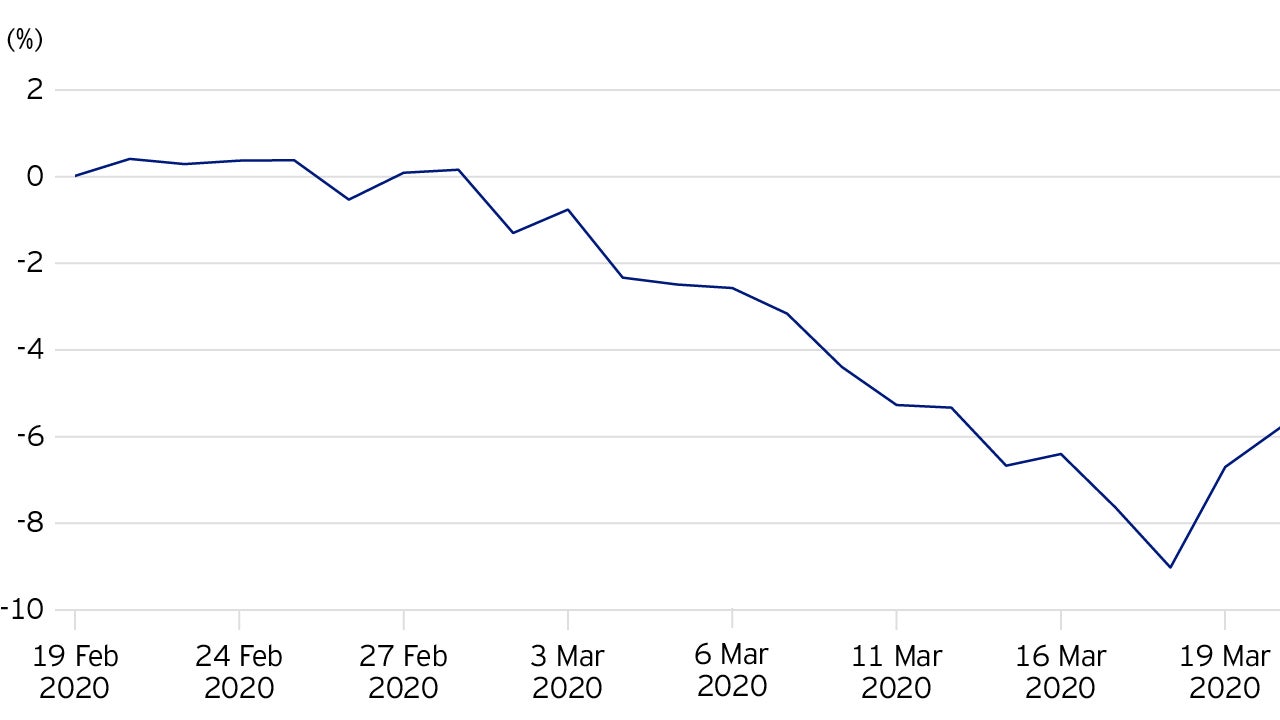
Another factor that has moved as expected is Size, i.e. exposure to stocks with lower market cap. As with Value, Size has shown a negative performance given it is a high-risk factor. Investors have shunned away from small caps, potentially due to concerns around their balance sheet quality and sensitivity to a likely dip in economic activity.

Investment risks
-
The value of investments and any income will fluctuate (this may partly be the result of exchange rate fluctuations) and investors may not get back the full amount invested.
Important information
-
This marketing material is not intended as a recommendation to invest in any particular asset class, security or strategy. Regulatory requirements that require impartiality of investment/investment strategy recommendations are therefore not applicable nor are any prohibitions to trade before publication. The information provided is for illustrative purposes only, it should not be relied upon as recommendations to buy or sell securities. Where individuals or the business have expressed opinions, they are based on current market conditions, they may differ from those of other investment professionals and are subject to change without notice.


