
Fixed Income The bond portfolio – tilted toward income
The focus on income of our mixed-asset funds means that bond exposure is predominantly tilted toward corporate bonds, typically high yield and higher yielding investment grade.

Today’s low bond yields and rising interest rate expectations provide a challenging backdrop for fixed income investors. Bond market returns are likely to be modest this year and investors are having to manage their expectations accordingly. On the other hand, we believe that the current market environment provides a favourable backdrop for equities.
The divergent outlooks highlight the benefit of generating income from different asset classes. In this note we explain why we think the equity component of the Invesco Pan European High Income Fund can help to deliver attractive income and capital growth this year.
First, equities provide an important source of income for the fund. Given the relative valuations of bond and equity markets, the yield of the equity component is currently higher than the bond component.
Bond component 2.9%
Equity component 2.1%
Moreover, this income comes from a diversified pool of high quality European companies with strong balance sheets whose dividend yield is often significantly higher than the bond yield.
| Dividend yield (%) | Yield (%) of senior bond | |
| Sanofi | 3.8 | |
| Roche | 2.7 | -0.4 |
| Novartis | 3.6 | -0.3 |
| UPM-Kymmene | 3.8 | 0.1 |
| Deutsche Telekom | 3.4 | -0.2 |
| Cap Gemini | 1.2 | -0.1 |
| Deutsche Post AG | 2.8 | -0.2 |
| SAP SE | 1.6 | -0-3 |
| Total | 7.2 | -0.2 |
| Nordea | 7.8 | 0.2 |
Second, the fund’s equity prices have been rising sharply and due to the current economic and market backdrop, we see potential for this to continue.
There are several interesting factors which point towards a vigorous expansion in the global economy: huge fiscal stimulus, household and bank balance sheet strength, extreme interest rate policy accommodation, upgrades to global growth forecasts and surging money supply.
Globally, fiscal stimulus is being conducted on a huge scale. In the US, the just-approved American Rescue Plan is a $1.9trn stimulus package that follows on from the $900bn package approved in the last days of the Trump administration and the CARES Act, worth $1.8trn, in April 2020. According to the IMF, these combined packages amount to 20% of GDP and dwarf the $830bn American Recovery & Reinvestment Act fiscal package passed in 2010.
In Europe, a smaller but still significant fiscal plan known as NextGenerationEU, a €750bn package consisting of loans and grants, is in place. This is the largest ever stimulus announced by the EU and is worth 4.5% of GDP. In addition, government loans, guarantees and capital injections amount to 17% of GDP.
This chart shows the size of the fiscal boost in OECD economies as a result of higher spending, tax shortfalls and loans and guarantees.
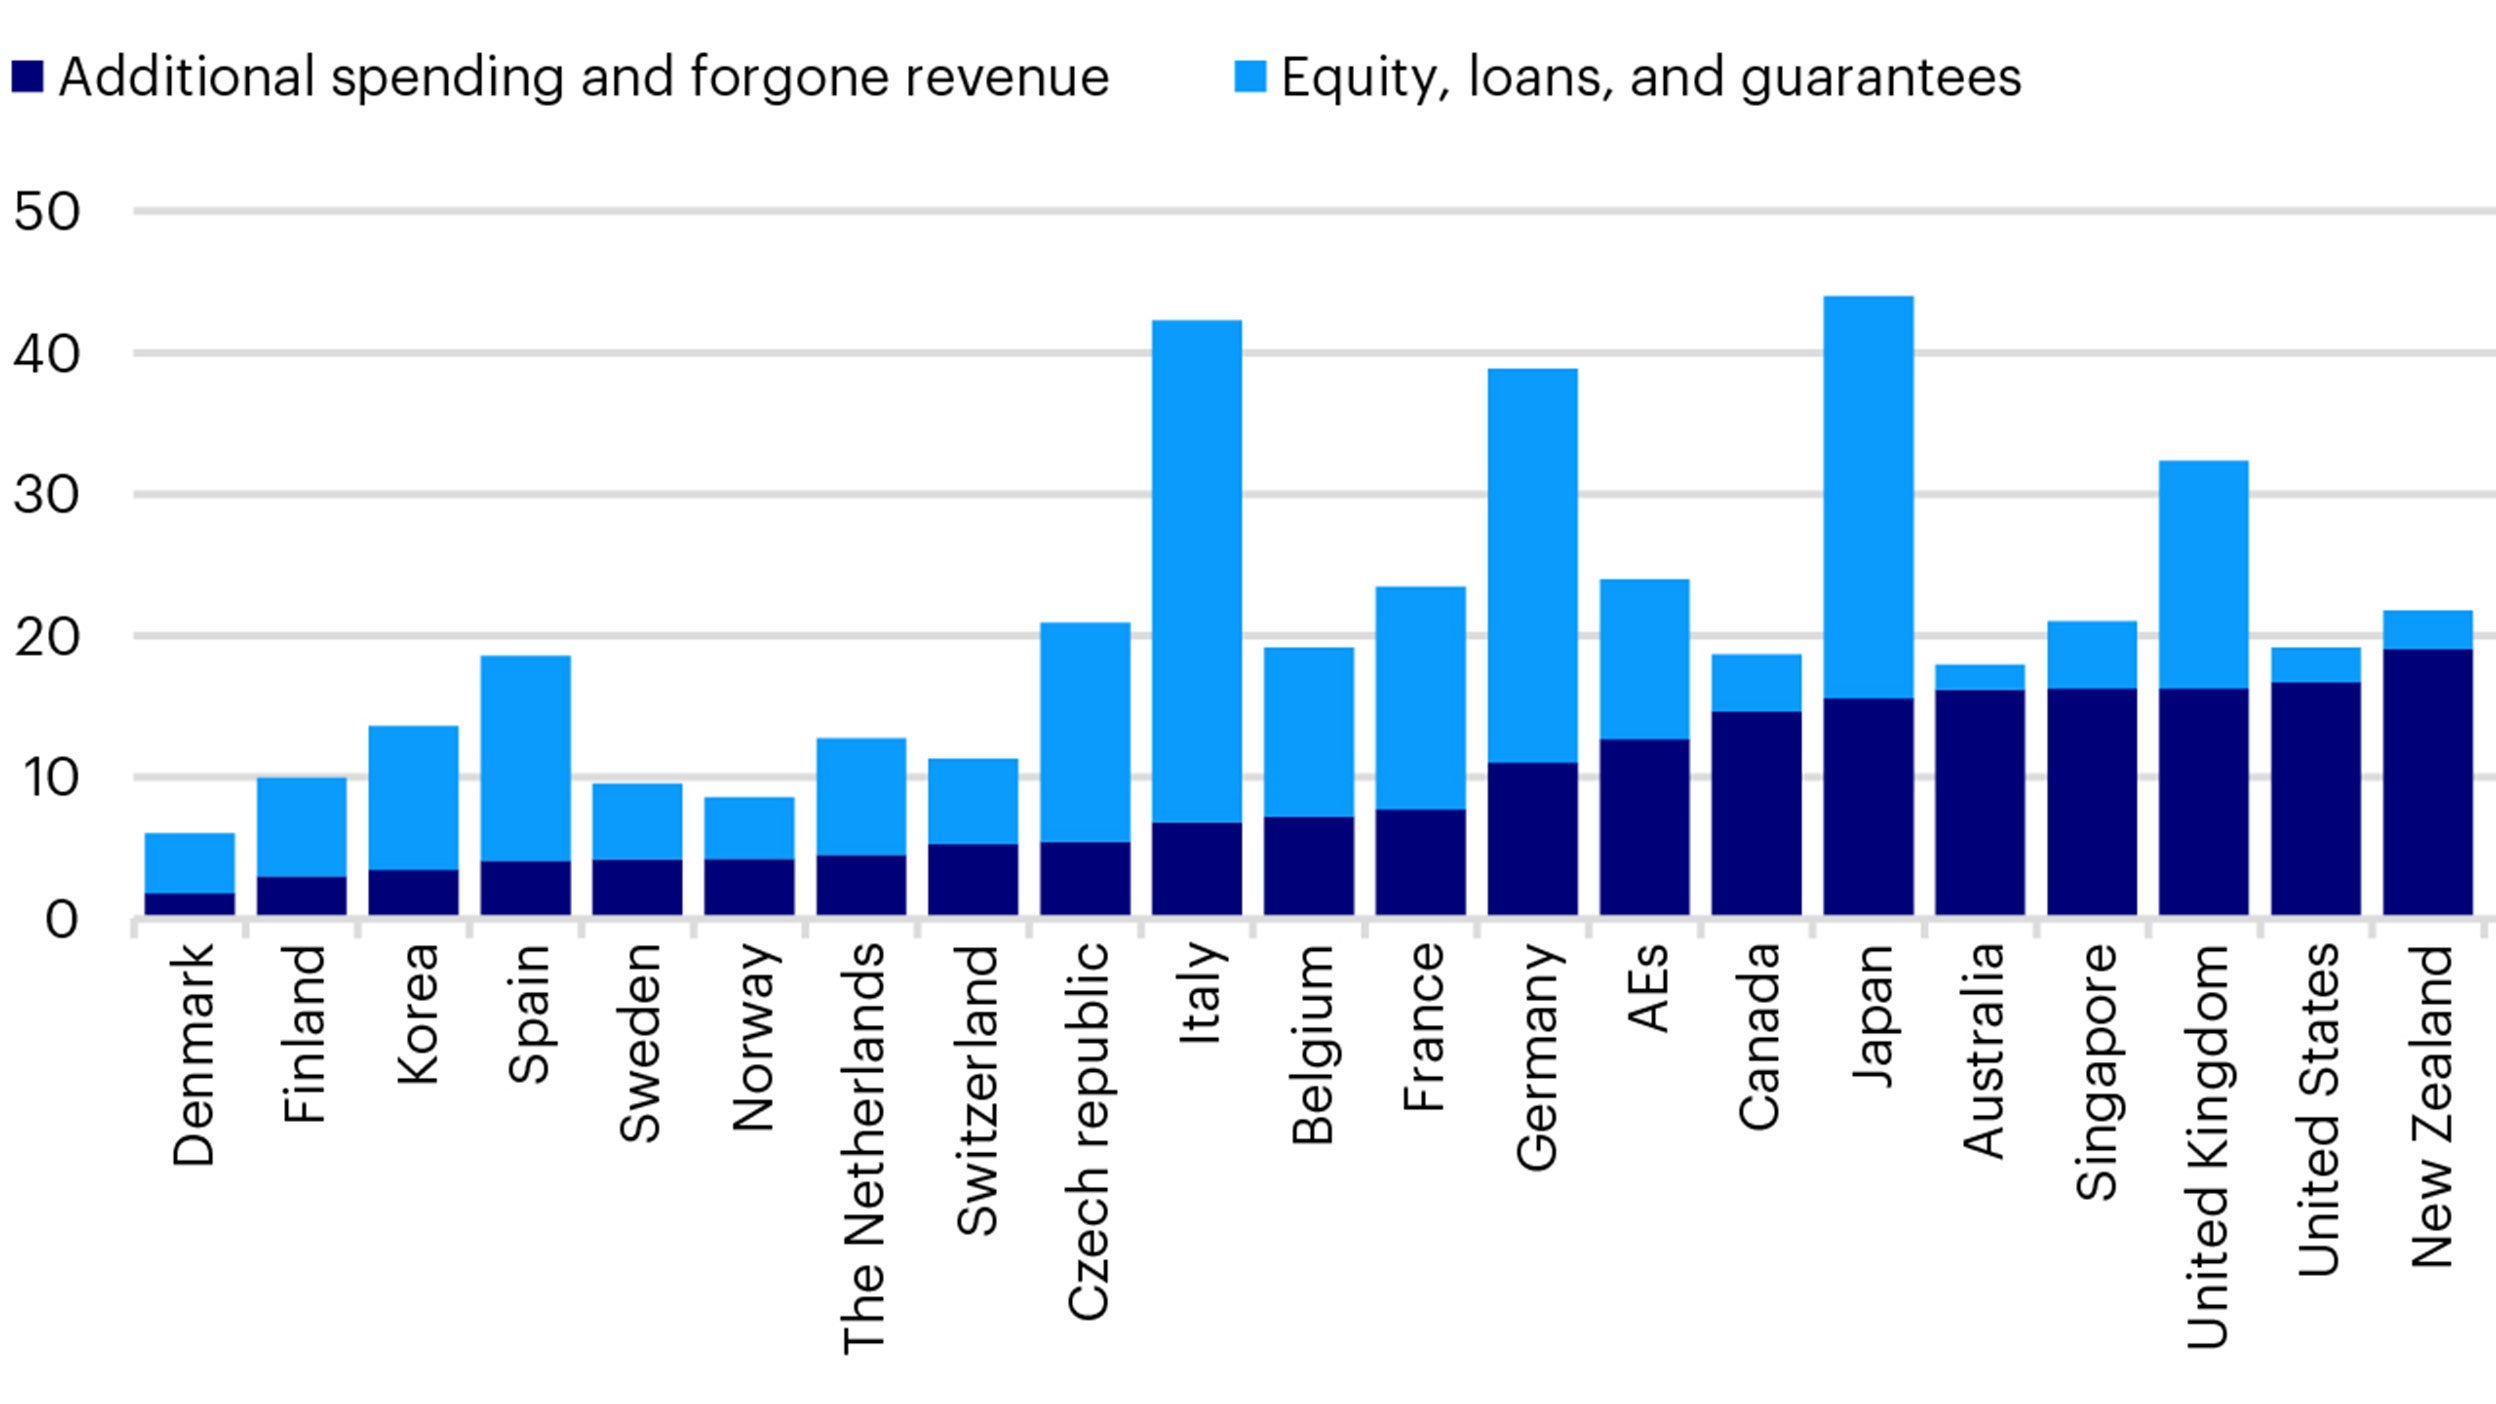
It’s clear that the consensus view on fiscal policy is very different to that of the post GFC climate as today is it hard to detect any political pressure to moderate this fiscal expansion. Recently, Victor Gaspar, the head of the IMF’s fiscal policy unit articulated this new consensus when he stated that “the pressure to have debt coming down is something that we can let play out over a long time horizon and that the adjustment in the public debt ratio should be mostly gradual.”
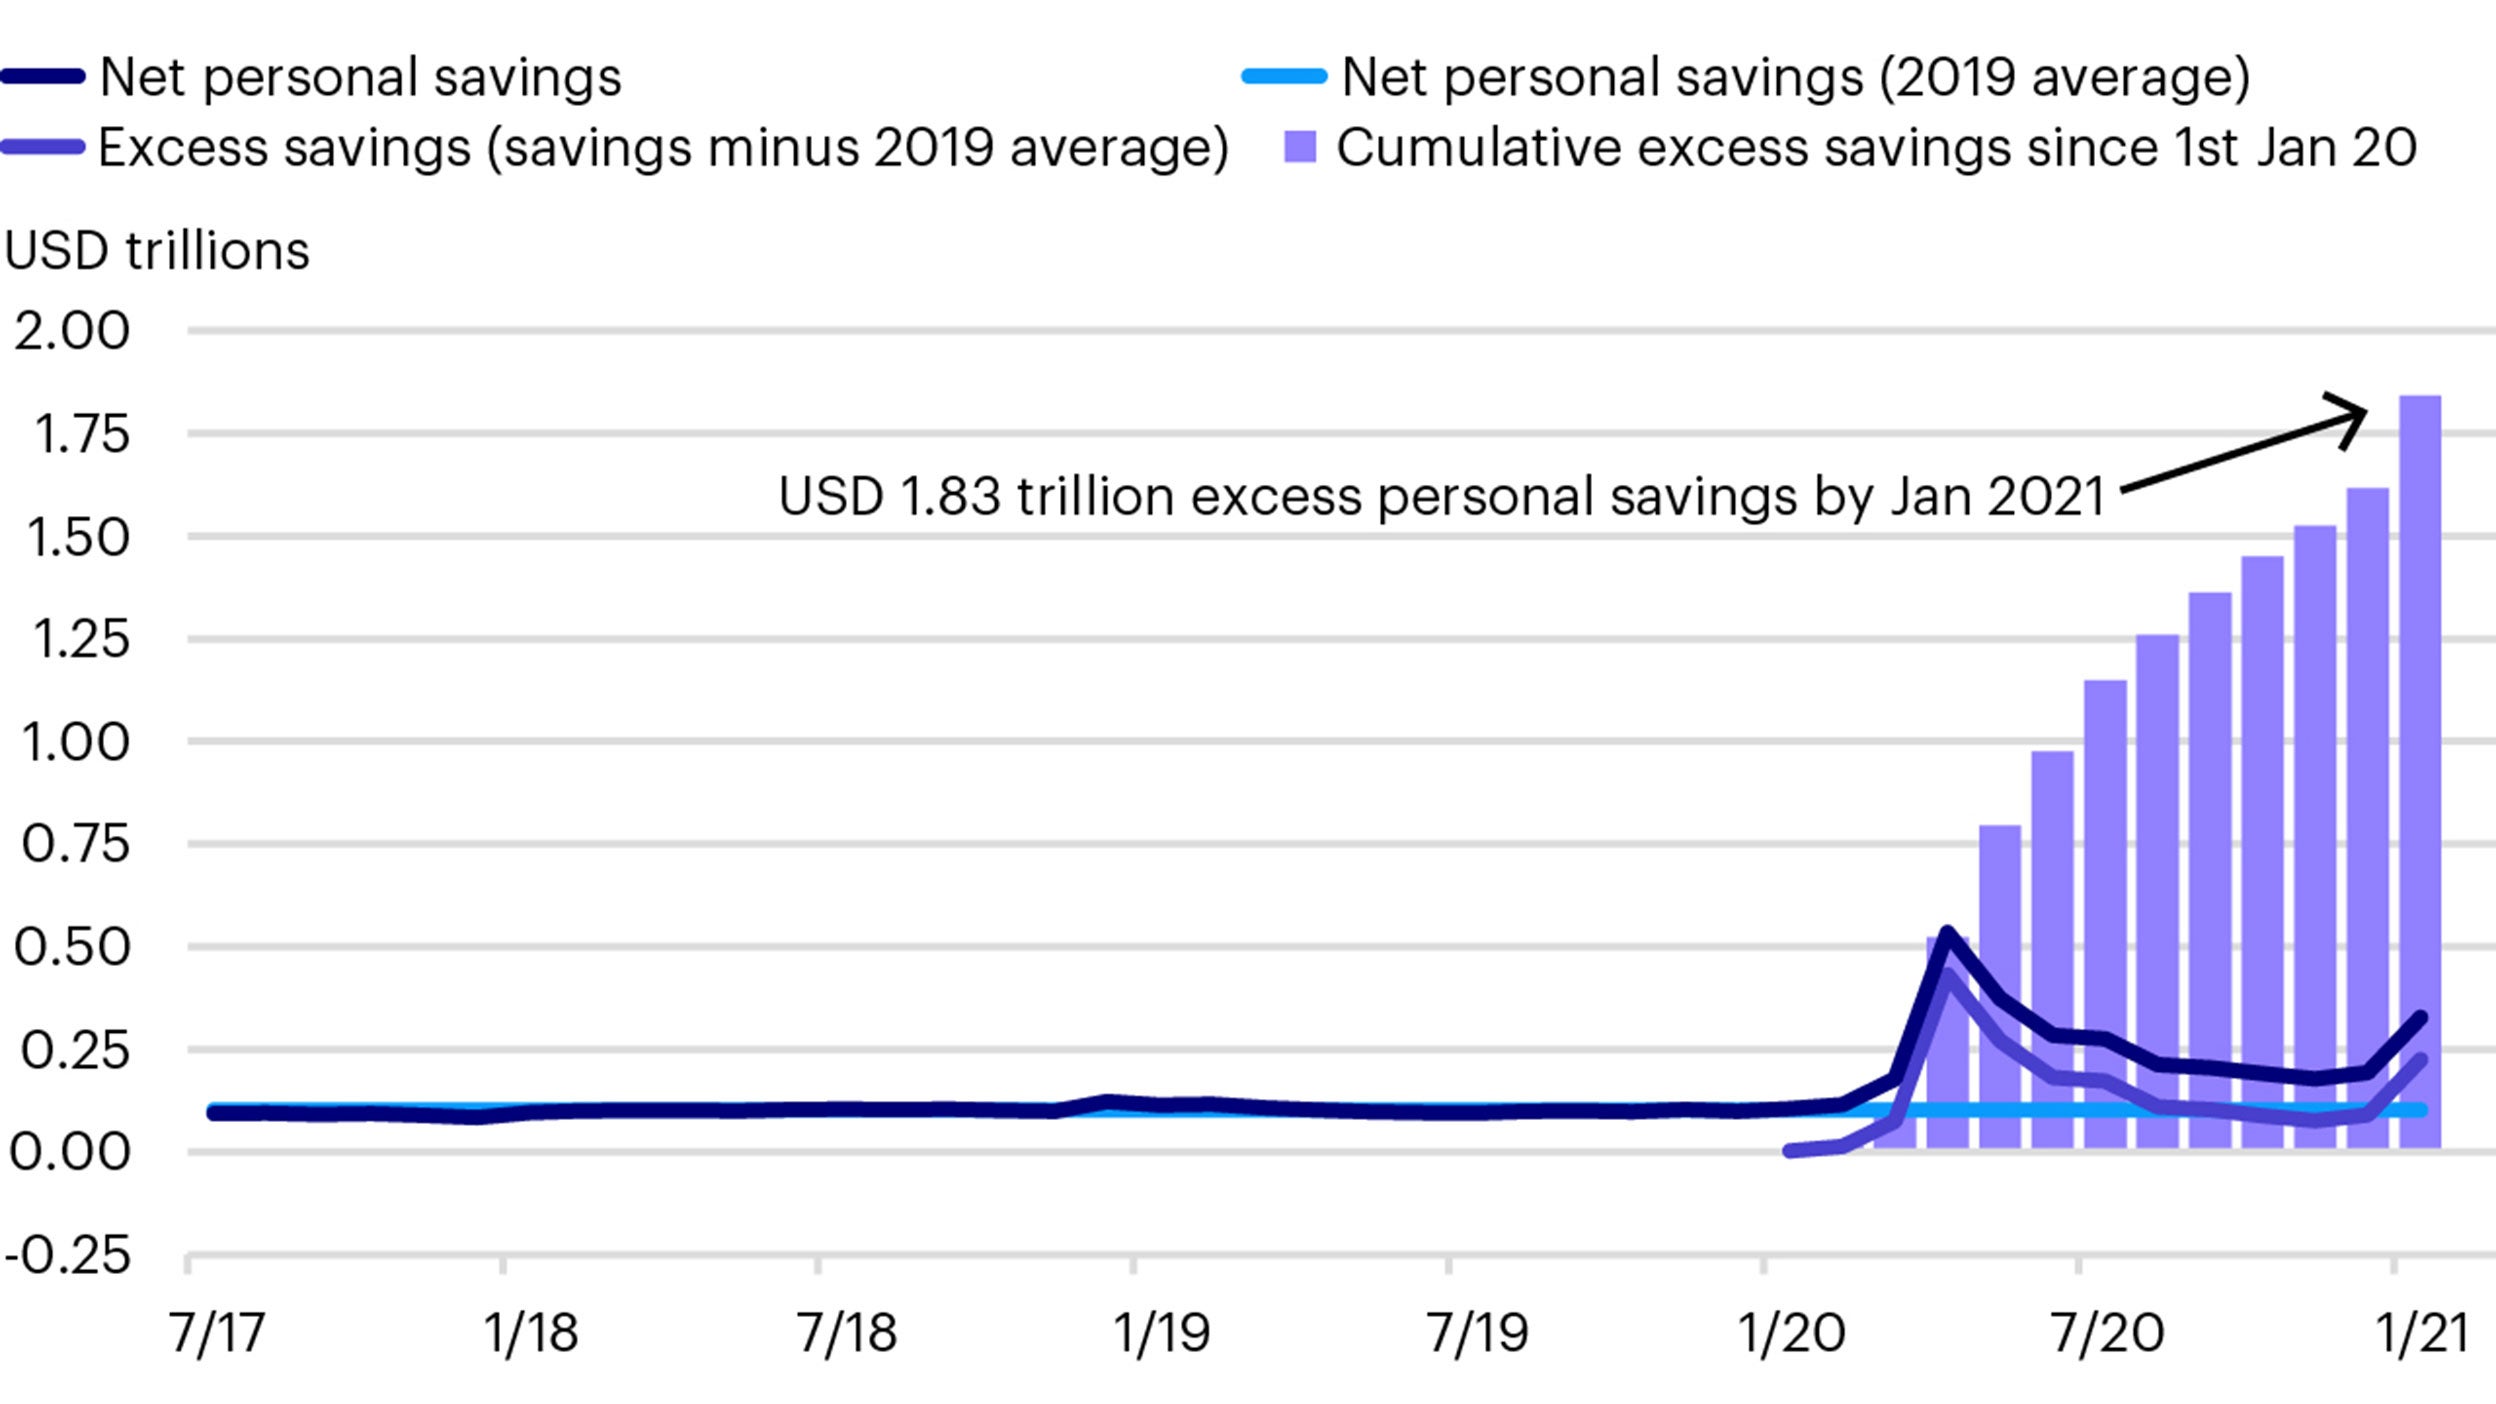
In the US, fiscal expenditures have led to a huge boost to disposable income. The CARES Act payments alone saw US disposable income rise to a +20% year on year pace. Combined with the enforced curtailment of expenditures, this has created a significant improvement in US household balance sheets and the potential for a big increase in expenditures as the year progresses.
As the chart below shows, typically, US households save $100bn per month but last year that increased to between $200bn and $500bn. The chart also shows that US net saving (disposable income minus outlays) has reached $1.75trn, or 8% of GDP.
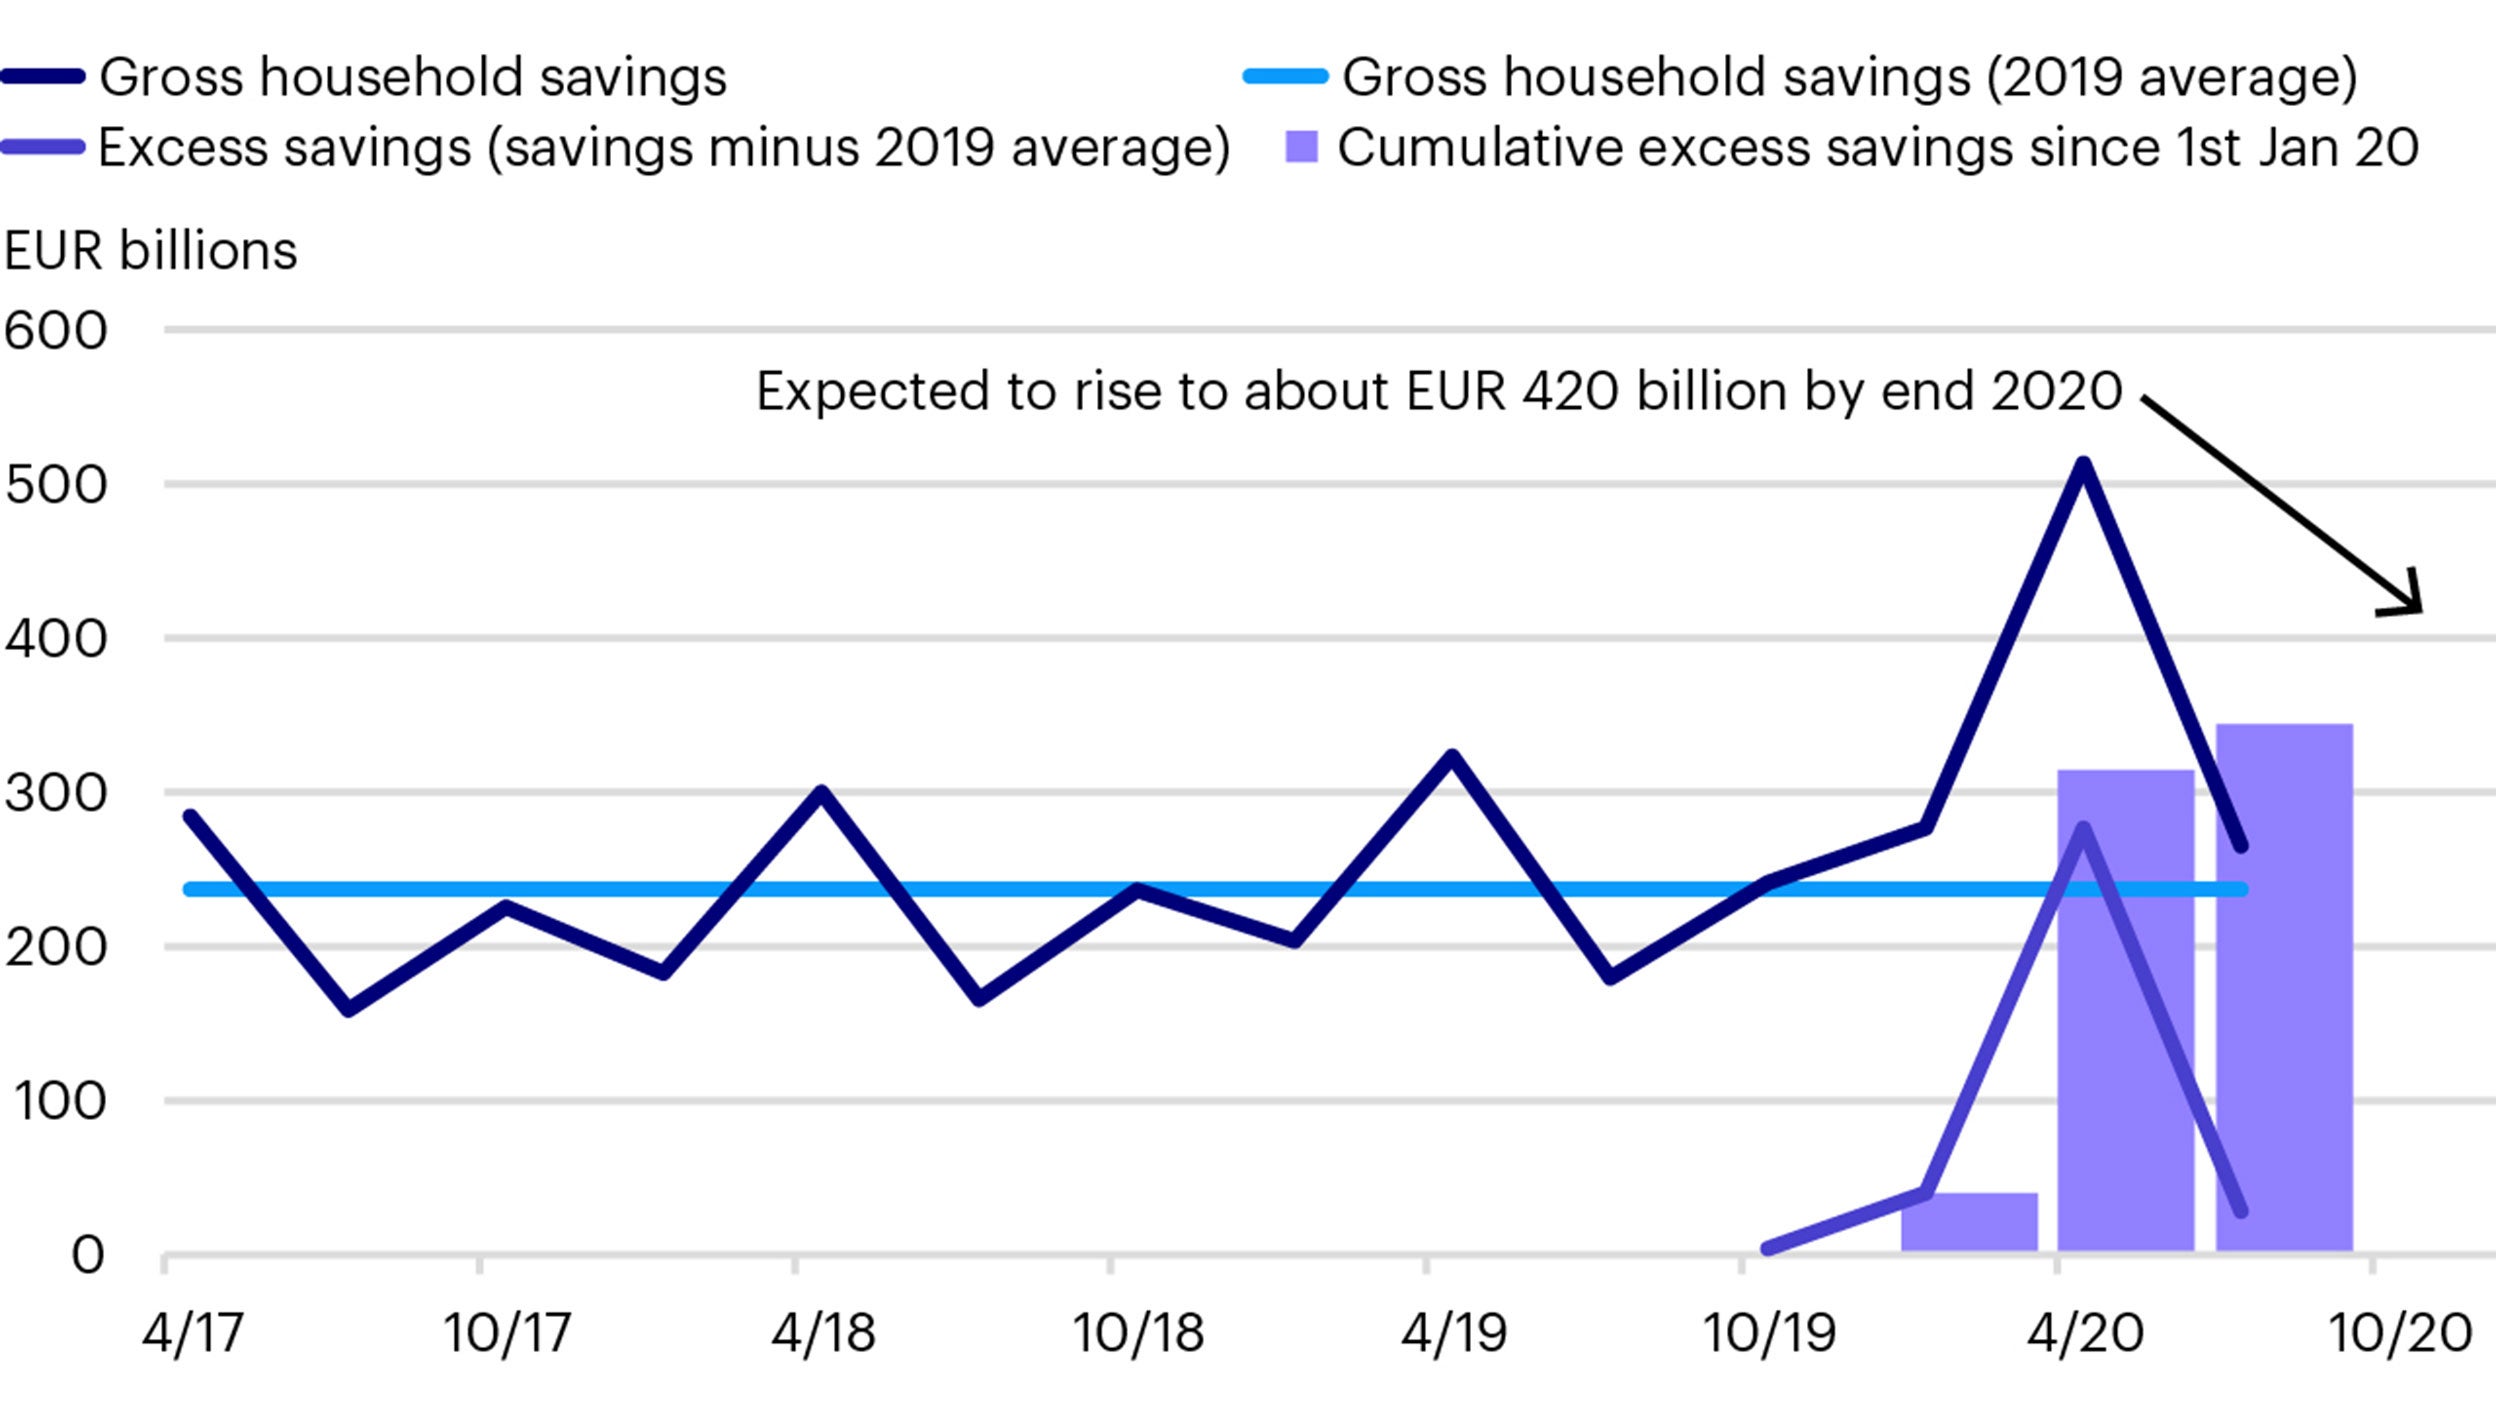
A similar trend can be seen in Europe where excess savings could rise to in excess of 3% of Eurozone GDP.
Another feature of the recession has been the relative health of the banking sector. Banks in the US and Europe have plentiful capital and liquidity and were well able to withstand the collapse in economic activity last year.
Banks in Europe were forced to suspend dividends but most remained profitable even through the peak of the crisis. Indeed, many banks have recently posted better-than-expected results, helped by lower-than-feared loan losses.
The capital distribution ban (dividend and share-buybacks) resulted in banks accumulating excess capital which is now slowly being returned to shareholders via dividends. Some management teams are even already announcing/preannouncing the resumption of share-buybacks.
The health of the banking sector suggests that it could be a support, rather than an impediment, to recovery in sharp contrast to the post GFC era when many institutions were focussed on balance sheet repair.
Against the backdrop of strong fiscal stimulus and a fully functioning banking sector, central banks have been very clear in their intention to keep policy rates low in order to support the recovery, which they believe can be achieved without generating overly strong inflationary pressures.
Interest rates are at record lows and central bank balance sheets continue to expand. In the US, the Federal Reserve is still buying $120bn of securities monthly and the ECB has extended its purchases under the PEPP programme until at least March 2022.
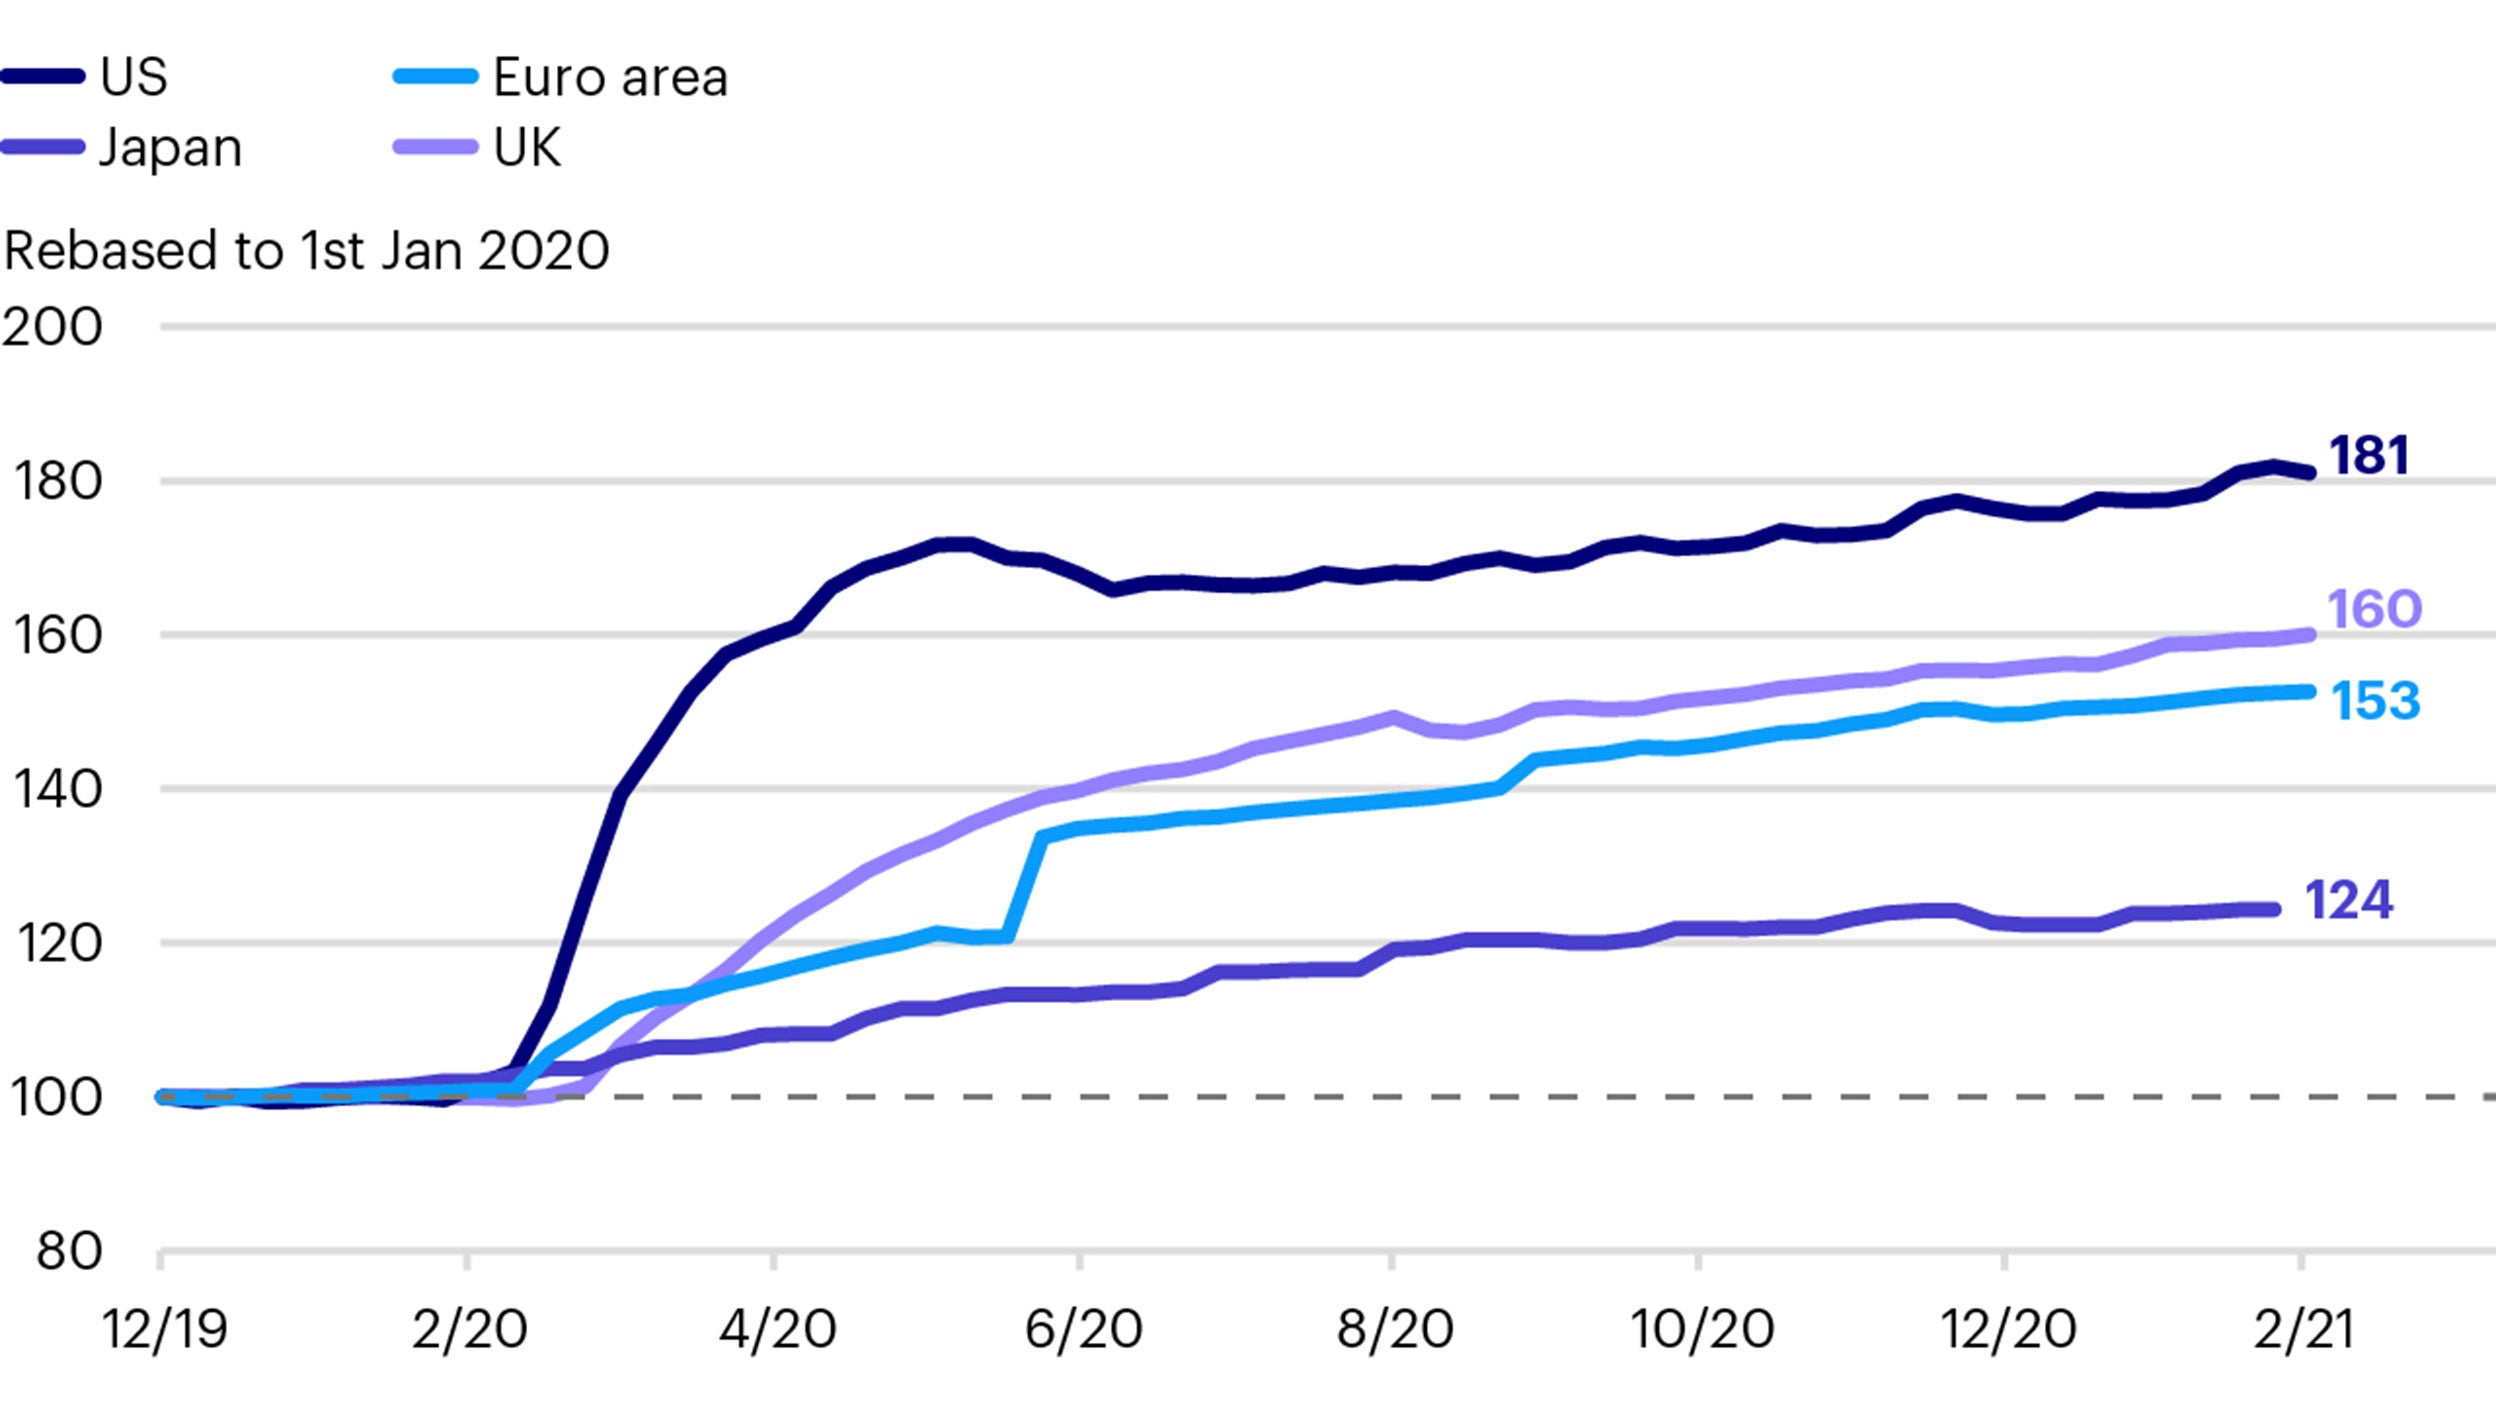
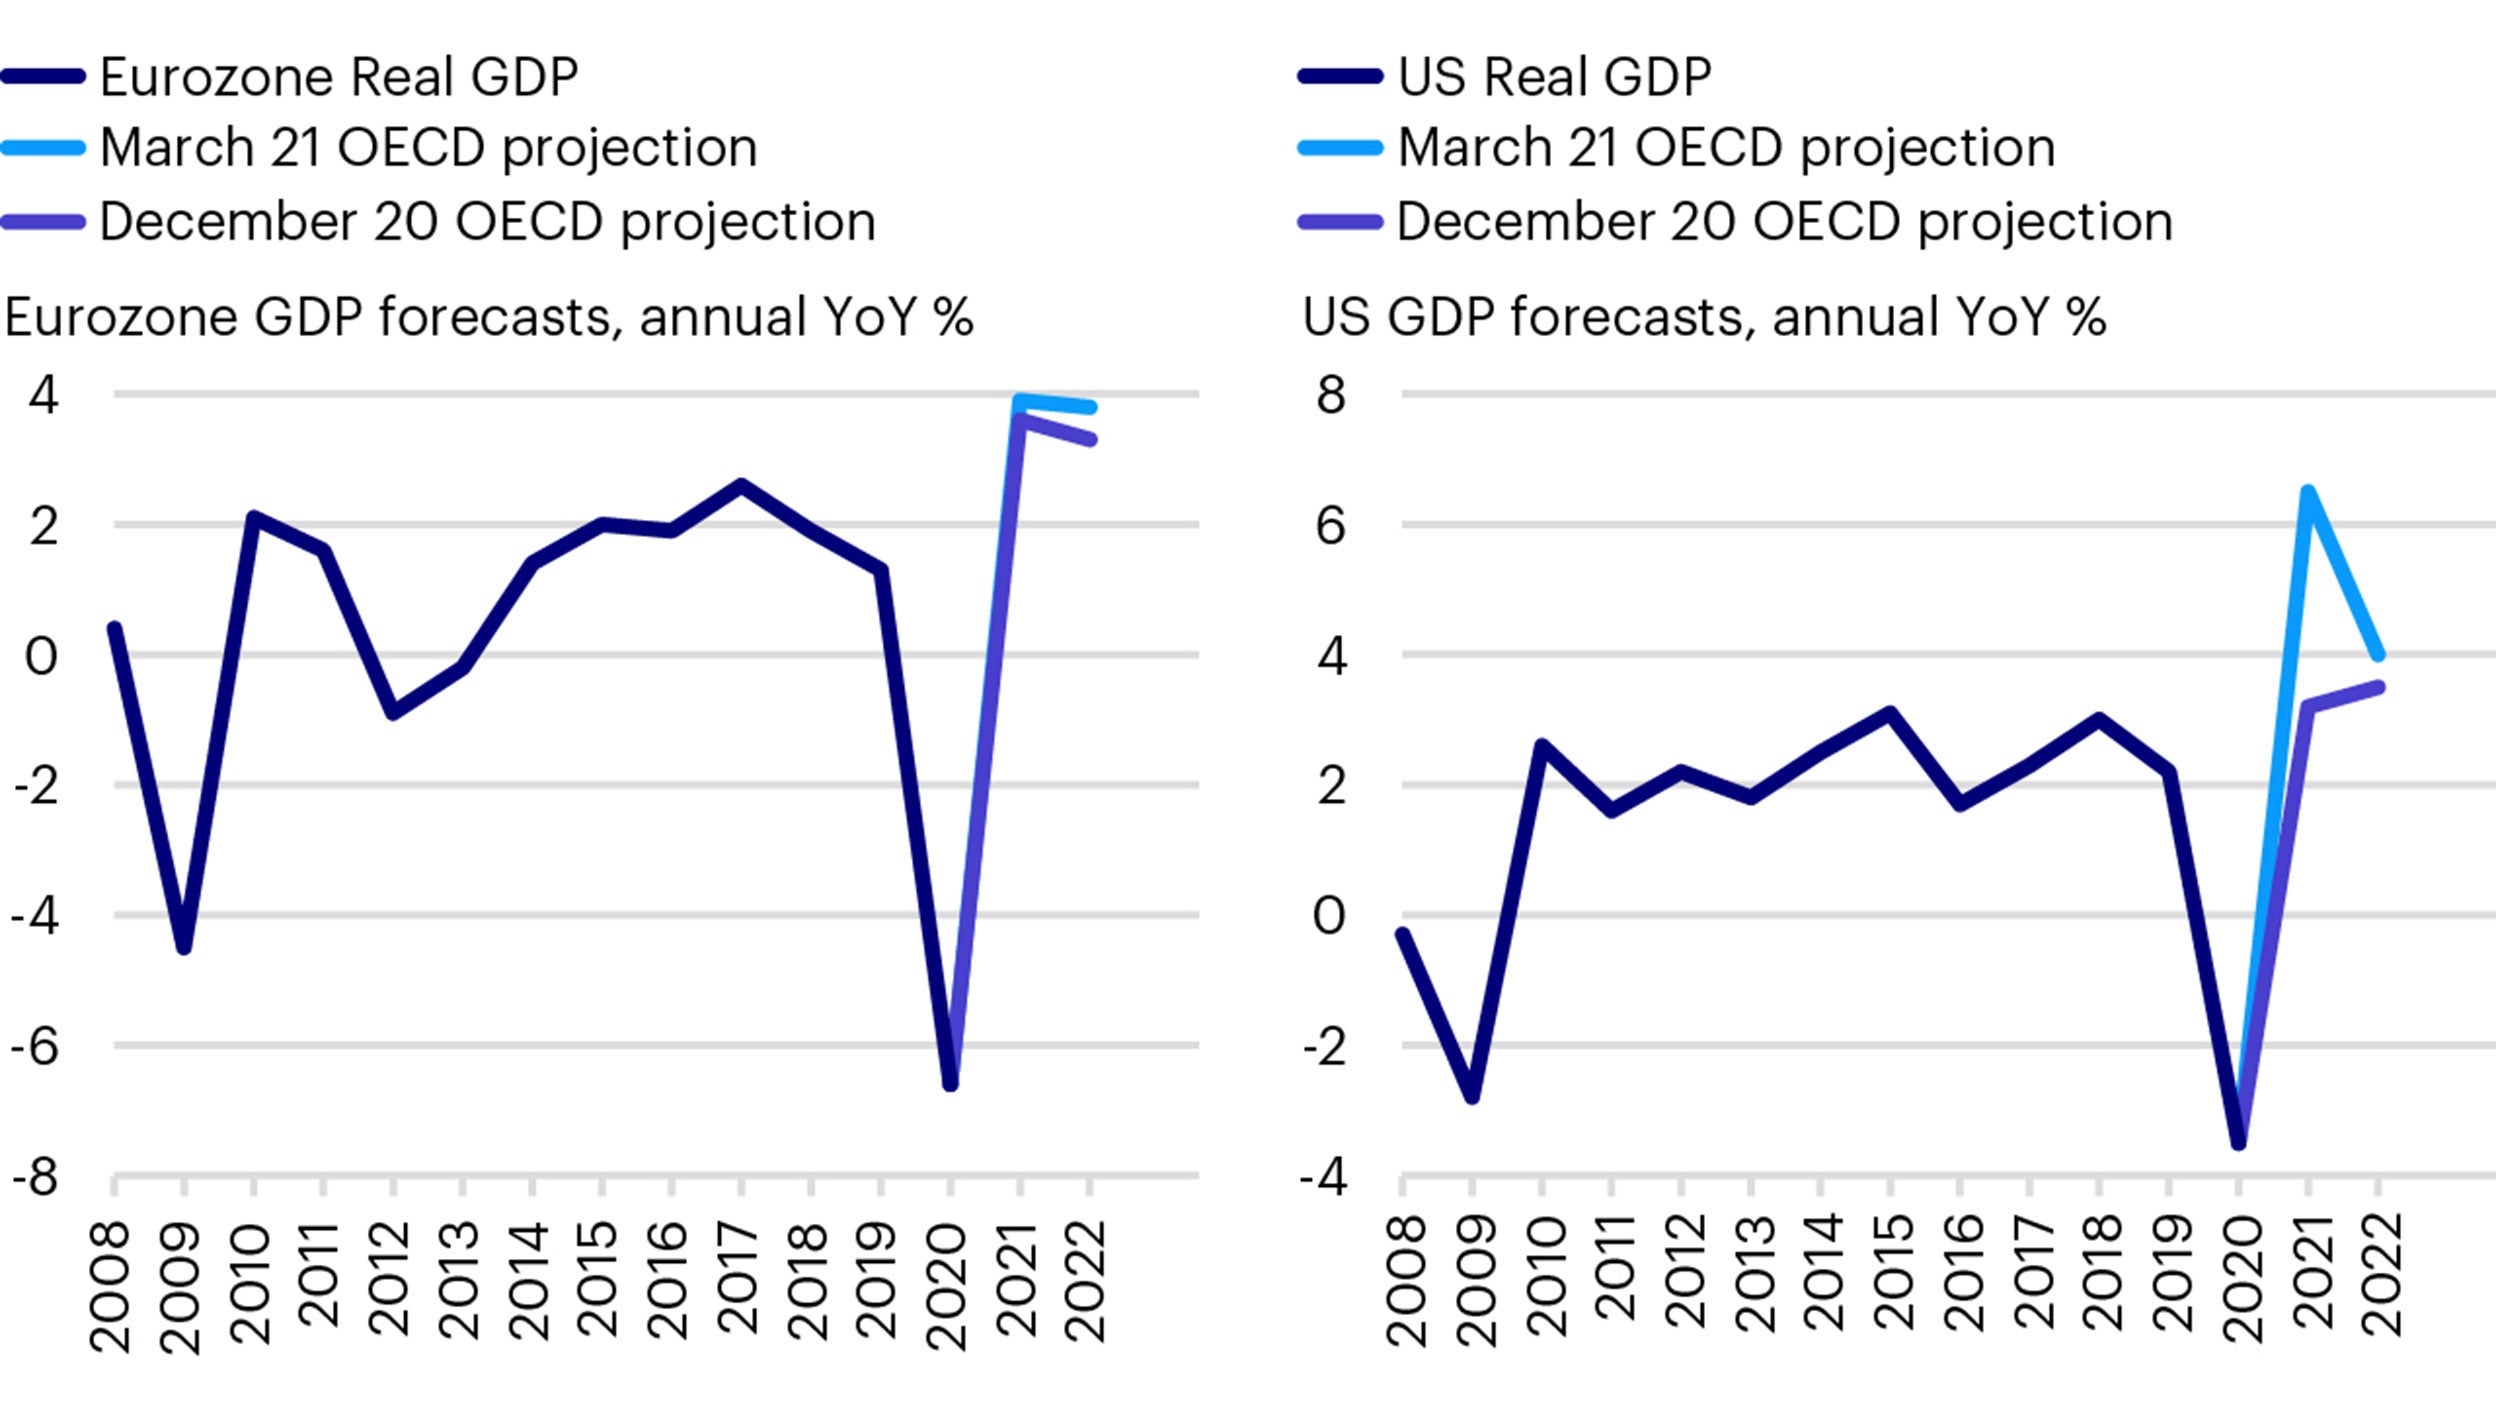
The combination of economies emerging from lockdowns, fiscal stimulus and pent up demand is leading to a strong economic recovery, for which forecasts have recently been revised upwards. GDP estimates for this year in the Euro area are close to 4% yoy and more than 6% for US GDP.
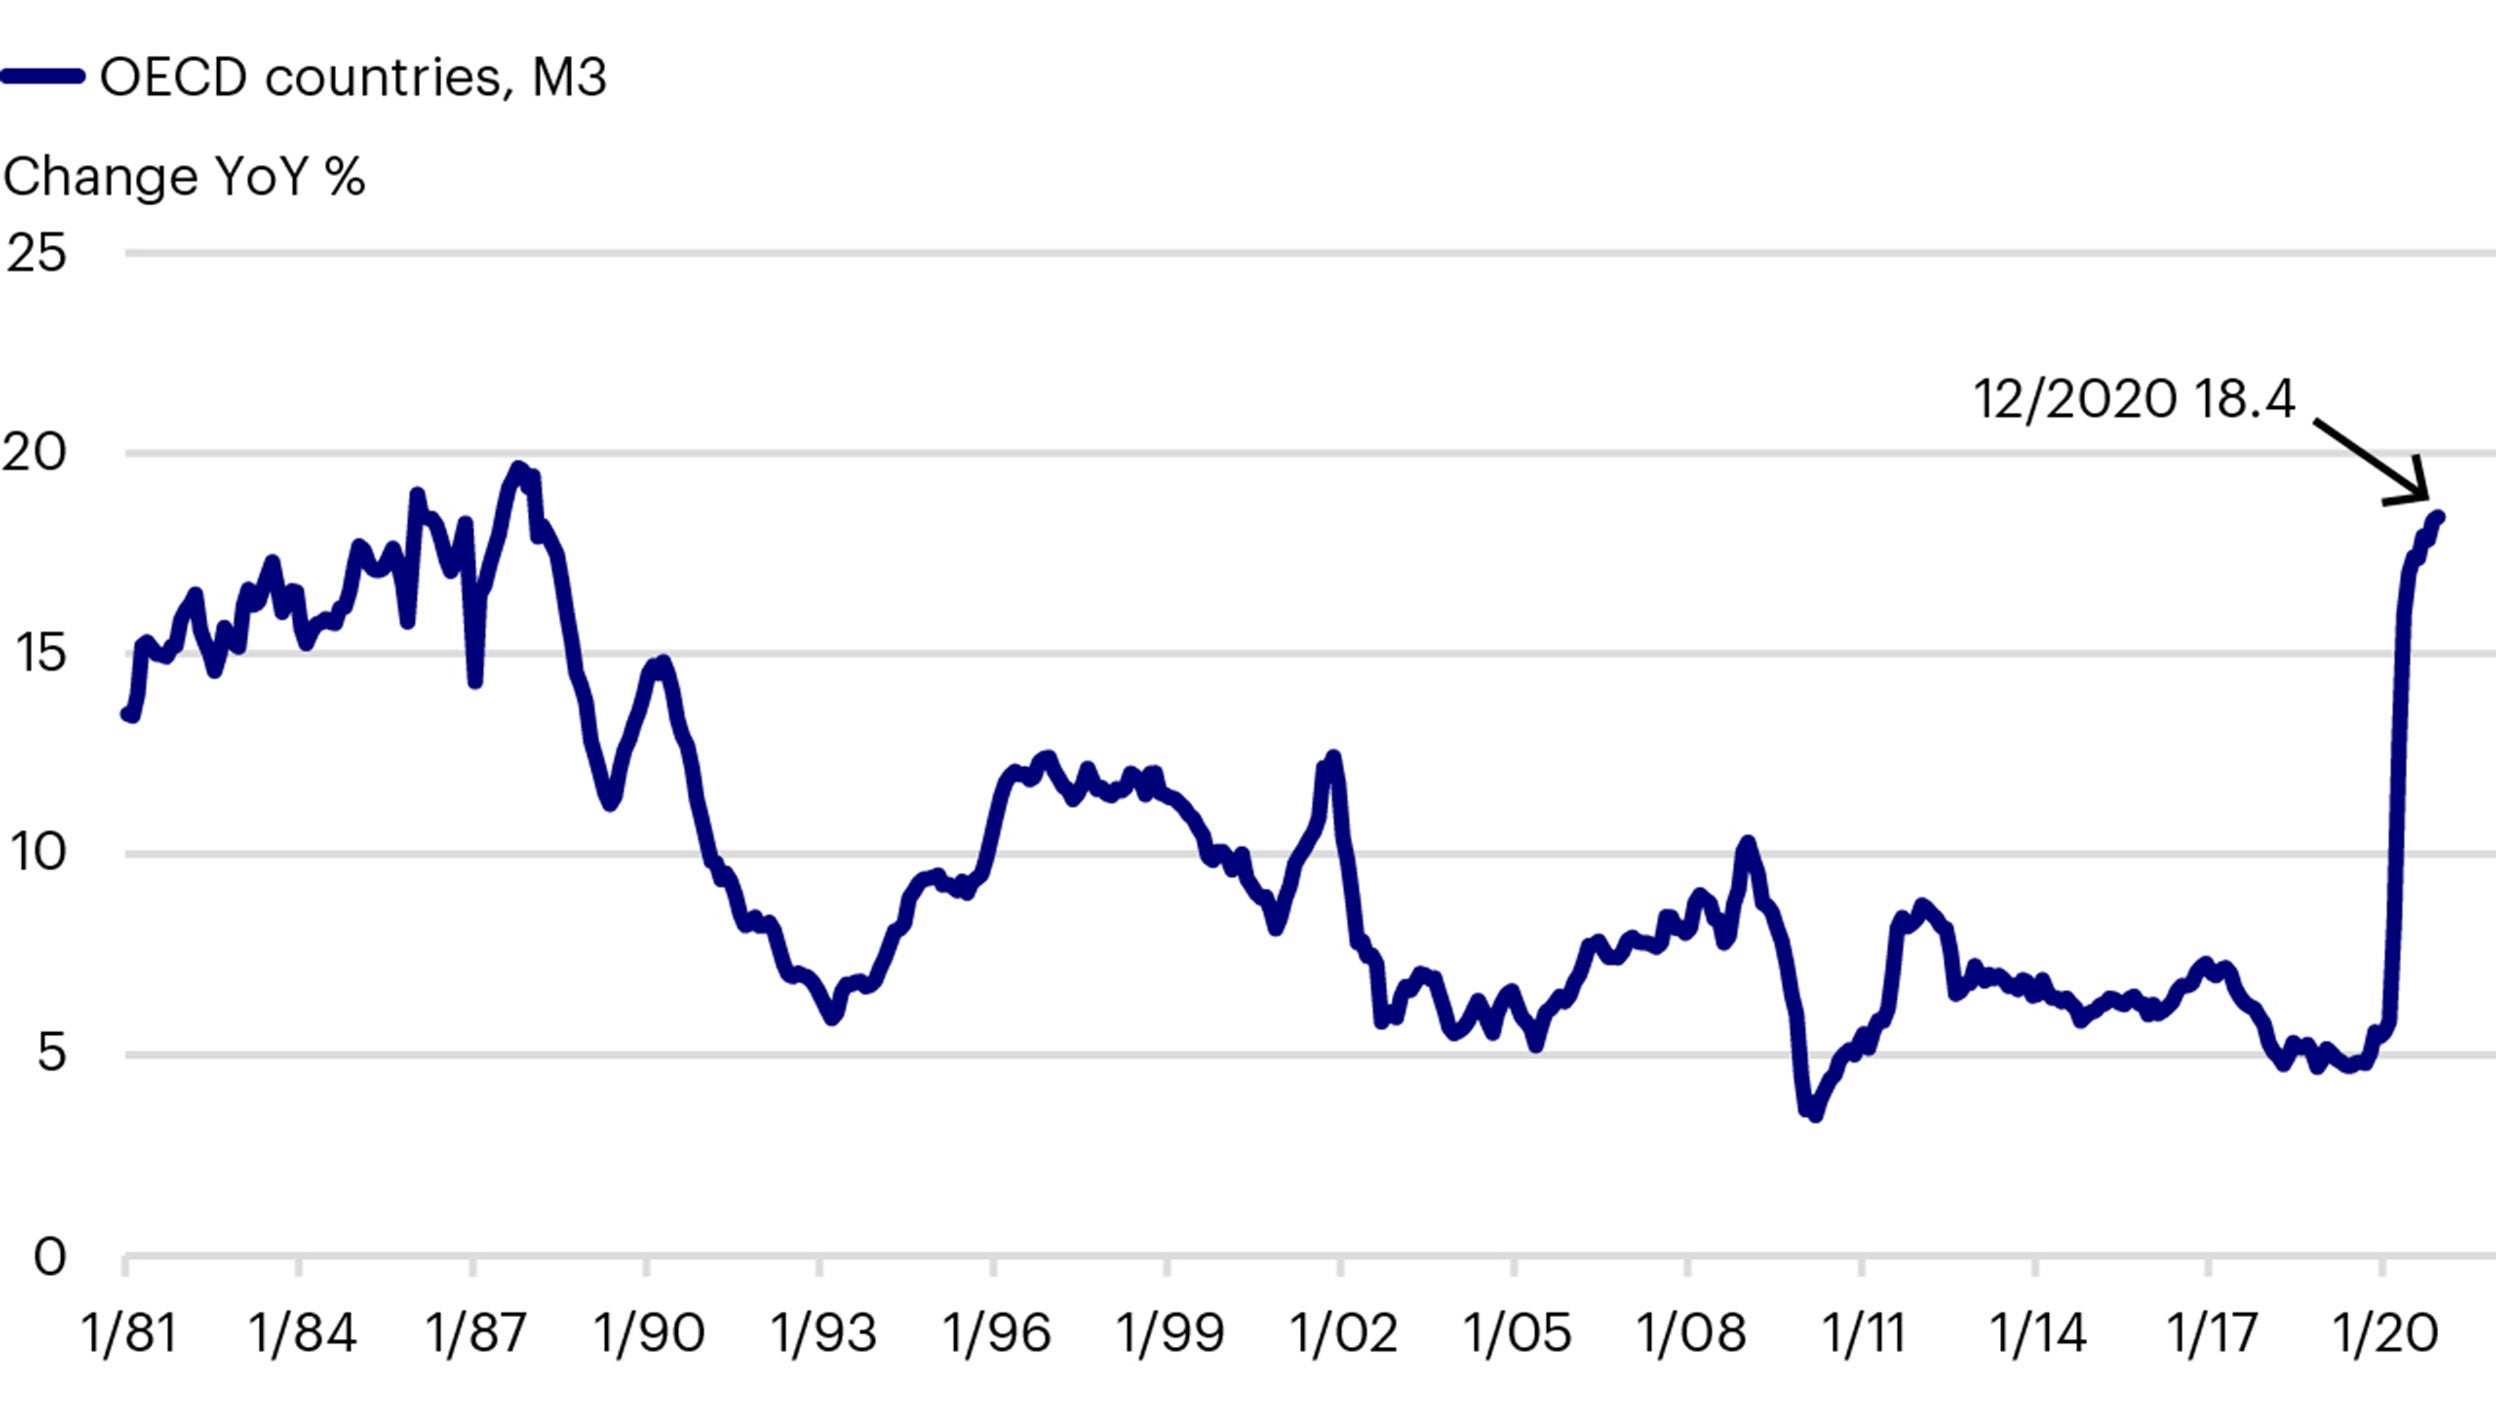
Another interesting feature of this recovery has been the recent explosion of money supply as a result of quantitative easing and fiscal stimulus. M3 (the broadest measure of money which includes currency, deposits and liquid financial products), is in the OECD growing at the fastest pace since the 1980s. Although increases of this rate are unlikely to be sustained, if money supply growth stays elevated, this should lead to higher nominal growth.
In response to these signs of economic recovery and rising money supply, investors in government bond markets are already starting to price in higher future nominal growth by demanding higher yields further out in the maturity spectrum, steepening the yield curves.
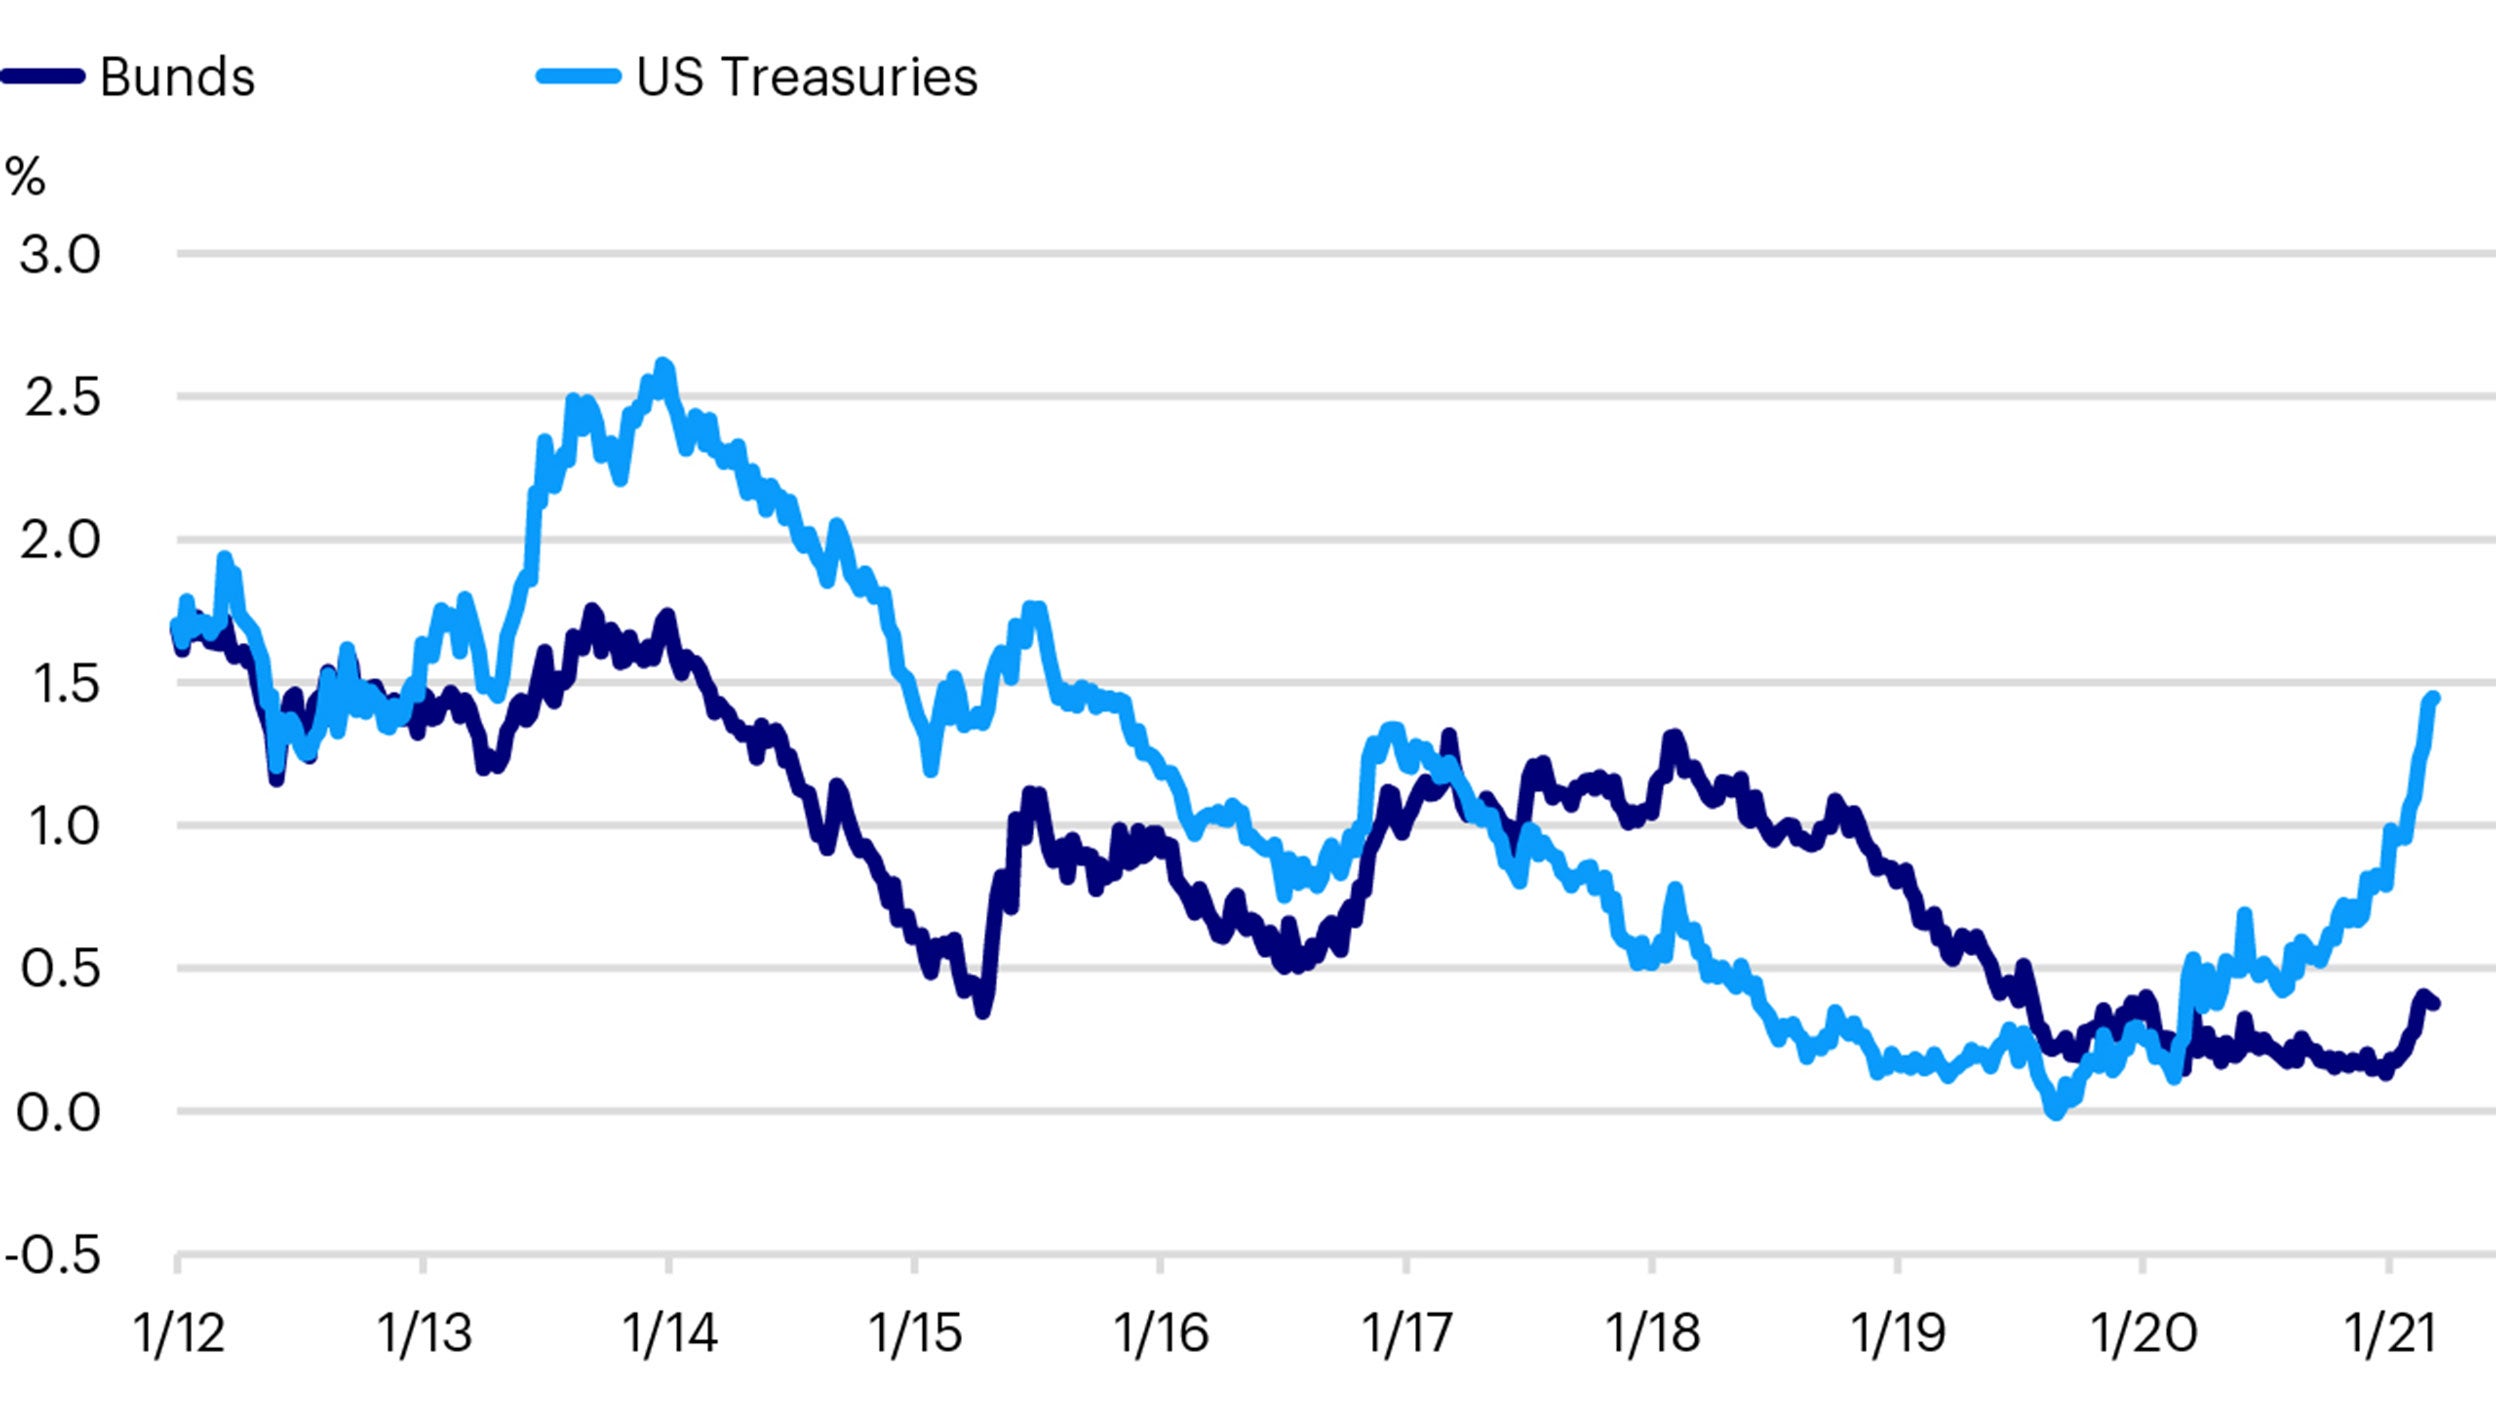
This yield curve steeping has led to losses in government bond markets. For example, the ICE BofA Euro Government Index is down -2.5% YTD and the ICE BofA All Maturity US Government Index is down -2.9%.
Given the tightness in credit spread, higher quality corporate bond markets have also posted losses. For example, the ICE BofA Euro Corporate Index is down -0.9%. By contrast, higher yielding bonds that are less affected by duration and produce higher income have been able to produce gains, with the high yield market up just over 1% in 2021.
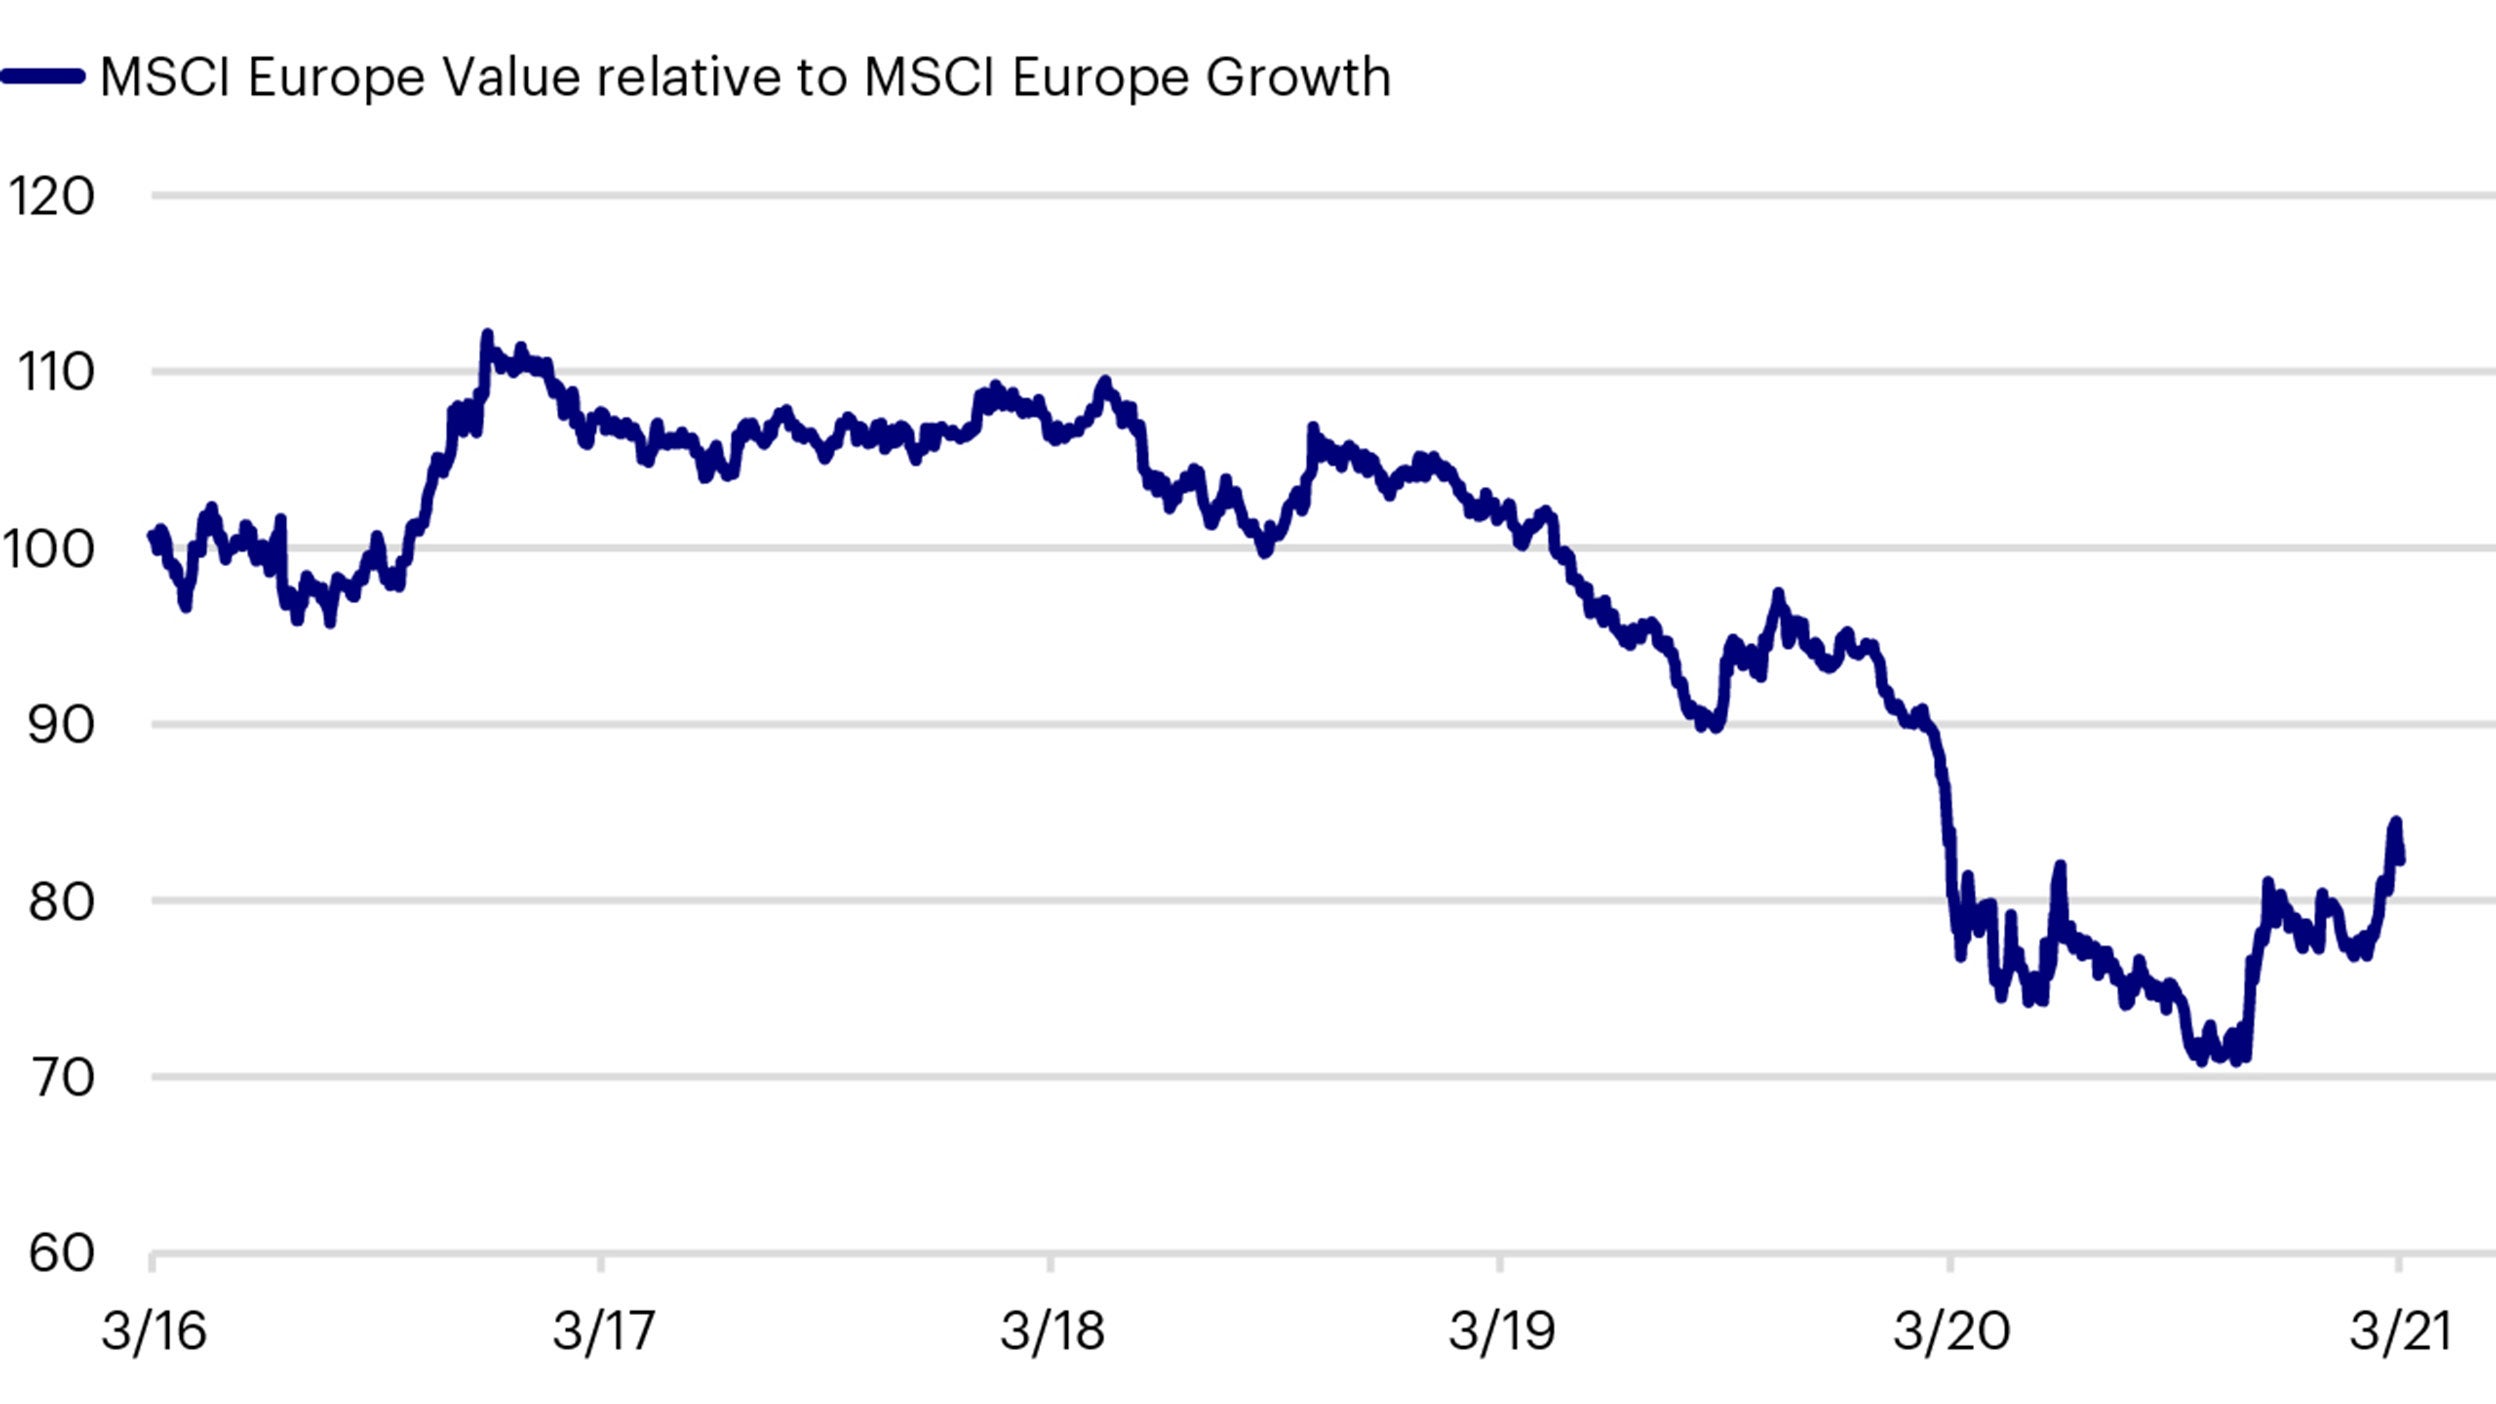
By contrast, the current economic and market backdrop is an attractive environment for equities, especially those which tend to do well in a cyclical upswing. Indeed, in recent months not only have equity markets been rising but cyclical and value-oriented equities have outperformed the broader market for the first time in several years.
The equity component makes up a fifth of the fund and typically consists of 45-55 positions.
| Equities sector exposure | Fund | Index | Difference |
| Communication Services | 9.7 | 3.9 | 5.8 |
| Utilities | 8.1 | 4.6 | 3.6 |
| Financials | 18.6 | 16.5 | 2.1 |
| Industrials | 16.0 | 14.6 | 1.4 |
| Energy | 6.2 | 4.8 | 1.4 |
| Health Care | 14.8 | 13.8 | 1.0 |
| Materials | 9.4 | 8.6 | 0.8 |
| Consumer Staples | 13.0 | 12.3 | 0.7 |
| Information Technology | 6.8 | 7.9 | -1.1 |
| Real Estate | 0.0 | 1.3 | -1.3 |
| Consumar Discretionary | 4.9 | 11.7 | -6.8 |
Source: Invesco as at February 2021.
Given the focus on income, the dividend yield of the equity component is also consistently higher than that of the MSCI Europe ex UK Index.
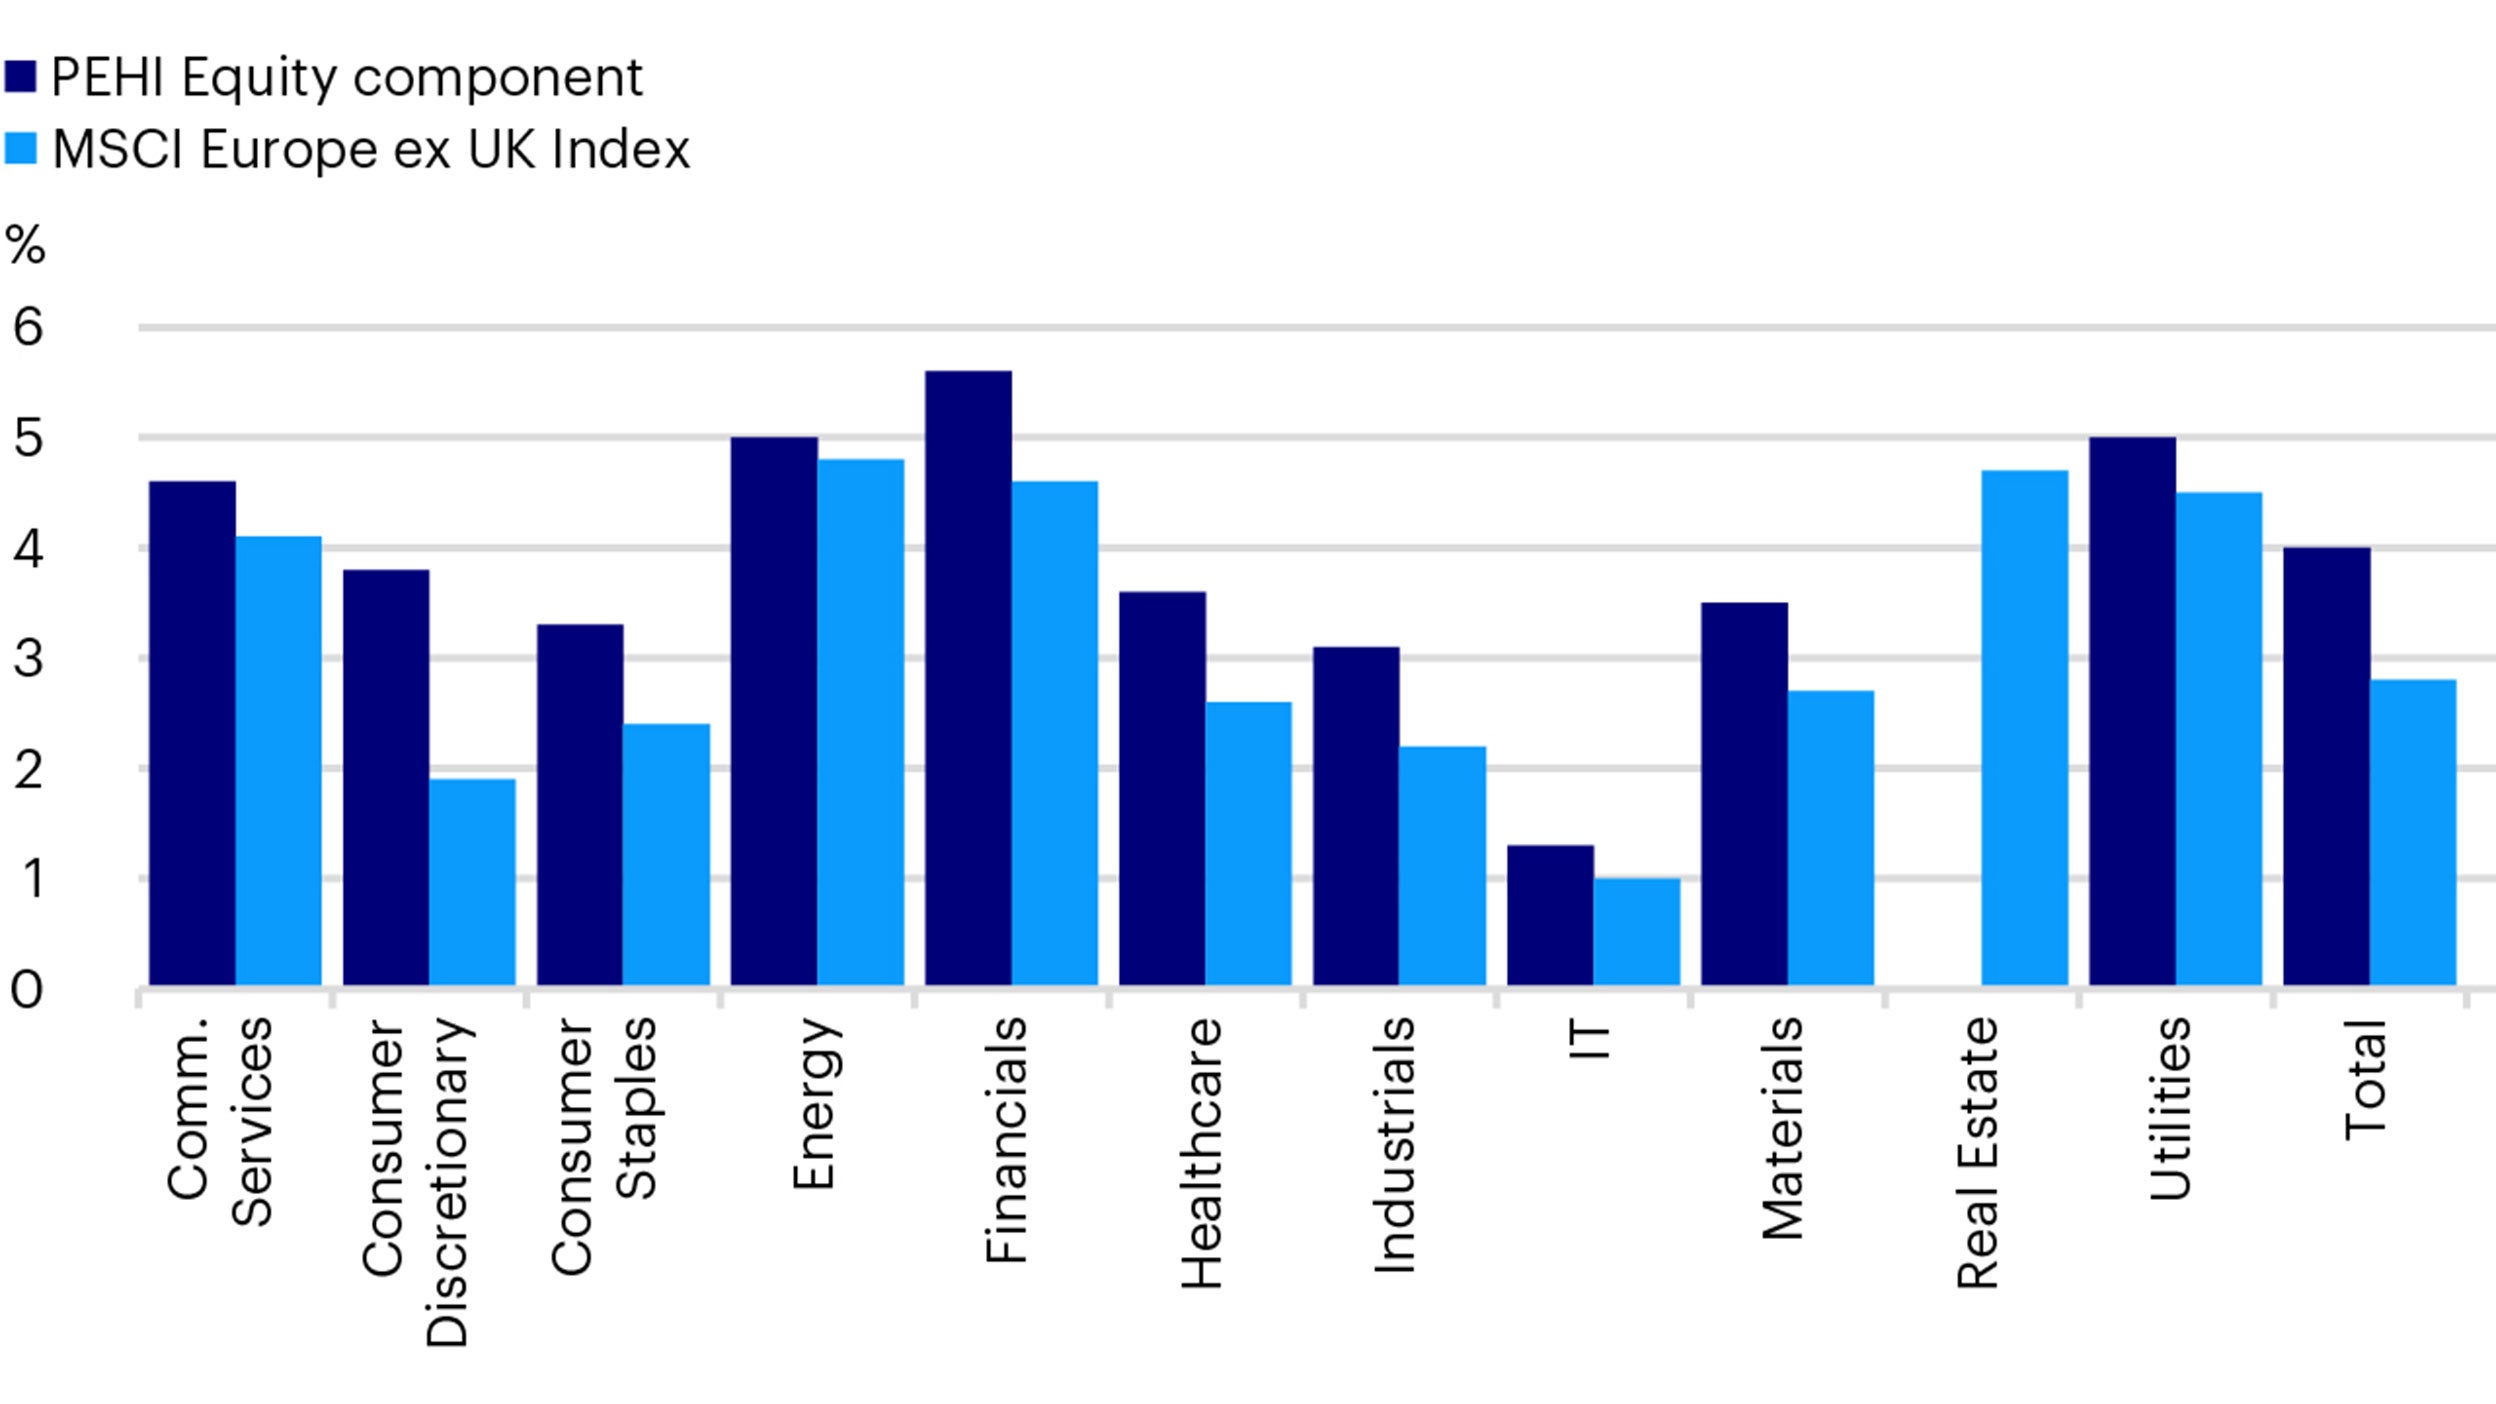
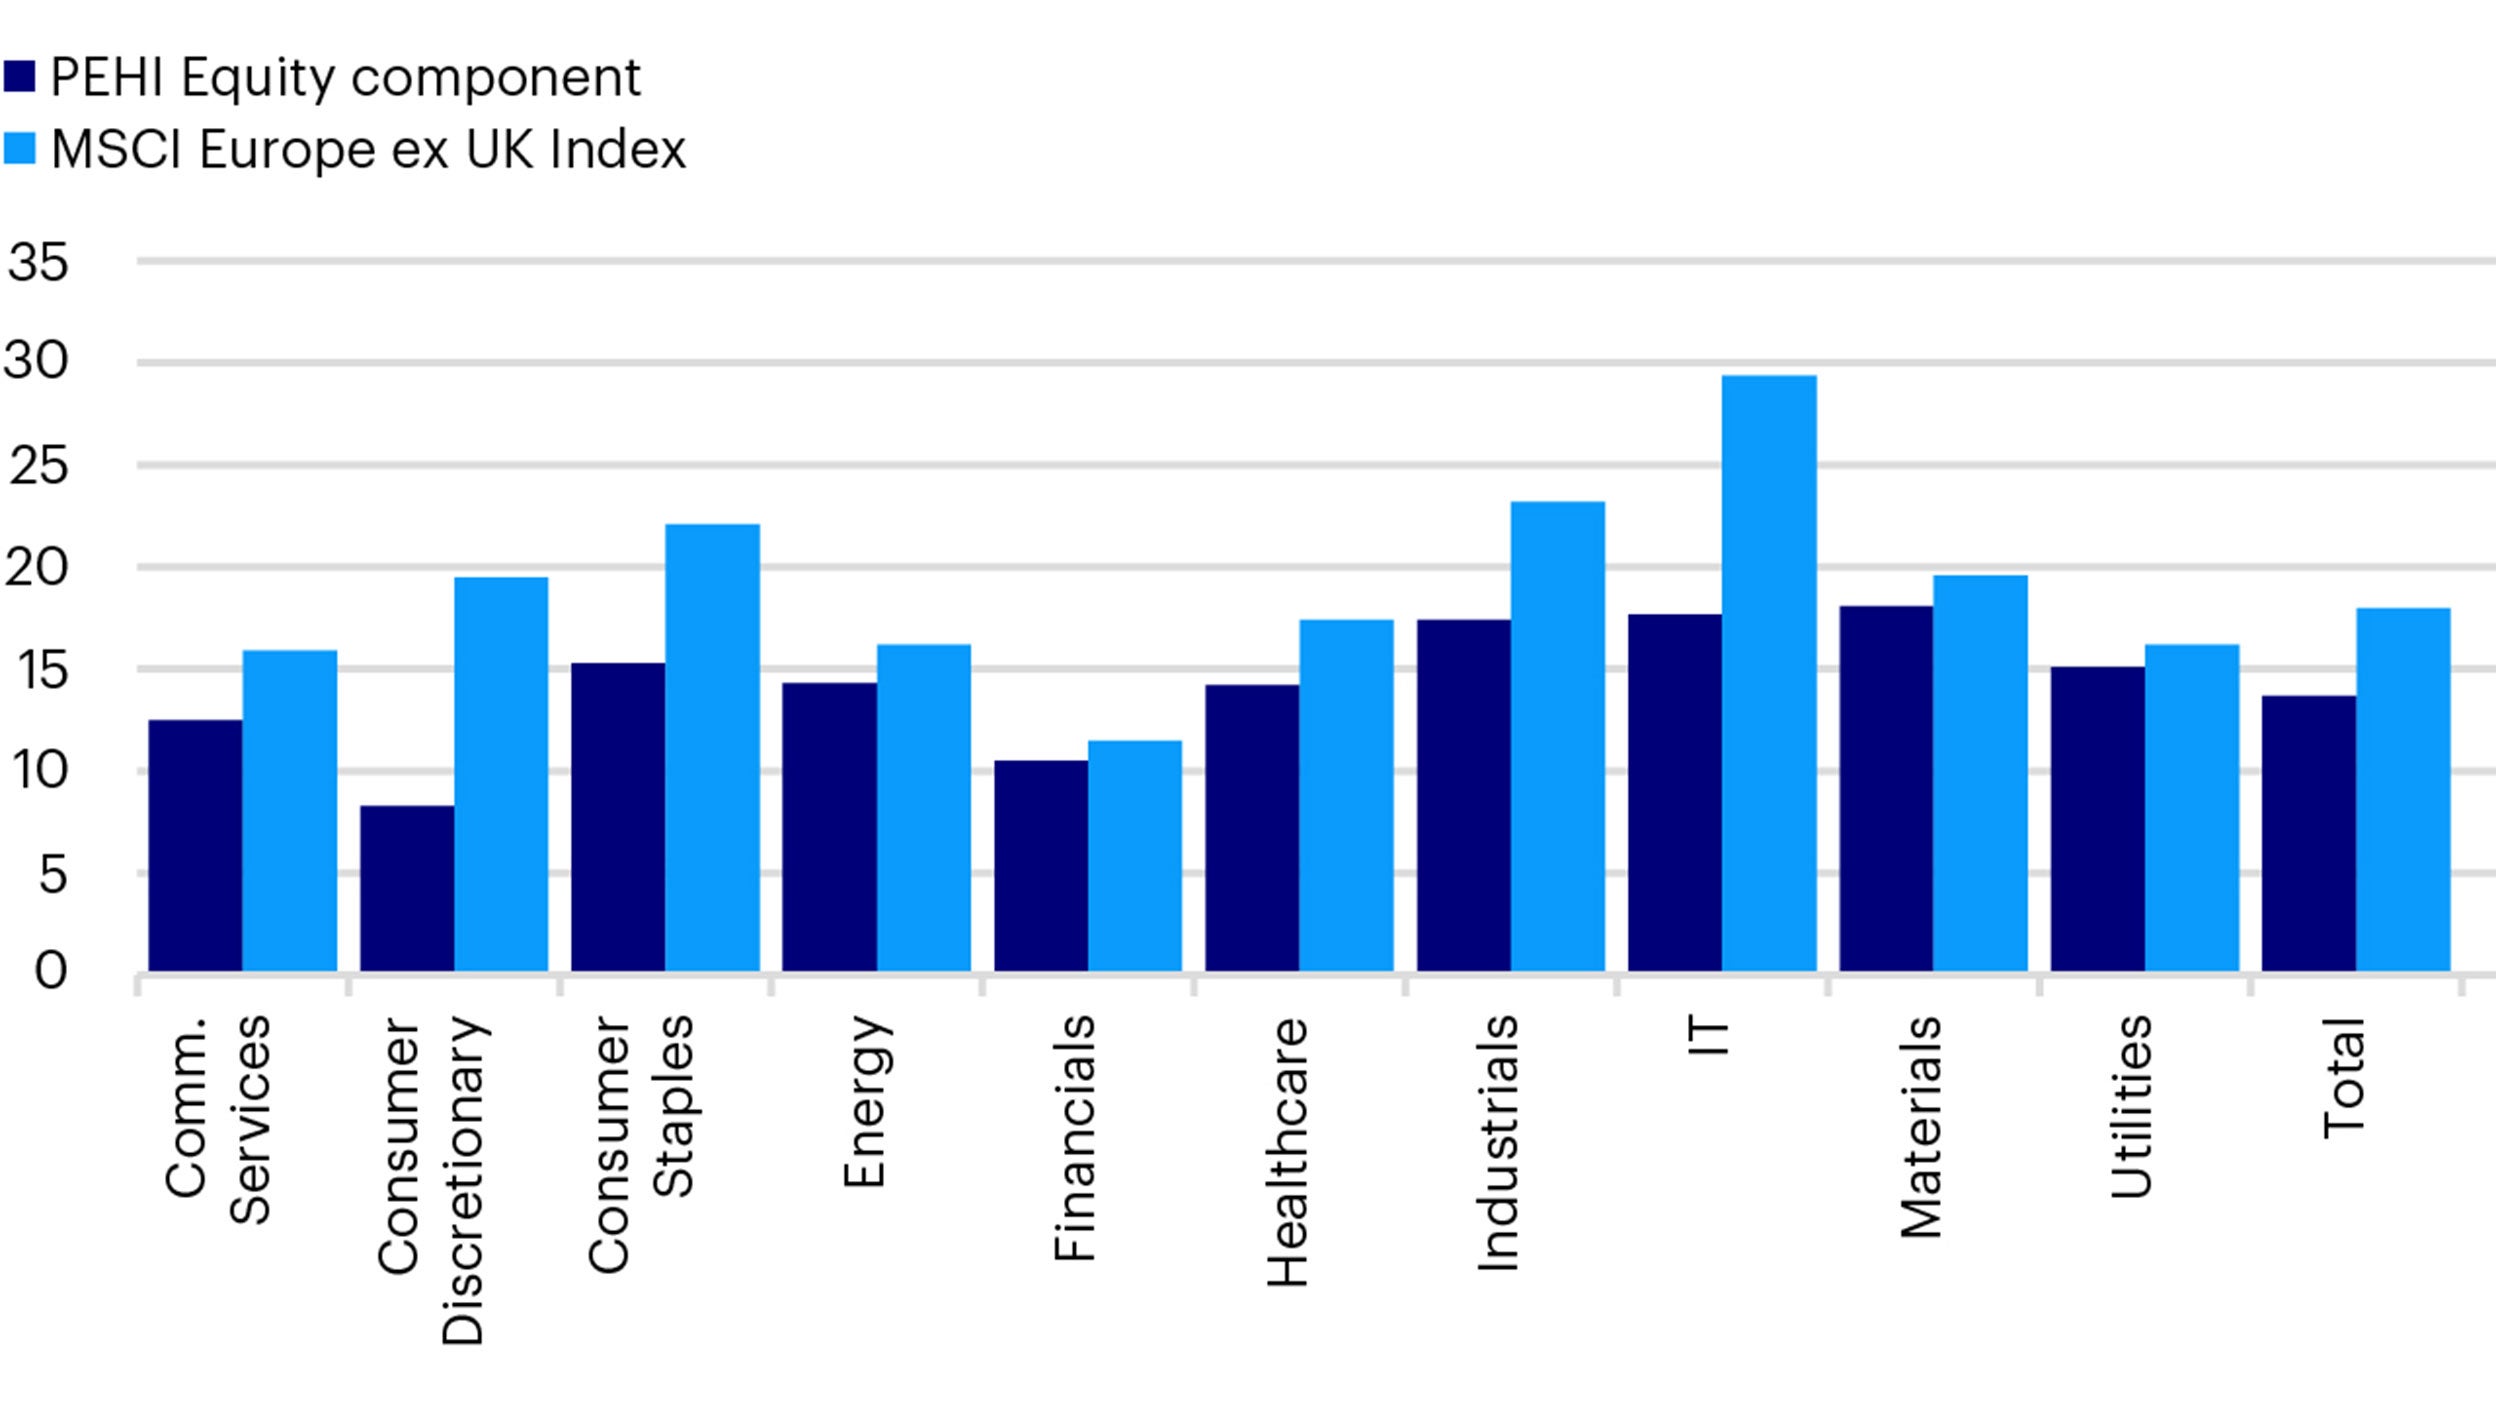
Whilst the focus in equities is on income, the investment process places importance on valuation and as a result, the price to earnings multiples are consistently lower than the index.
This focus on higher dividend yielding shares and more attractive valuations indicates the equity component’s style bias and as value stocks have started to outperform the broader market, so too have the fund’s shares.
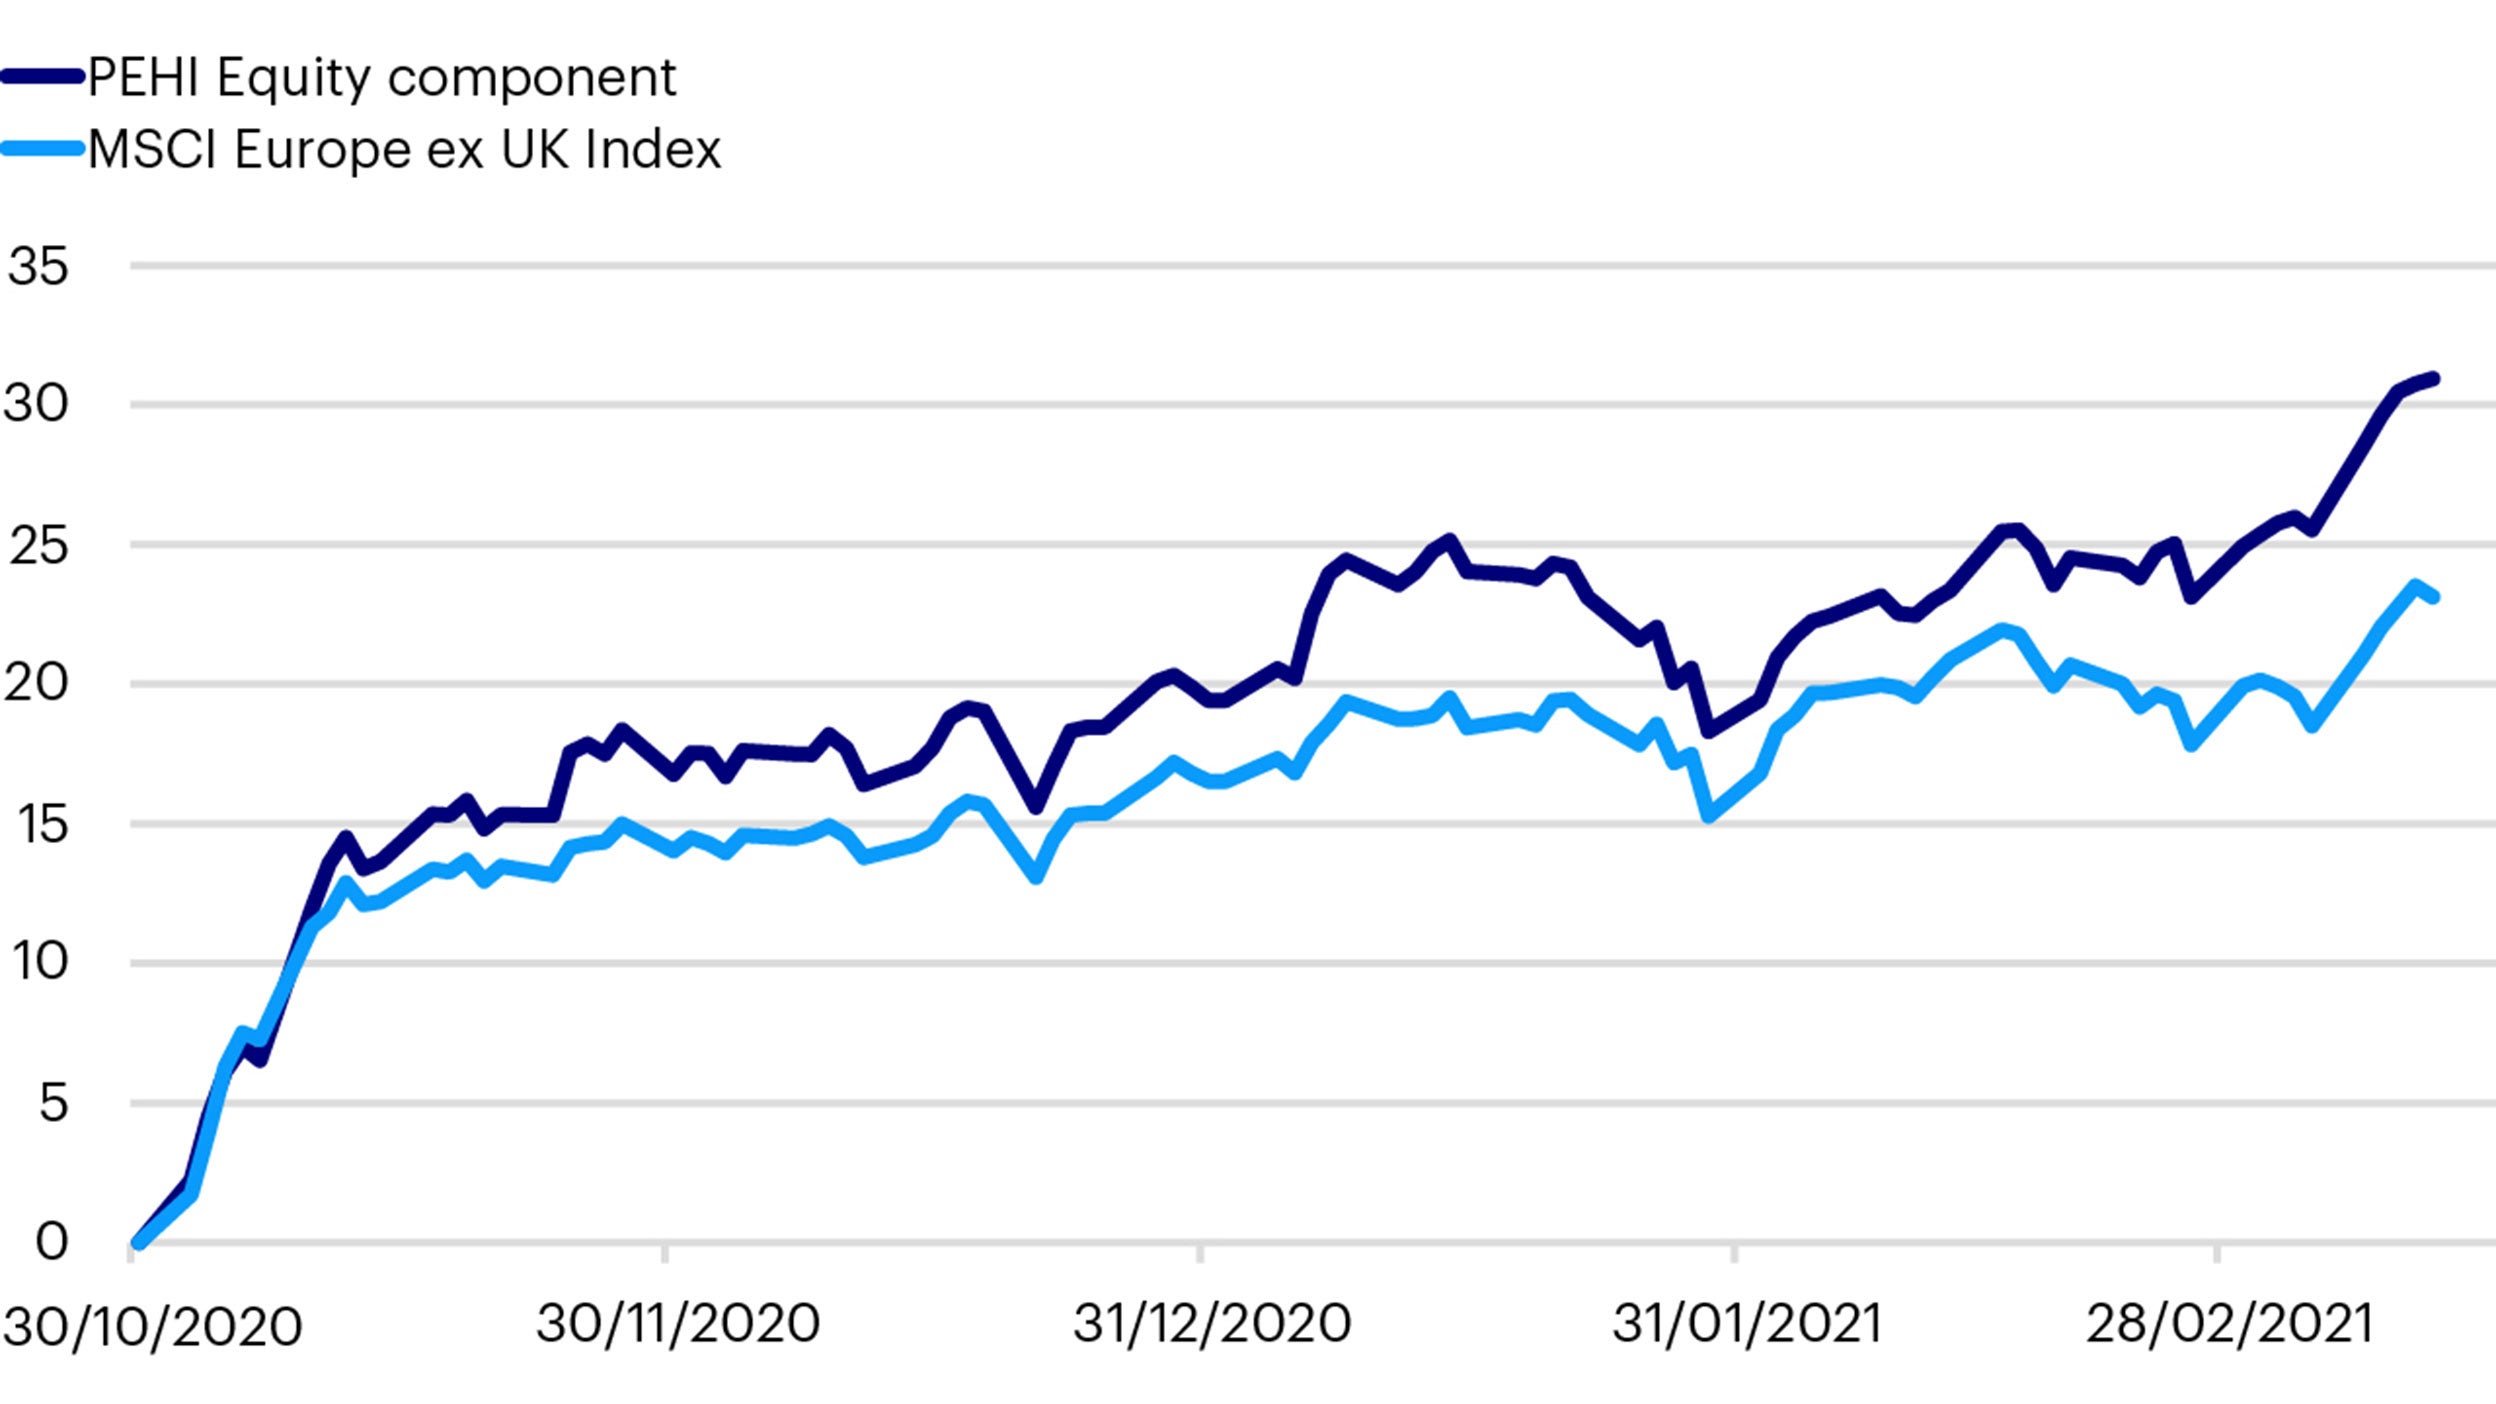
European equities have started to rise and we see real potential for this trend to continue. The cyclical economic upswing is likely to persist as economies are reopened, strong fiscal support is maintained, interest rates are kept low and money supply surges. Nonetheless, valuations in European, and particularly value-oriented shares remain attractive having been suppressed for some time.
Against a backdrop of low bond yields, equities in the Pan European High Income Fund boost income. The fund’s equities are also providing strong capital growth at a time when duration sensitive fixed income markets are posting losses.
We believe that the Pan European High Income Fund is an important component in clients’ portfolios. Its diversification means it can produce income and return in different market conditions. This year, although the overall outlook for fixed income markets is modest, we are optimistic about the fund given its lower sensitivity to duration and its exposure to attractively valued European shares.
The value of investments and any income will fluctuate (this may partly be the result of exchange-rate fluctuations) and investors may not get back the full amount invested. Debt instruments are exposed to credit risk which is the ability of the borrower to repay the interest and capital on the redemption date. The fund uses derivatives (complex instruments) for investment purposes, which may result in the fund being significantly leveraged and may result in large fluctuations in the value of the fund. Changes in interest rates will result in fluctuations in the value of the fund. Investments in debt instruments which are of lower credit quality may result in large fluctuations in the value of the Fund. The fund may invest in distressed securities which carry a significant risk of capital loss. The fund may invest in contingent convertible bonds which may result in significant risk of capital loss based on certain trigger events. The fund may invest in a dynamic way across assets/asset classes, which may result in periodic changes in the risk profile, underperformance and/or higher transaction costs.
Data as at 28.02.2021, unless otherwise stated. This marketing communication is not intended as a recommendation to invest in any particular asset class, security or strategy. Regulatory requirements that require impartiality of investment/investment strategy recommendations are therefore not applicable nor are any prohibitions to trade before publication. The information provided is for illustrative purposes only, it should not be relied upon as recommendations to buy or sell securities.
Where individuals or the business have expressed opinions, they are based on current market conditions, they may differ from those of other investment professionals and are subject to change without notice.
For more information on our funds and the relevant risks, please refer to the share class-specific Key Investor Information Documents (available in local language), the Annual or Interim Reports, the Prospectus, and constituent documents, available from www.invesco.eu. A summary of investor rights is available in English from www.invescomanagementcompany.lu. The management company may terminate marketing arrangements.
This marketing document is not an invitation to subscribe for shares in the fund and is by way of information only, it should not be considered financial advice. This does not constitute an offer or solicitation by anyone in any jurisdiction in which such an offer is not authorised or to any person to whom it is unlawful to make such an offer or solicitation.
Persons interested in acquiring the fund should inform themselves as to (i) the legal requirements in the countries of their nationality, residence, ordinary residence or domicile; (ii) any foreign exchange controls and (iii) any relevant tax consequences. As with all investments, there are associated risks. This document is by way of information only. Asset management services are provided by Invesco in accordance with appropriate local legislation and regulations.
The fund is available only in jurisdictions where its promotion and sale is permitted. Not all share classes of this fund may be available for public sale in all jurisdictions and not all share classes are the same nor do they necessarily suit every investor. Fee structure and minimum investment levels may vary dependent on share class chosen. Please check the most recent version of the fund prospectus in relation to the criteria for the individual share classes and contact your local Invesco office for full details of the fund registration status in your jurisdiction.
Please be advised that the information provided in this document is referring to Invesco Pan European High Income Fund Class A (quarterly distribution - EUR) exclusively. This fund is domiciled in Luxembourg.