What happened next?
Goodyear continued to generate very little Free Cash Flow: despite generating a total net income of $277m in the 3 years to 2023, their free cash flow was -$477m! As a result, they did not pay any dividends, buyback any shares or make any acquisitions.
Over that same period, Broadcom continued to generate very large amounts of Free Cash Flow: they generated a total net income of $32bn, with free cash flow generation of $47bn! As a result, they were able to grow their Free Cash Flow by continuing investing in R&D and products, whilst paying out large dividends ($20.9bn), repurchasing shares ($11.5bn) and they made a $61bn acquisition that at the end of 2023 that will be reflected in the 2024 accounts.
What did this mean for investment returns?
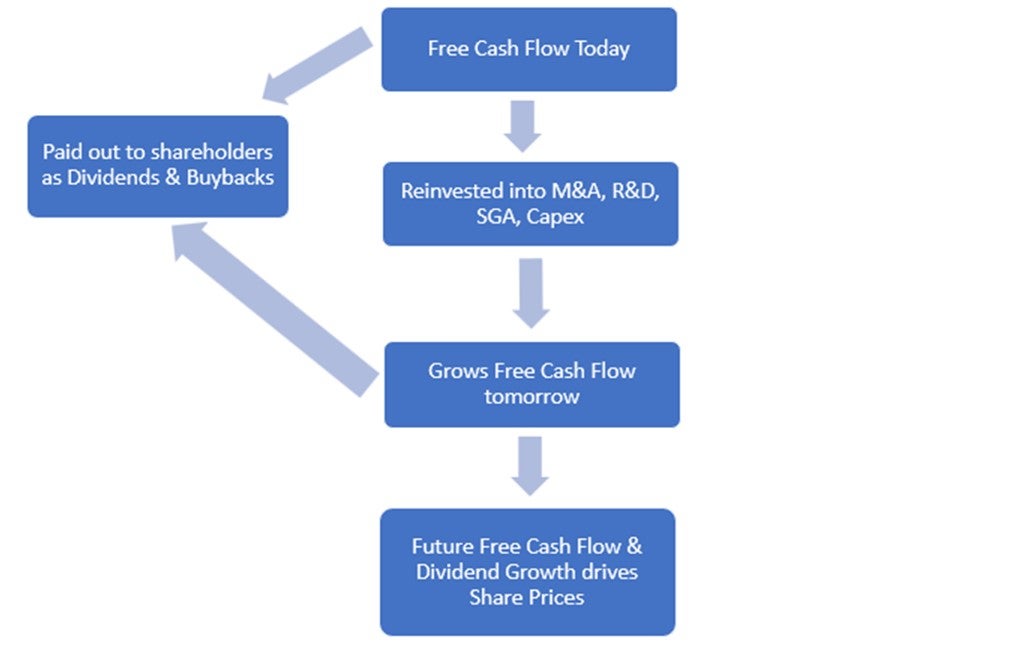
Ultimately, it is a company's cash investments in SG&A, R&D, M&A and capex that drive its future sales and Free Cash Flows. We as shareholders also benefit from increasing dividends and repurchases. These investments and shareholders returns can only be made out of cash, not profit. Therefore, it is our firm belief that Free Cash Flow per share growth plus dividends accumulated is what drives long term share prices.
In the very short term, share prices are almost random: Goodyear (GT) actually outperformed Broadcom (AVGO) dramatically in 2021. However, in the long run, the market rewards sustainable Free Cash Flow growth: at the time of writing, Broadcom has outperformed Goodyear by around 196% since the start of 2021.
If you extend your time frame out even further, you can see just how much the market cares about Free Cash Flow and dividends. In the end, this is all that matters.
Since Broadcom's IPO in 2009, the shares have compounded at 38% which is roughly in line with its FCF per share growth since IPO (32% CAGR) plus its dividend yield (2%). Over that same period, Goodyear shares have compounded at -2%…this makes sense because they have generated no Free Cash Flow per share growth.


