Investing Basics An investor’s guide to ETFs
Find answers to your ETF investing questions with expert advice from Invesco. Catch up with our helpful ETF investing for beginners guide.

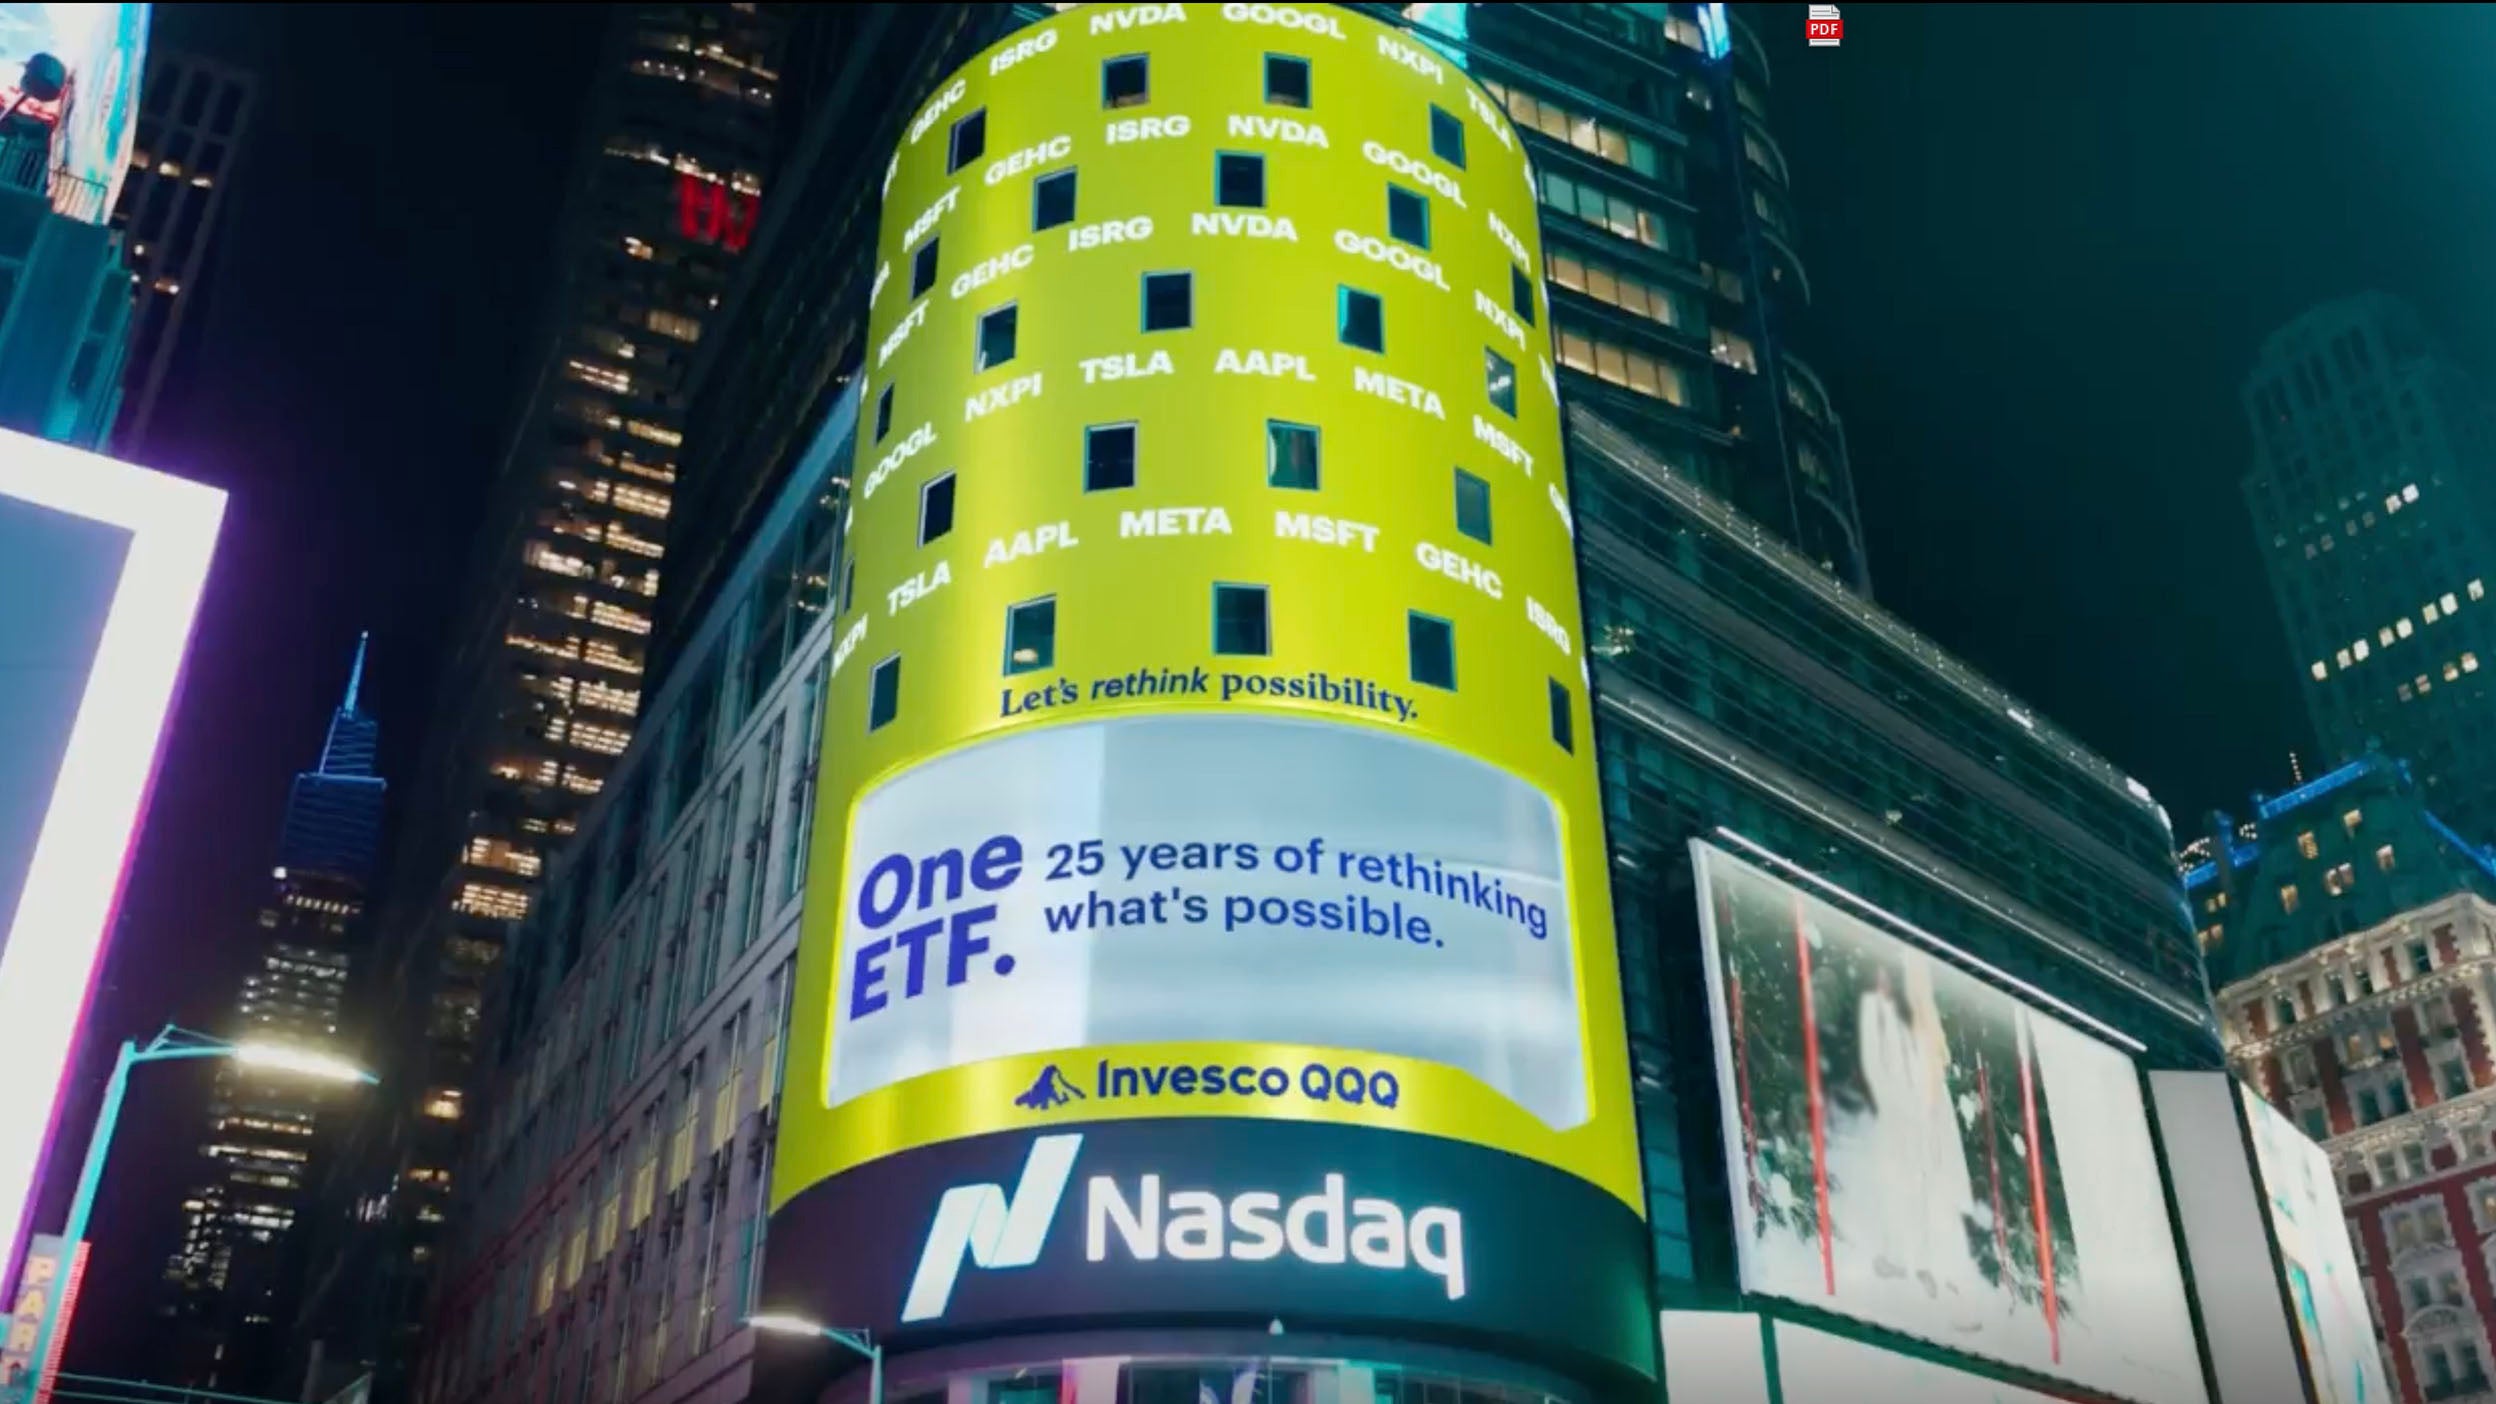
Invesco QQQ ETF recently hit another milestone in its storied career: crossing $300 billion in assets.1 This achievement underscores the ETF's continuing importance with investors and their trust in QQQ’s ability to provide efficient exposure to some of the world's most innovative companies.
The inception of the Invesco QQQ ETF dates back to March 1999, when it was launched with the aim of providing investors with an effective way to gain exposure to the Nasdaq-100® Index. This closely followed benchmark includes some of the largest non-financial companies listed on the Nasdaq, including leaders in technology, consumer services, and healthcare.
It’s a simple yet powerful idea. While past performance is no guarantee of future results, if you'd invested $10,000 in Invesco QQQ 10 years ago, your money would be worth $53,586 as of September 30, 2024.2
Standardized performance. Performance quoted is past performance and cannot guarantee of comparable future results; current performance may be higher or lower. Visit invesco.com/performance for the most recent month-end performance. Investment returns and principal value will vary; you may have a gain or loss when you sell shares. Fund performance reflects fee waivers, absent which, performance data quoted would have been lower. Invesco QQQ’s total expense ratio is 0.20%. Index performance does not represent fund performance. Please keep in mind that high, double-digit and/or triple-digit returns are highly unusual and cannot be sustained.
The Nasdaq-100 Index is a powerhouse of innovation, with tech-focused giants like Apple, Microsoft, Amazon, Tesla, and Alphabet among its top holdings. Much of QQQ's allure lies in its ability to offer exposure to innovative and high-growth companies, combined with the benefits of the ETF structure.
Although technology is its largest sector by portfolio weight, QQQ can provide diversification across other sectors such as consumer discretionary and healthcare. This diversification helps mitigate risks while seeking to capitalize on the growth potential of various industries.
As of October 18, 2024, QQQ is the fifth-largest ETF listed in the US based on AUM.3 Aside from the rise of the Nasdaq-100 itself, here are some other trends that have helped drive QQQ’s growth in assets over the years:
Marking its 25th anniversary in 2024, QQQ’s track record of outperformance—cumulative returns of 1025.24% since inception compared with 619.33% for the S&P 500® Index, as of September 30, 2024, further solidifies its position as a key player in the investment landscape.4
Looking ahead, reaching $300 billion in assets is a testament to investor confidence in QQQ's ability to provide efficient exposure to trailblazing companies changing the world today and tomorrow.
Invesco QQQ ETF AUM was 300.05B as of October 18, 2024. Source: Bloomberg L.P.
Bloomberg L.P. is as of September 30, 2024. Fund performance shown at NAV. An investor cannot invest directly in an index. Index returns do not represent Fund returns. Results will vary based on investment amount and time period selected. The Invesco QQQ ETF incepted on March 10, 1999.
ETF Database, October 15, 2024.
Bloomberg L.P. Cumulative outperformance as of September 30, 2024. Data begins on Invesco QQQ ETF inception date of March 10, 1999. Performance data quoted represents past performance, which is not a guarantee of future results.
Select the option that best describes you, or view the QQQ Product Details to take a deeper dive.

Find answers to your ETF investing questions with expert advice from Invesco. Catch up with our helpful ETF investing for beginners guide.

Learn how some exchange-traded funds have endured decades of volatility.

When it comes to anchoring your core portfolio, how do the Nasdaq-100 and S&P 500 Indexes compare?
NA3945197
All data is from Bloomberg, L.P. as of 9/30/2024, unless otherwise noted.
All returns are based off NAV. Returns are cumulative unless otherwise noted.
Invesco does not offer tax advice. Investors should consult their own tax professionals for information regarding their own tax situations.
These comments should not be construed as recommendations. Forward-looking statements are not guarantees of future results. They involve risks, uncertainties and assumptions; there can be no assurance that actual results will not differ materially from expectations.
The Index and Fund use the Industry Classification Benchmark (“ICB”) classification system which is composed of 11 economic industries: basic materials, consumer discretionary, consumer staples, energy, financials, health care, industrials, real estate, technology, telecommunications and utilities.