ETF A proven, systematic approach to active investing
Find out what objectives a systematic active approach might aim to achieve and how an equity ETF using this strategy fits in between pure passive and traditional active management.

Numerous studies indicate significant inefficiencies exist in China’s A-share market, presenting opportunities for active portfolio managers to potentially deliver strong performance. For investors or asset owners who outsource their China exposure, fundamental active managers are often the first choice due to their in-depth company insights and industry knowledge. However, model-driven quantitative active managers have been gaining attention in recent years for their relatively more stable performance amidst heightened market volatility. Historically, their low correlation to fundamental active managers also imparted substantial diversification benefit to an asset owner’s China exposure.
This paper quantifies the historical performance differences between the fundamental and quant active managers in China, by examining the median monthly returns of their mutual funds from 2010 to 2022. We find that the median quant manager has outperformed the median fundamental manager in terms of absolute return and on a risk-adjusted basis. The median quant manager also outperforms the benchmark at a higher monthly frequency. Cross-sectionally, the proportion of quant managers with positive alphas is also higher compared to fundamental managers.
To tackle the question of what optimal allocation to quant strategies would be beneficial to an investor‘s China portfolio, we devise a framework to determine the optimal return and risk utility derived from various allocation levels considering an investor’s manager selection capability.
For an investor with a neutral manager return forecasting ability, we find a higher allocation to quant manager to better satisfy overall return and risk objectives. On the other hand, if the investor has a consistently strong forecasting and manager selection ability, we show that the optimal allocation decision will require a trade-off between return and risk objectives, which can be better fulfilled by the fundamental manager and quant manager respectively. However, the trade-off function deviates significantly each year, implying that higher risk portfolios are not consistently well compensated. Hence, we believe that long-term investors, even with strong manager selection ability, should not ignore the diversification benefits of quant strategies in smoothing their portfolio returns and enhancing portfolio information ratio.
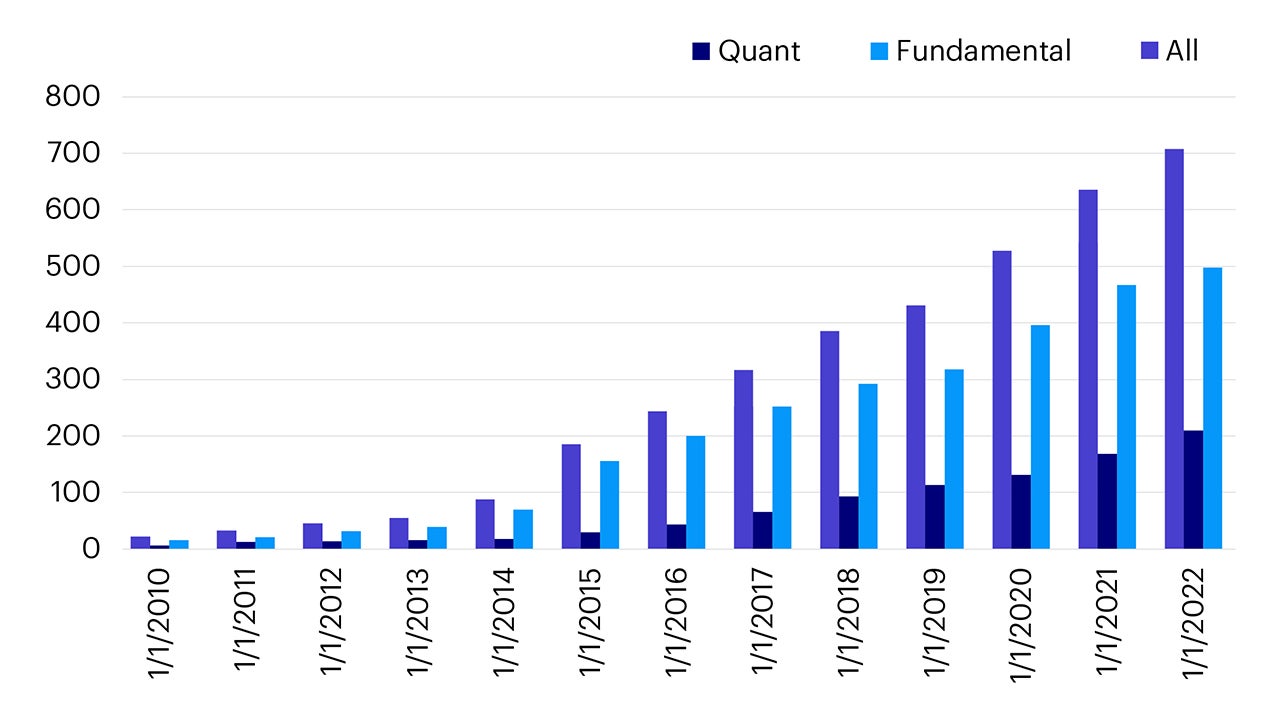
China’s onshore A-share active mutual fund industry has grown significantly since 2009 and rose rapidly from 2016 onward in almost a linear fashion (Figure 1). Using publicly available information we look at both fundamental mutual funds that engage in bottom-up stock picking as well as quant mutual funds1 that follow a model-driven process.
Quant funds have historically achieved success in China by employing efficient risk-taking processes which eliminate portfolio manager bias, and by employing diversified alpha sources. The strong demand for systematic investment strategies have led to a doubling of long only quant funds from 2019 to 2022. As of 31 December 2021, quant funds accounted for approximately 18% of all China’s active mutual fund assets.1

Sources: WIND; Invesco analysis
To assess the long-term performance of fundamental and quantitative managers in China, we analyze their mutual fund returns from 2010 to 2022. We first calculate every fund’s historical monthly active return against its own official benchmark to ensure the results are benchmark agnostic. We then construct the time series returns for a “median fundamental manager” and a “median quant manager” by sampling the median monthly active returns of their respective mutual fund groups. This allows us to fully quantify the return and risk characteristics of these two investment manager styles for an objective comparison while accounting for the growing fund sample size over the study period.
Over the full period, the cumulative median active return of all managers is 3.33% p.a. net of fees (Table 1). The cumulative active return of the median quant manager (3.86% p.a.) is, however, higher than that of the median fundamental manager (3.13%). In fact, the median quant manager has a positive active return in every year of our sample. The median fundamental manager has more volatile returns with large positive returns in 2019 and 2020 being offset by underperformance in 2012, 2014, 2016, 2018 and 2022 (Figure 3)

Sources: WIND, Invesco analysis. Past performance is no guarantee of future results.

Sources: WIND; Invesco analysis. Past performance is no guarantee of future results.

Sources: WIND; Invesco analysis. Past performance is no guarantee of future results.

Find out what objectives a systematic active approach might aim to achieve and how an equity ETF using this strategy fits in between pure passive and traditional active management.

Stephen Anness, Head of Global Equities, shares some lessons learnt from the previous drawdowns we’ve experienced in order to help investors navigate the ongoing market volatility.

The 2025 equities outlook is improving. Balance sheets look healthy, and many stocks are attractively valued, though geopolitical risks remain. Find out more.