Article

Insurance 2024 outlook

Insurance investment outlook
Key takeaways
1

Easing monetary policy and financial conditions are expected to support global economic growth close to potential. Though a recession scenario is not expected, it remains a 15% risk case.

2

A benign growth and inflation outlook implies that further restrictive monetary policy is not necessary, and central banks should seek to get rates closer to neutral. We expect central banks to deliver a series of rate cuts over the next year across the major global economies. 

3

We are underweight equities relative to fixed income, favouring US equities and defensive sectors, and overweight duration in investment-grade credit and sovereign fixed income in our strategies. We also may see opportunities in Private credit and commercial real estate debt.

Regulatory Outlook 2024
Solvency II reform to continue throughout 2024

Following a year in which disagreements surfaced between Government ministers and the Prudential Regulation Authority over the extent of reforms to UK Solvency II, 2024 should be the year in which the final technical details of the reform package are ironed out and brought into force.

A three-phase approach to completion

The UK authorities plan to finalise the reform package in three tranches:

Tranche one: HM Treasury will legislate to reduce the Risk Margin.  Draft regulations published1 in June 2023 proposed to cut the risk margin for long-term life insurance by approximately 65%, and for non-life insurance by approximately 30%.  The final legislation is expected by the beginning of 2024.

Tranche two: the PRA will publish final rules on the Matching Adjustment (MA).  In September 2023, the PRA published a consultation paper setting out draft plans to “enable broader and quicker investment by insurers in their MA portfolios”2, as well as an attestation process for the amount of MA benefit being claimed. The PRA expects to publish final policy and rules on the MA during Q2 2024, with the changes coming into force on 30 June 2024.

Tranche three: all other Solvency II reforms on which the PRA has consulted will take effect on 31 December 2024.  These include the draft proposals consulted on in June 2023, which the PRA predicts “will allow a meaningful reduction to the existing administrative and reporting requirements for the UK insurance sector”3.

Political pressure to deliver the benefits of reform

Once the reforms are in force, pressure is likely to build on the insurance industry to demonstrate that the benefits – which the City Minister has predicted could be up to £100bn of capital freed-up for investment – are delivered.4 MPs have already questioned the PRA on whether its remit extends to monitoring whether capital released under the reforms is invested in the UK economy rather than transferred to shareholders via higher dividends.5  Given the constrained state of the public finances, the next government (of whichever colour) is likely to look to the private sector – and to the insurance sector in particular – as a source of significant new investment capital.

UK Solvency II (to become Solvency UK)

  • End 2023: HM Treasury legislates to reduce the Risk Margin
  • Q2 2024: PRA publishes final policy and rules on revised Matching Adjustment
  • 30 June 2024: entry into force of revised Matching Adjustment
  • 30 December 2024: entry into force of remainder of UK Solvency II reforms

Macro: flatlining economy, falling inflation

The UK registered zero growth in Q3, and few expect much, if any, for 2024 overall. Inflation remains uncomfortably high and has been slower to recede than in the US and Eurozone. Although the inflation outlook remains uncertain, recent data have shown a moderating trend and the labour market is showing signs of loosening, which should feed into slower wage growth going forward. 

Figure 1. Contributions to UK CPI (%)

Source: Bloomberg, October 2023

Rates: levelling off

The BoE decision to pause at its September meeting suggests that the bar for near-term rate hikes is relatively high. We think short-term rates should remain capped in the context of relatively weak macro fundamentals and tighter financial conditions. Market pricing suggests that the Bank Rate will stay around its current level throughout most of 2024. However, heavy supply and the lack of liability-driven investment demand continues to put upward pressure on longer-dated yields.

Credit fundamentals: holding up

The cycle is relatively advanced in the UK and Europe with credit events picking up among weaker rating categories. We expect these to continue rising in 2024 given more challenging refinancing conditions. We have seen an uptick in disappointments during the Q3 2023 earnings season, but we still view these as idiosyncratic rather than systemic.

Overall fundamentals are still reasonable, however. Leverage in sterling investment grade is low by historical standards and earnings margins are still elevated. Interest coverage has come down with rising yields and we are expecting it to continue deteriorating gradually, but this is not an immediate concern given well-spread maturity profiles. 

Source: Bloomberg Intelligence, Q2 2023

In the US, the credit cycle shows signs of maturing. Leverage has trended higher while margins, interest coverage, and revenue growth have fallen. We expect that corporates will prioritize debt paydowns to control borrowing expenses and defend balance sheets. Downgrade activity escalated in 2023, albeit from a low base, and upgrades still outweigh downgrades.

Valuations: moderate to good

We think spreads on investment grade look reasonable given the macro environment and corporate fundamentals. While the growth outlook is anaemic, Sterling issues are trading substantially outside of their long-term medians. Looking overseas, Euro corporates are also wide of their longer-term averages while US ones are slightly inside – likely due to the stronger growth dynamics in the US. 

Figure 3. Corporate bond spreads (%)

Source: Bloomberg, October 2023. An investment cannot be made in an index.

As always, the spread levels for an overall index conceal wide variations therein – and there are many relative value opportunities for investors who can pick and choose securities with a global viewpoint.

Insurance Asset Allocation

In the current risk-averse environment, insurers are naturally over-allocating to high quality bonds which exhibit much better spread than during the last decade and which could withstand a potential recession. The relative attractiveness of private debt is decreasing since highly rated credit assets are scarce on the private side, they need to be manufactured which induces a complexity cost.

Amongst the other factors of the asset allocation change of annuities writers, we can quote the increasing need of matching adjustment assets following the fall in the equity release production as a response to the increased interest rates resulting from the mini budget and the increasing activity on the BPA side.

  • In Q3 2023 Equity release Market remains suppressed at 2017 levels with new customers down (45%) and total lending down (58%) on an annual basis (Source: Equity Release council Q3 2023)
  • UK annuities writers are looking for a substitute to this asset class which is a fundamental building block of their matching adjustment portfolios. An attractive and deep source of long duration could be found in the US municipal bonds market.

On the other sides of the insurance business, private assets perfectly played their role of shock absorbers over the last few years but their relative importance in the balance sheet increased and neared the liquidity risk limits. Though the denominator effect slowed down the allocation to private assets over the last 18 months. 

We expect a repricing of the private assets at year-end and a stabilization of the liabilities’ cost which will leave more room for diversification in 2024. 

Figure 4. 10 years Capital Market Assumptions (CMAs) GBP

Source: Invesco. Data as of 30/09/2023. 

Public markets, Fixed income remains the story of the year. 

  • CMAs for most FI asset classes are significantly higher than historical returns. Some higher yielding credit assets are expected to outperform even the riskier parts of the equity market (Loans > EM) at much lower levels of risk. 
  • Global equities are still expected to return near 6%, however the relative expected outperformance continues to shrink, especially when adjusting for risk and cost of capital. If the current level of volatility subsists, equity risk hedging programs could be an efficient way to reduce the cost of capital and maintain the equity allocation over time.
  • On the capital management side, geopolitical events can impact volatilities of all assets, asset classes, sectors and countries. The introduction of a larger share of commodities or precious metals could reduce the volatility of the asset allocation and stabilise the eligible own funds considering our CMA are quite constructive for the asset class in the long run.

On the private markets side, we over allocate to debt over equity to cushion the volatility and refinancing risk and benefit from opportunities which are a good fit for insurers’ risk appetite & ALM: low LTVs and strong covenants.

The focus on diversification and the increasing appetite for inflation linked assets will probably attract new investors in the real estate debt space since higher interest rates and lower inflation have resulted in an attractive entry point thanks to repricing. Besides reduced bank lending creates a compelling opportunity for alternative real estate lenders.

Private Credit quality has also improved since 2022 via lender-friendly documentations and lower leverage profiles notably on the middle market side. Considering loans offer some of the best yields in fixed income despite their senior secured status, we believe their low correlation with traditional asset classes of the insurance balance sheet make them an attractive way to reinforce asset allocation in 2024. 

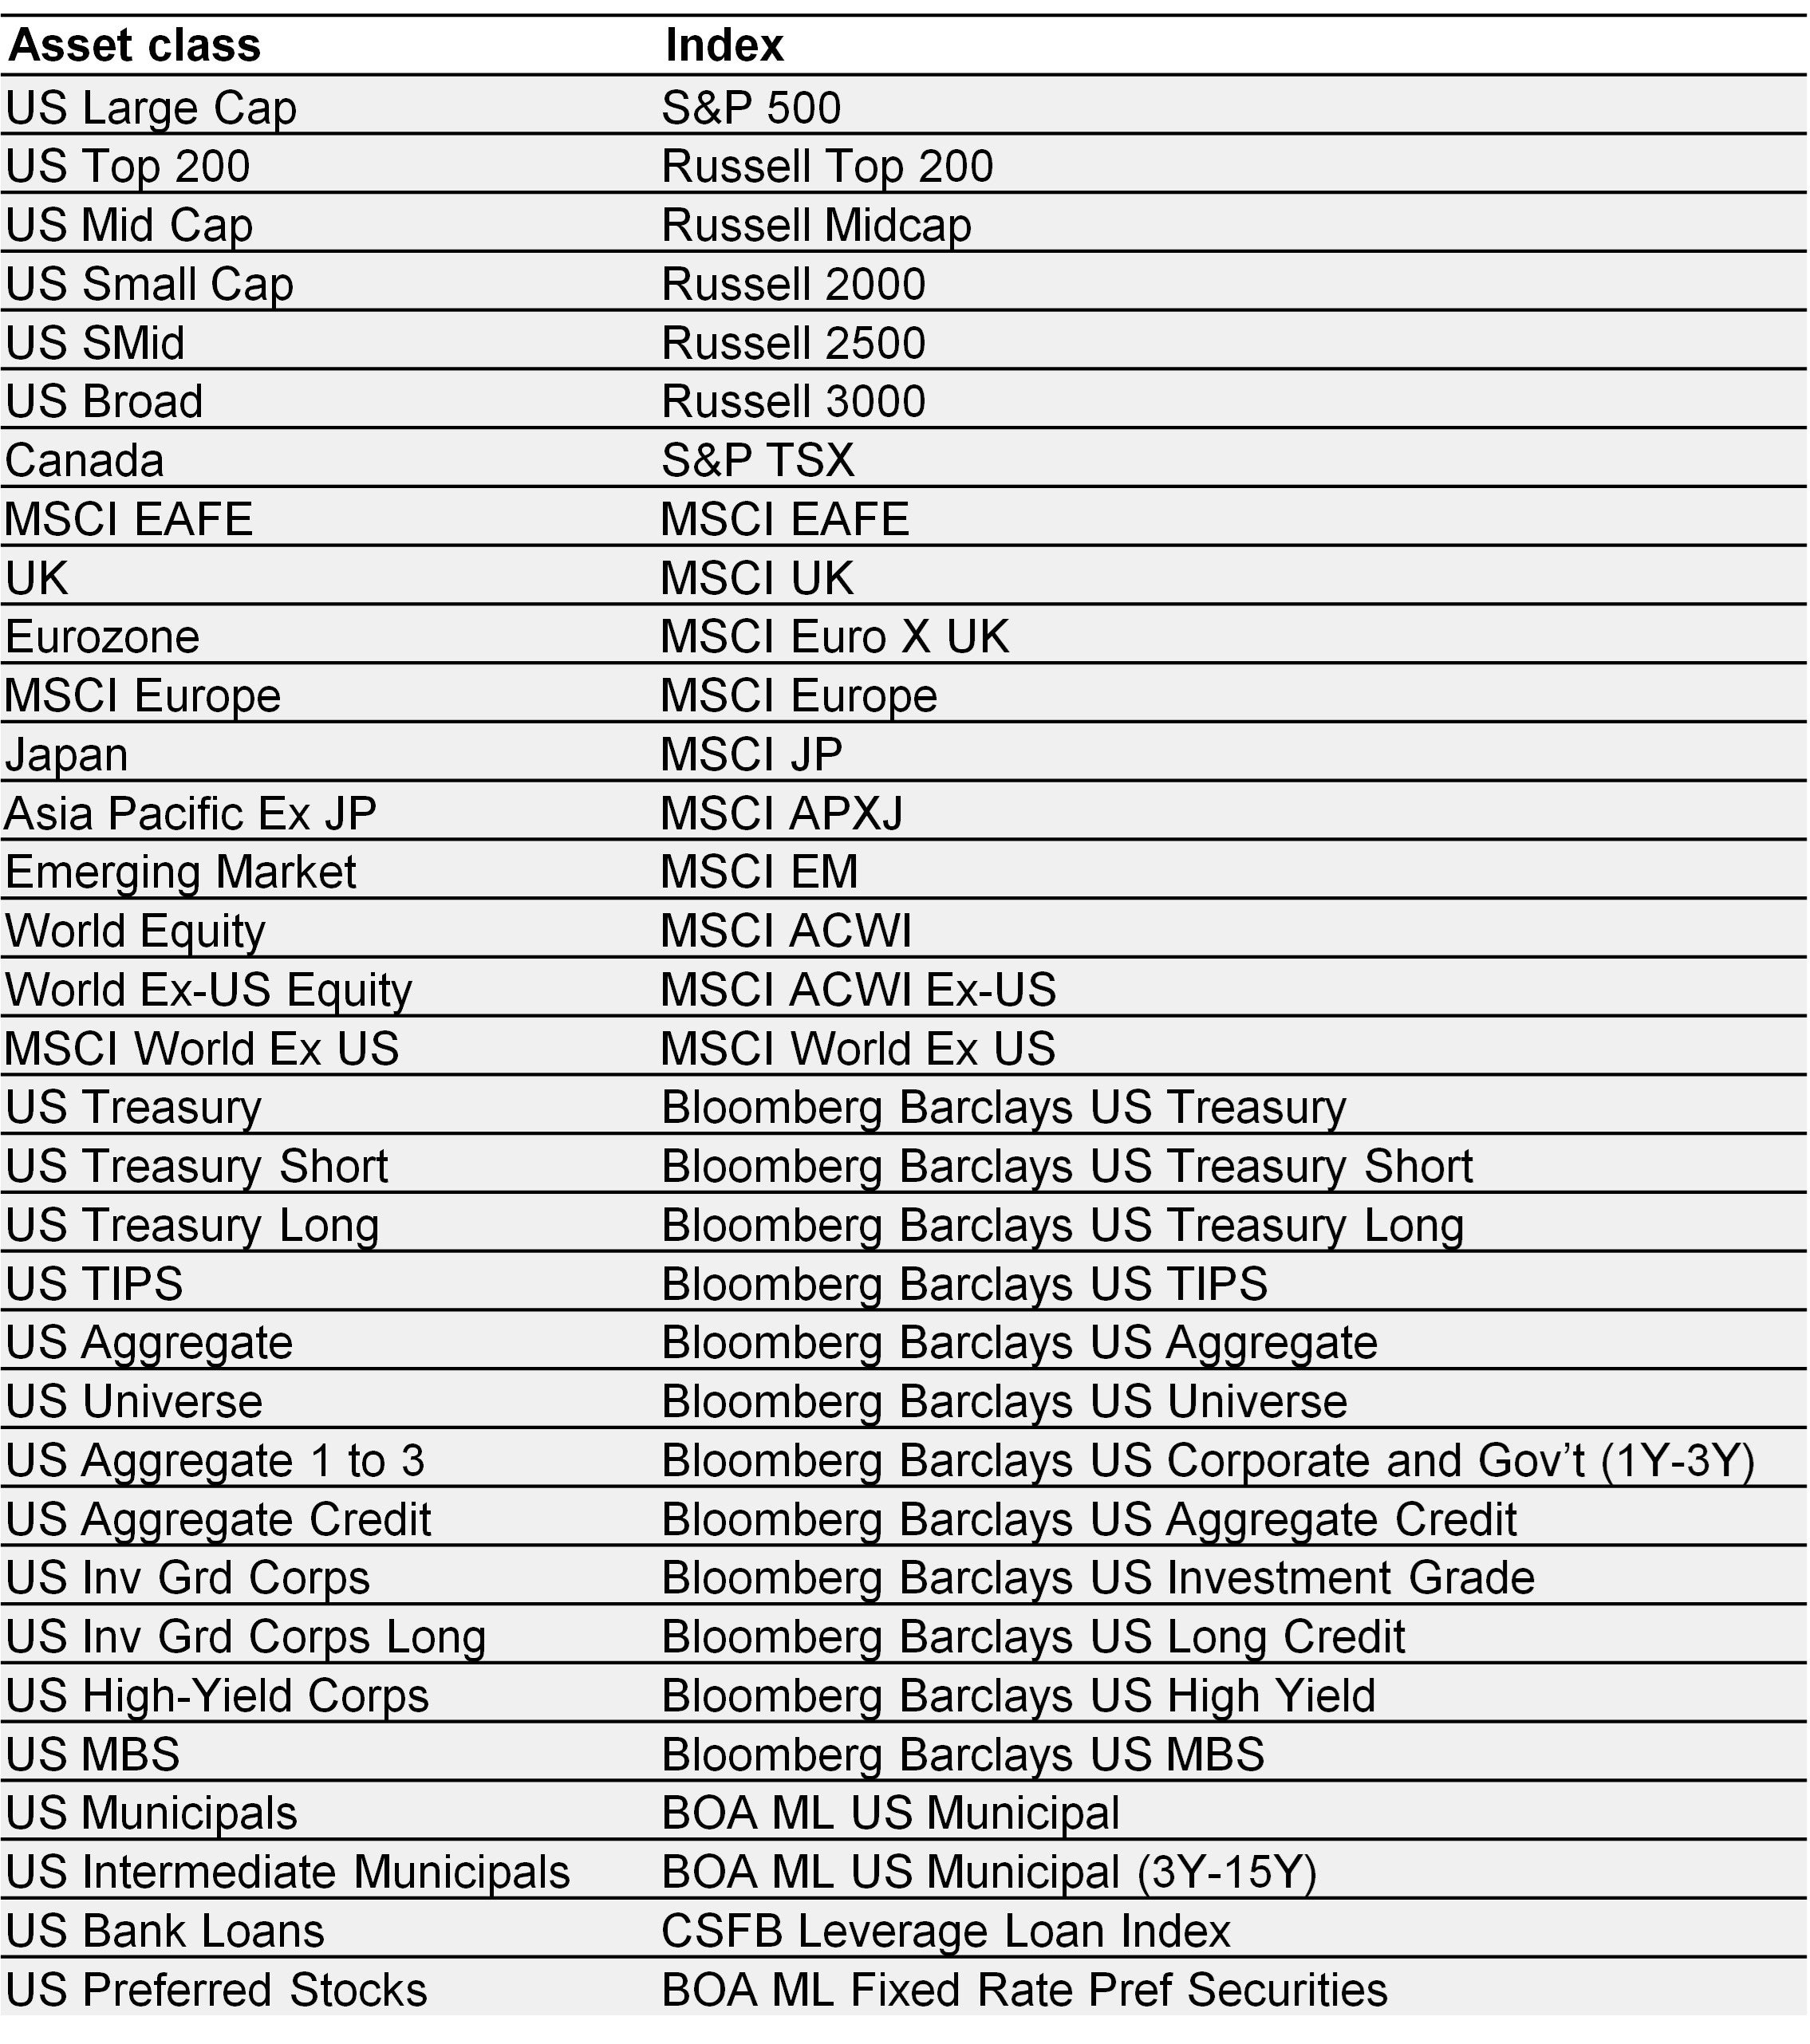
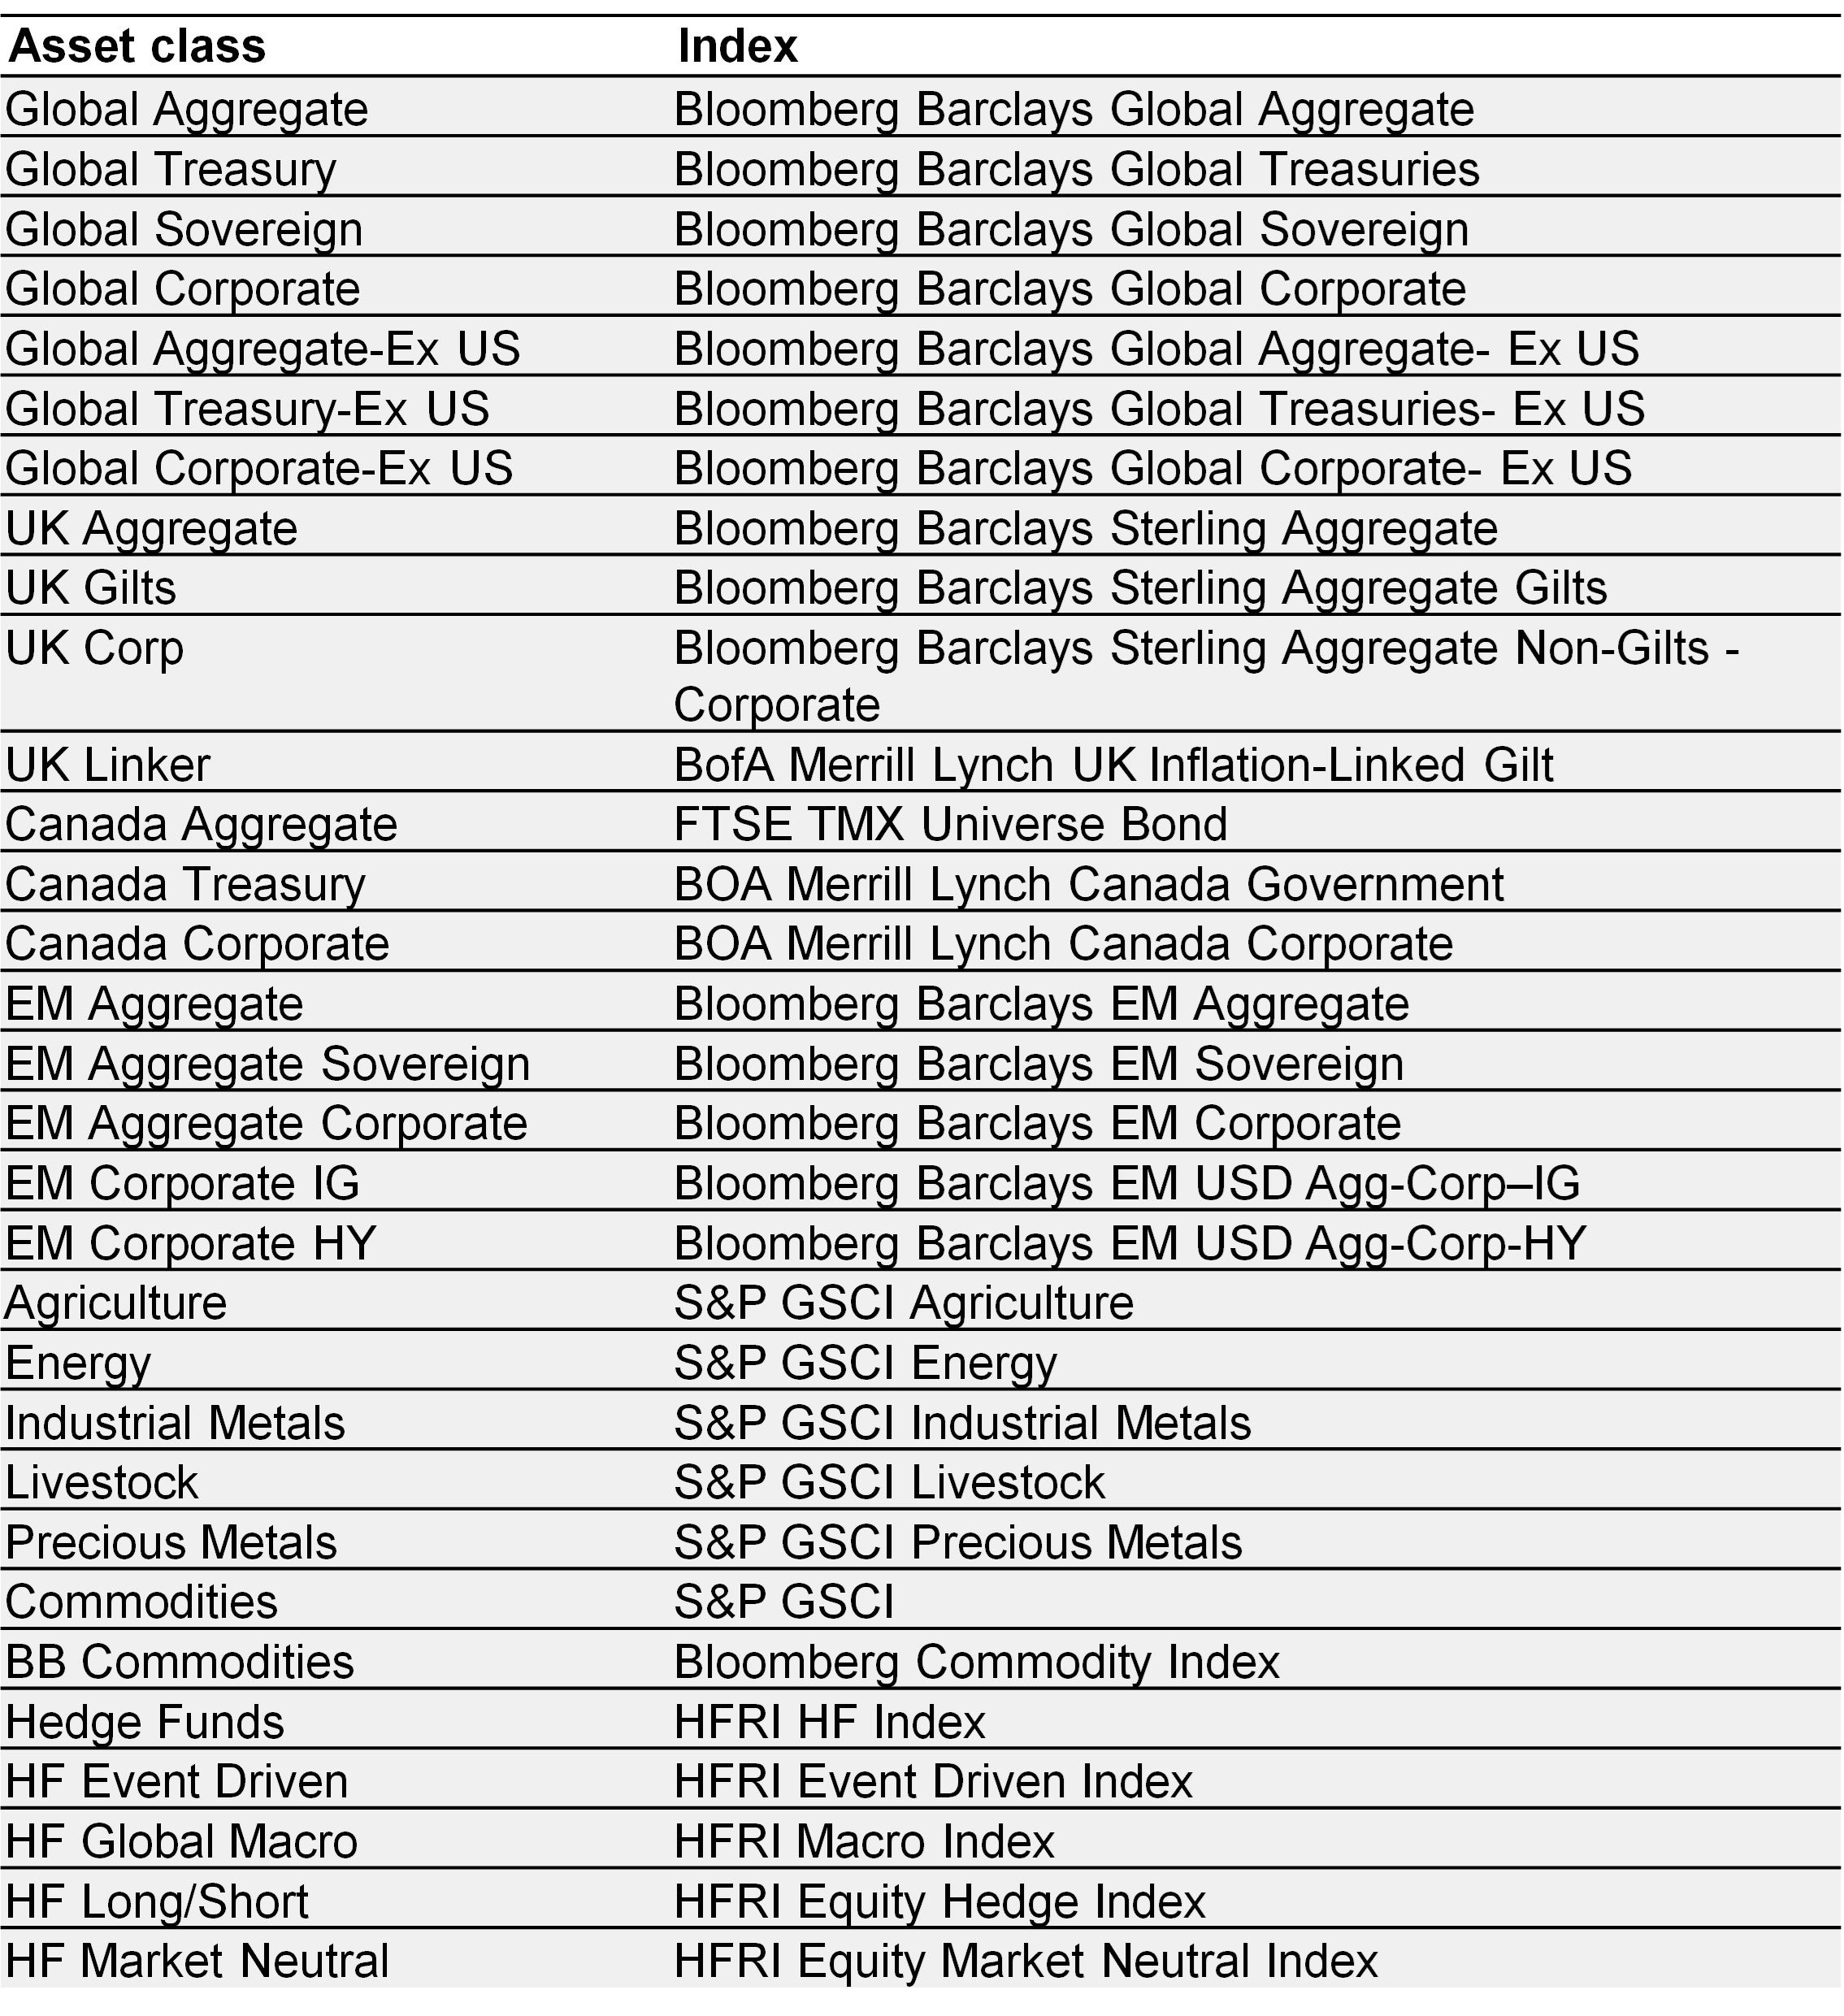
Capital Market Assumptions (CMAs)

  • Invesco Investment Solutions develops CMAs that provide long-term estimates for the behavior of major asset classes globally. The team is dedicated to designing outcome-oriented, multi-asset portfolios that meet the specific goals of investors. The assumptions, which are based on a 10-year investment time horizon, are intended to guide these strategic asset class allocations. We also utilize 5-year CMAs to give a half cycle view. For each selected asset class, we develop assumptions for estimated return, estimated standard deviation of return (volatility), and estimated correlation with other asset classes. For additional details regarding the methodology used to develop these estimates, please see our white paper Capital Market Assumptions: A building block methodology.

    This information is not intended as a recommendation to invest in a specific asset class or strategy, or as a promise of future performance. These asset class assumptions are passive, and do not consider the impact of active management. Given the complex risk-reward trade-offs involved, we encourage you to consider your judgment and quantitative approaches in setting strategic allocations to asset classes and strategies. This material is not intended to provide, and should not be relied on for tax advice.

    References to future returns are not promises or estimates of actual returns a client portfolio may achieve. Assumptions and estimates are provided for illustrative purposes only. They should not be relied upon as recommendations to buy or sell securities. Forecasts of financial market trends that are based on current market conditions constitute our judgment and are subject to change without notice. Estimated returns can be conditional on economic scenarios. In the event a particular scenario comes to pass, actual returns could be significantly higher or lower than these estimates.

    Indices are unmanaged and used for illustrative purposes only. They are not intended to be indicative of the performance of any strategy. It is not possible to invest directly in an index.

    The CMAs included are based on Invesco’s return expectations for the asset classes shown. The indices referenced are included as proxies for the asset classes and have been selected because they are well known and are easily recognisable by investors. The inclusion of these indices is not linked to the promotion of any investment products or services.

Proxy information
Proxy information
Proxy information

Investment risks

  • The value of investments and any income will fluctuate (this may partly be the result of exchange rate fluctuations) and investors may not get back the full amount invested.  

Important Information

  • Data as at 31 October 2023, unless otherwise stated.

    Views and opinions are based on current market conditions and are subject to change.

    This is marketing material and not financial advice. It is not intended as a recommendation to buy or sell any particular asset class, security or strategy. Regulatory requirements that require impartiality of investment/investment strategy recommendations are therefore not applicable nor are any prohibitions to trade before publication.