The long and short of it: Bidenomics vs. Reaganomics

“Bidenomics” aims to expand the scale and scope of government on two fronts: scale – a fiscal boost to propel growth here and now; and scope, to change the shape of the economy for decades to come – heavier regulation, taxes, incentives for a greener infrastructure, health, education, welfare.
This is a sea change from the Reagan-Thatcher supply-side revolution, which rolled back the state, paving the way for markets to reallocate resources within countries and across borders. Some version of Bidenomics seems likely to take root in the US and other countries within limits – pushing global growth up now, but pulling various sectors and regions in different directions over time.
Here, we’ll be focusing on the geo-economics of stimulus. However, we will release another blog in due course, which will focus on structural change.

A “Cup of Joe” wake-up call for global growth
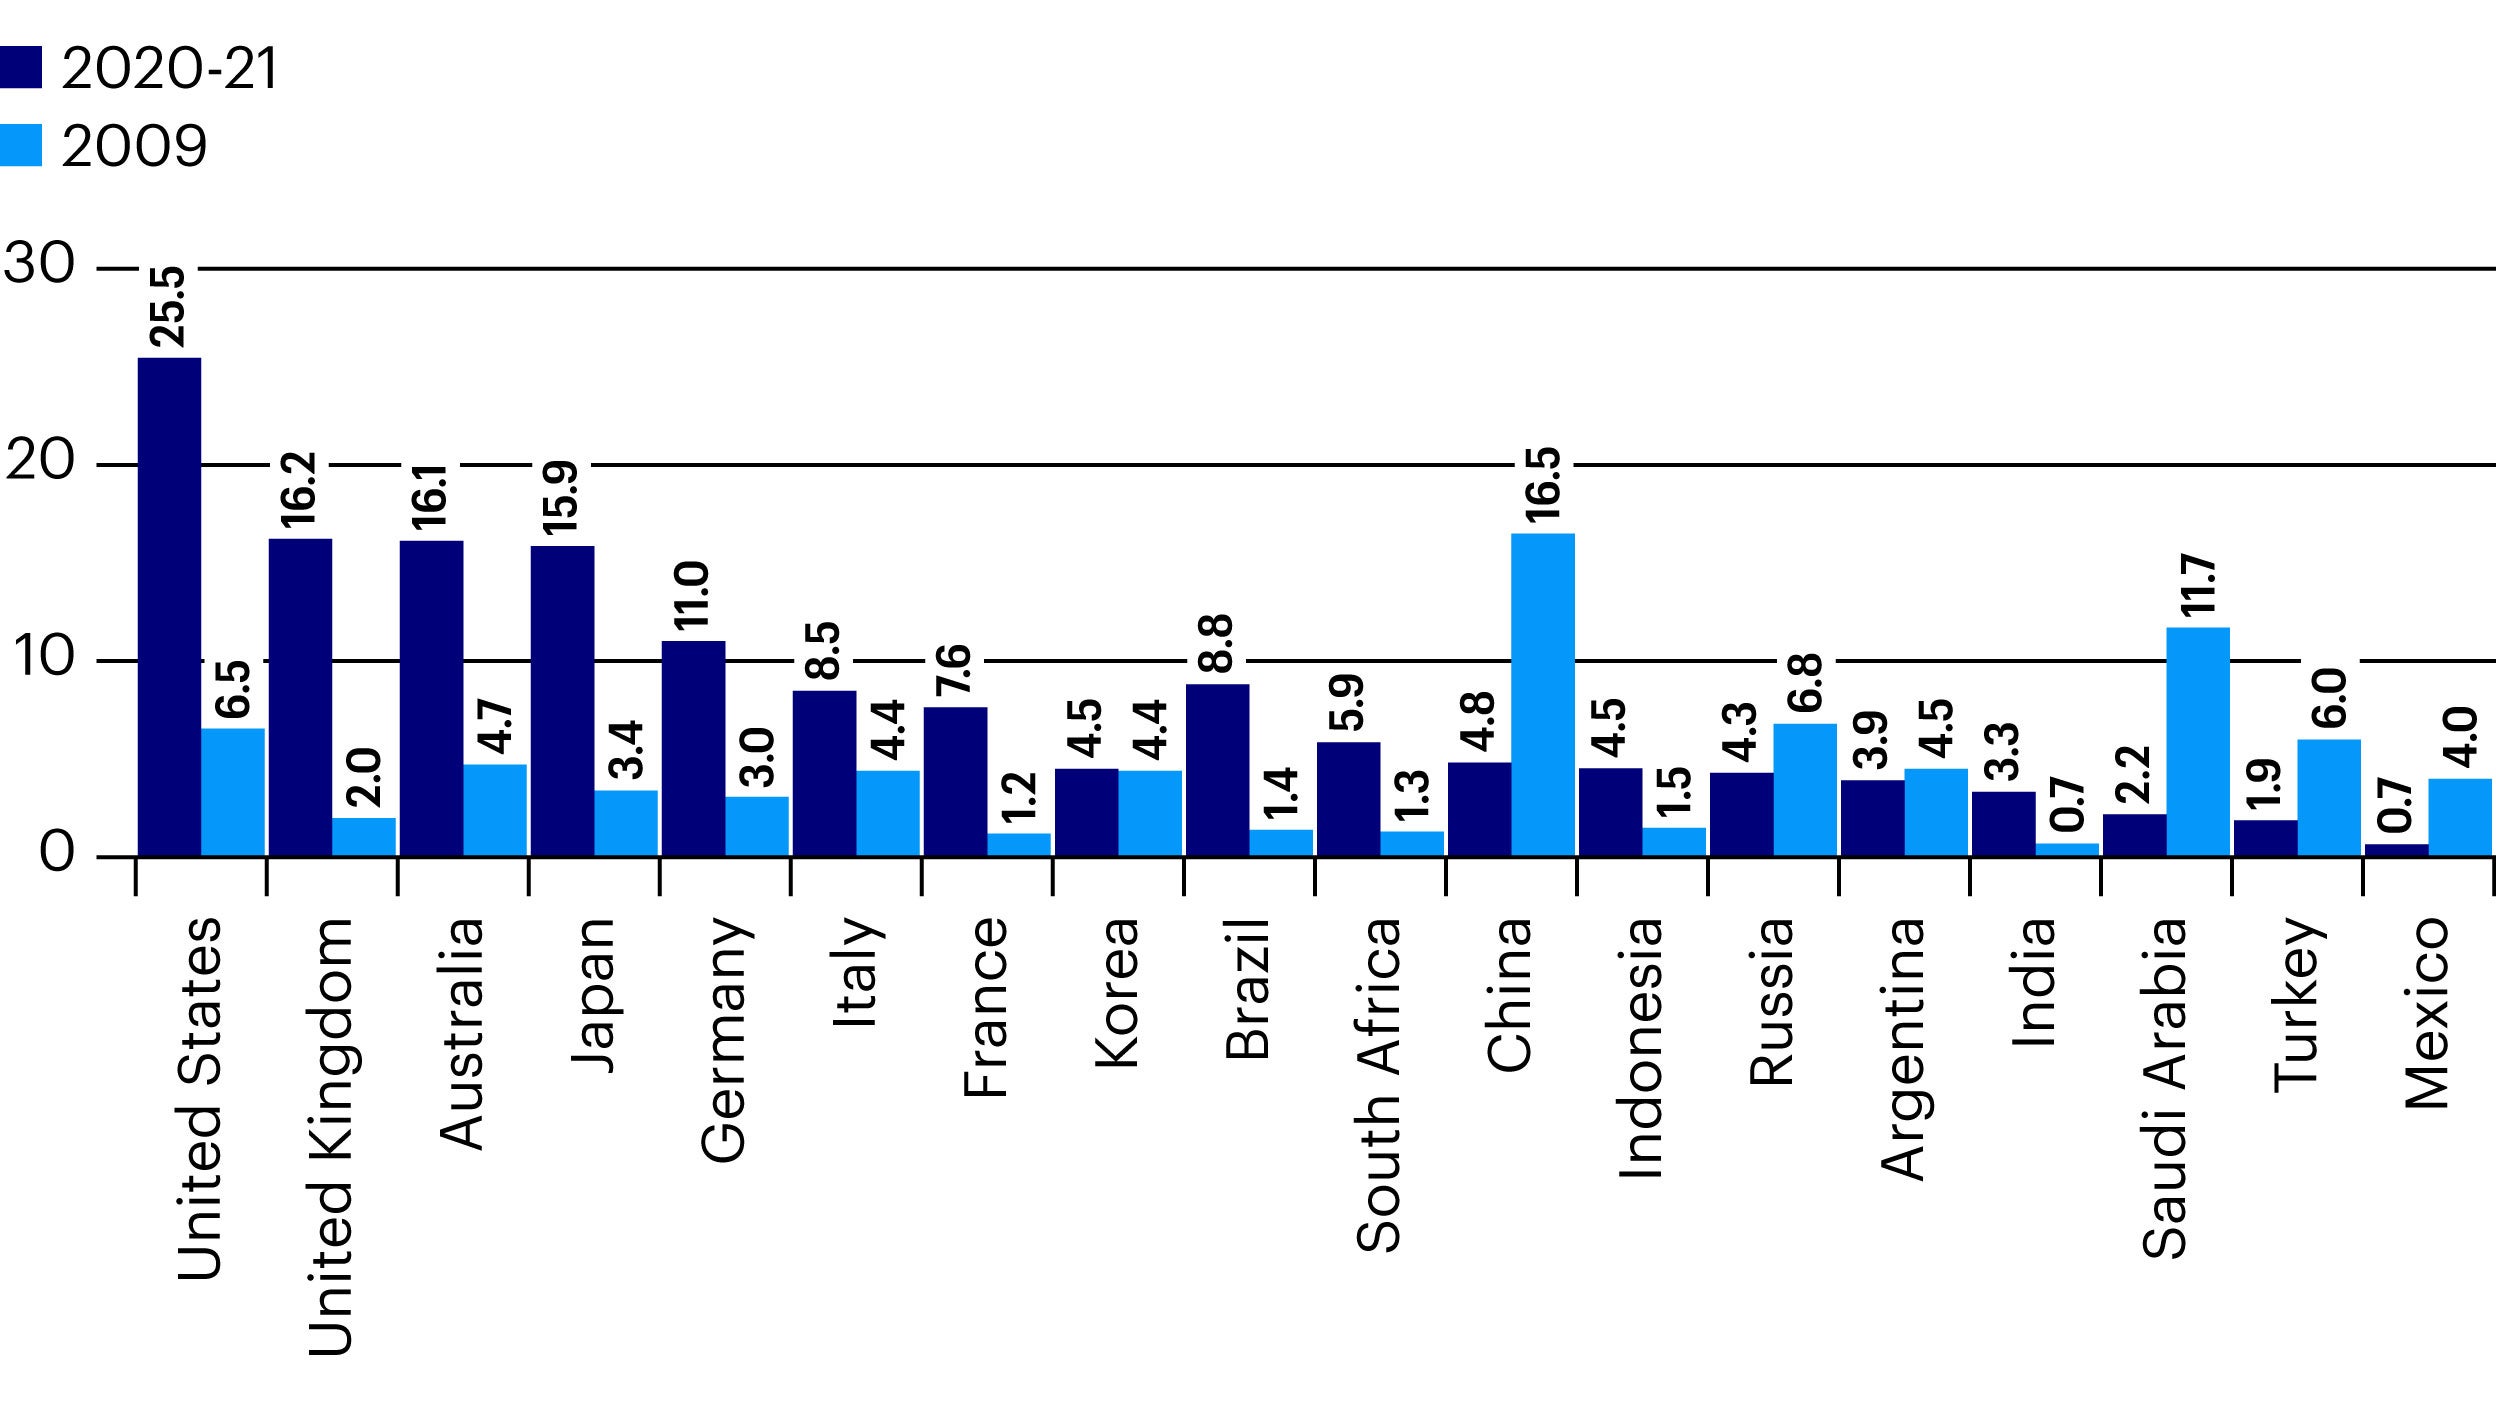
Five features of the global fiscal response today are striking compared to 2009 (Figure 1):
- Supersized – not just in the US, but also in the Eurozone (EZ), UK, Japan, Australia
- More sustained – two fiscal years so far (fiscal cuts began in 2010, shortly after the Global Financial Crisis (GFC) recovery)
- Much more heavily tilted to Developed Markets (DMs) than Emerging Markets (EMs)
- High-growth EM G20 members (crucially China, but also Turkey) are doing much less than in 2009
- EMs going bigger now (Brazil, India, South Africa) have far less global economic impact than China
The above features of the ongoing fiscal response to the pandemic suggest that demand, already jump-started by mass vaccination, will be turbo-charged by fiscal support and gain traction, given sustained stimulus. This is happening now in the “West” from where it should spread around the world – rather than China or Asia, which led earlier on in the pandemic, as well as in recent recoveries.
The last decade saw synchronized global growth after the GFC in 2009 and China’s 2015 devaluation. Both times, China’s fiscal/credit push drove investment, EM commodity exports, EZ capital goods and luxury exports and tourism. But this time, China is pushing far less than the US or Europe, pointing to a very different global recovery, reflecting domestic demand for local services, rather than global trade, investment or professional services (which held up relatively well, even growing in lockdowns).
The vast US fiscal stimulus suggests its rebound may be stronger than elsewhere, unlike the last decade, stimulating both domestic demand and global growth, since the US is the world’s largest importer with the world’s largest trade and current account deficits. However, the impact of US fiscal stimulus is likely to be different in its global effects than China’s 2009 and 2016 fiscal/credit push. Even as services rise fast in re-opening economies, international travel and tourism are likely to lag, given divergences in mass vaccination and new variants, which imply continued border restrictions.

Cyclical Divergence
These differences in fiscal stimulus are poised to augment pre-existing cyclical divergences across major economies, paving the way for potentially even deeper divergences driven by different approaches to Bidenomics and ESG.
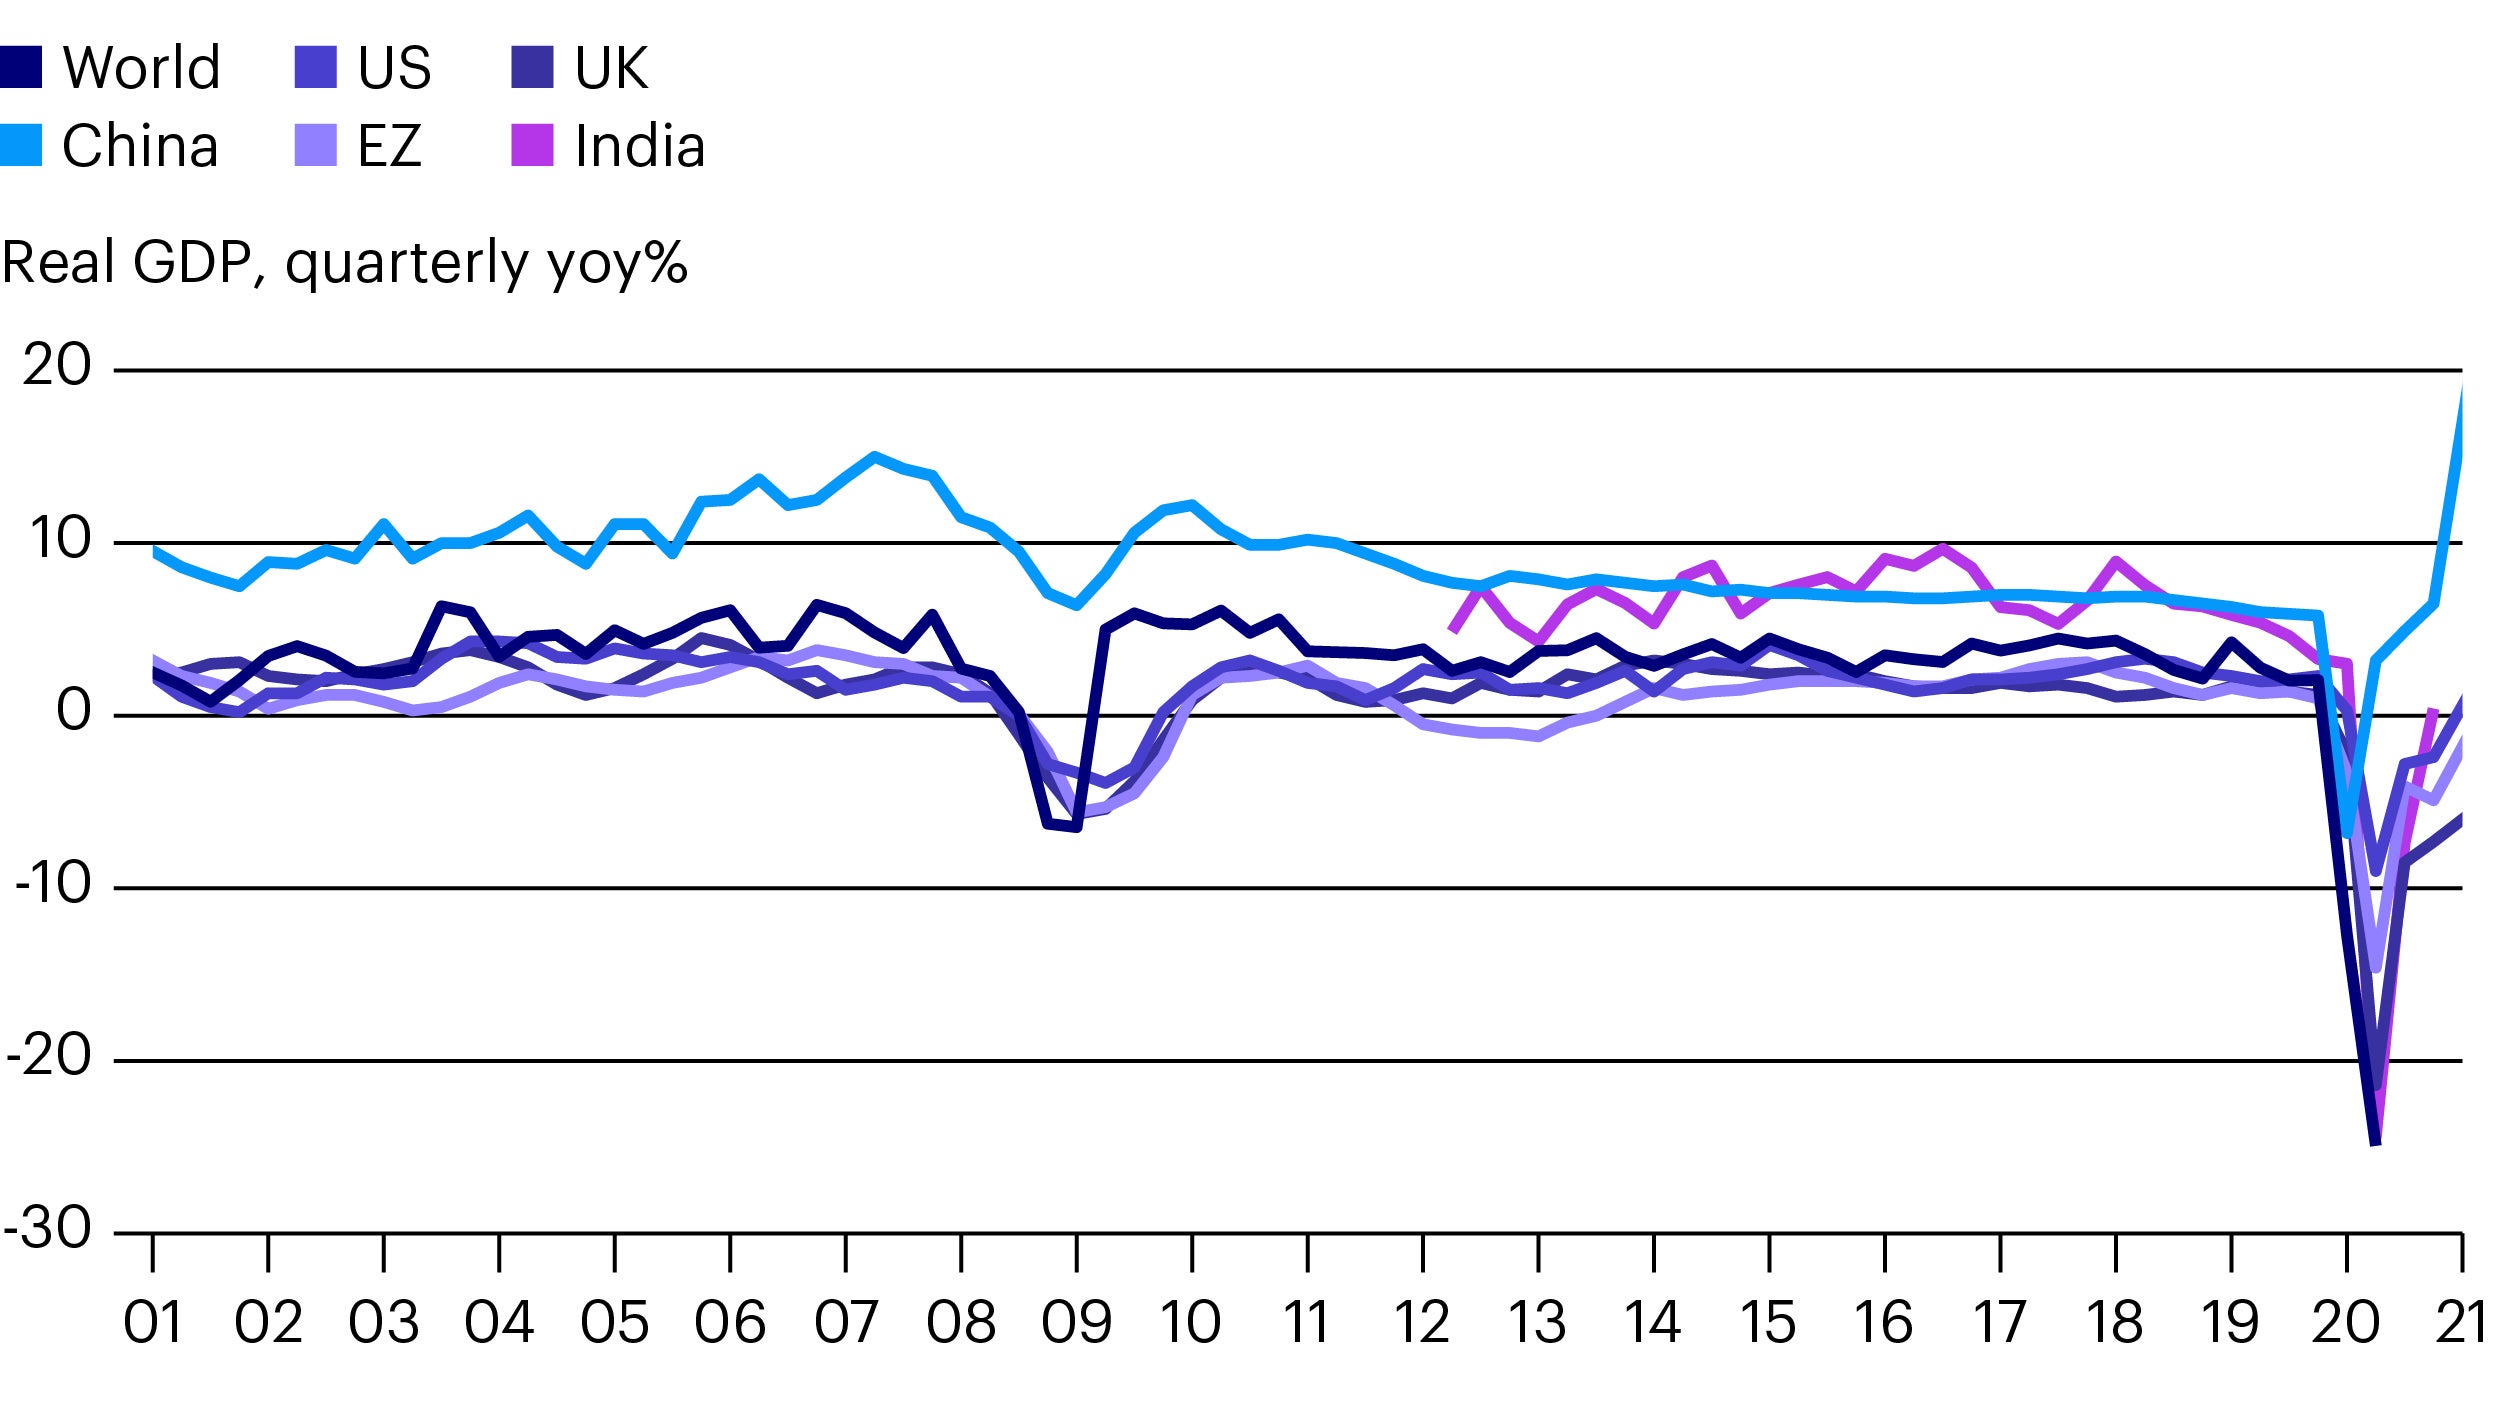
Global growth cycles have changed markedly since the GFC and EZ crisis (Figure II). Beforehand, major DMs had smooth business cycles during “The Great Moderation” – after high inflation and stop-start, boom-bust cycles of the 1970s-80s were tamed in the 1990s. But global growth was much more variable, largely due to greater variability amid faster trend growth in China and other EMs.
After the GFC, China’s growth became far smoother, but global growth remained variable as national cycles in other major DMs became choppier and EM growth remained volatile (here shown by India). Mid-cycle slowdowns became more frequent in the UK (with Brexit) as well as the EZ (notably with EZ crisis) and India (due to demonetization in 2016, for example). Most recently, the Great Compression precipitated by lockdowns and subsequent re-opening rebounds caused the path of economic activity to diverge across economies.
Re-Mapping Global Growth
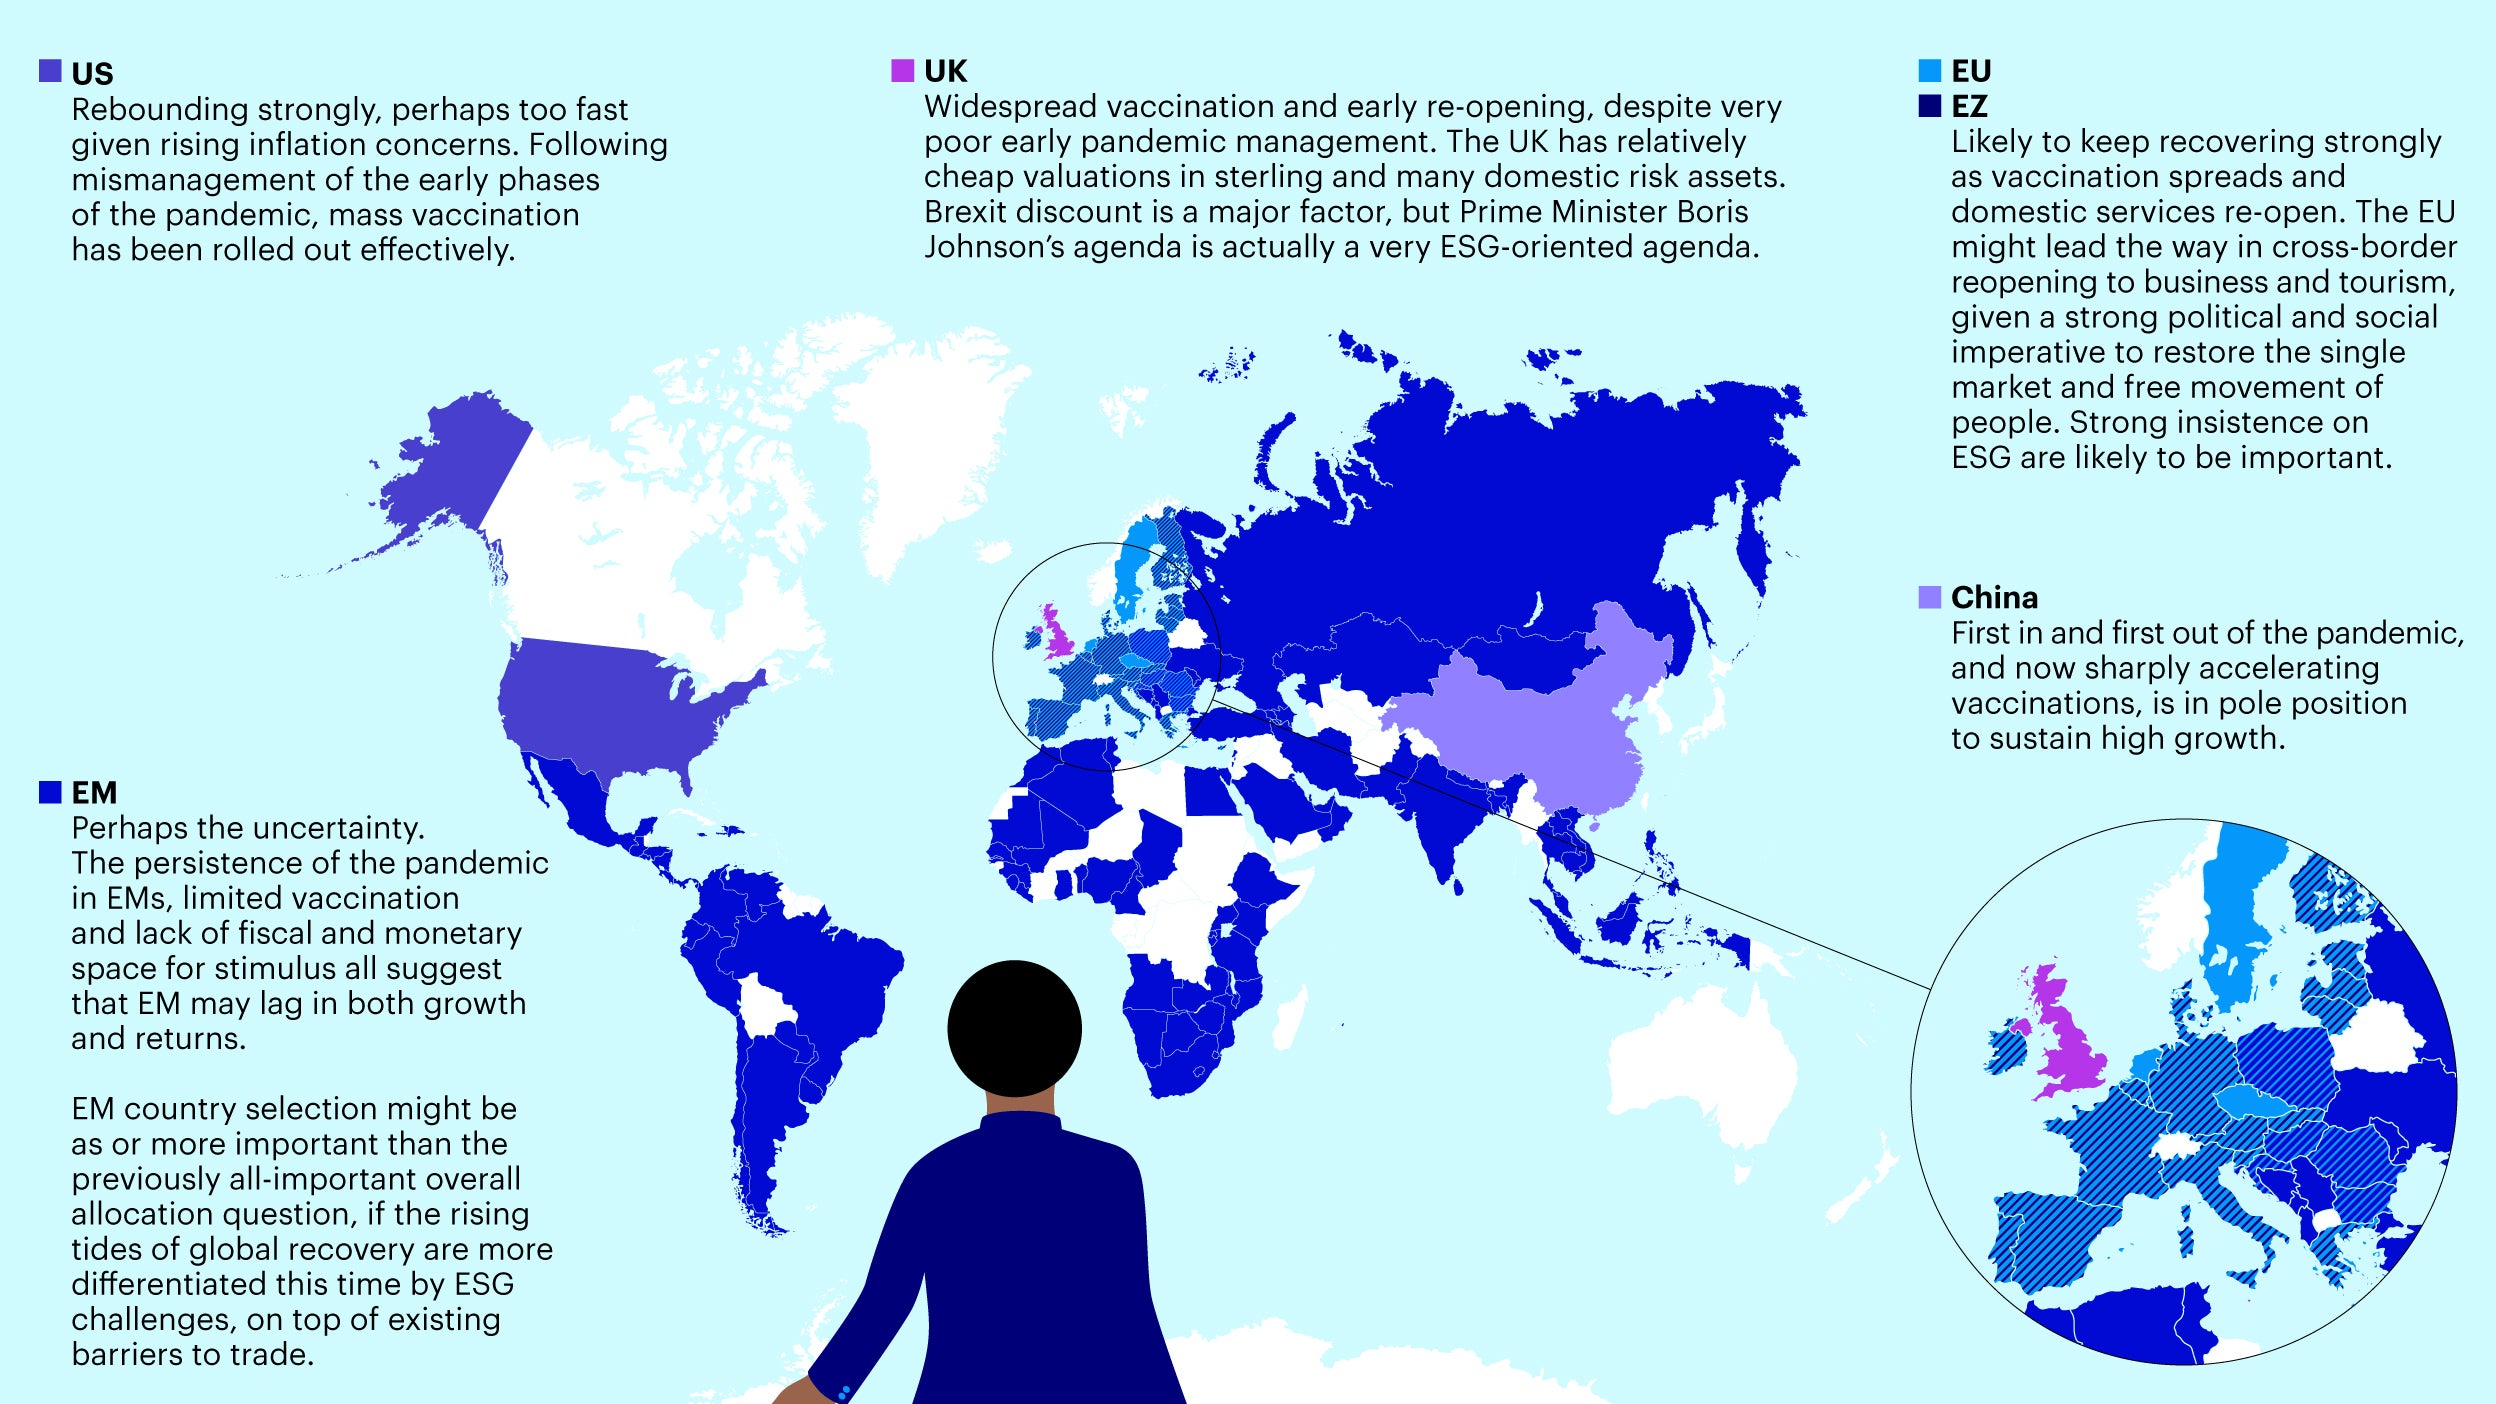
All this points to divergent recovery across economies, sectors and asset classes instead of a conventional cyclical recovery. Instead of robust growth, supported by a rising global tide that lifts all, the focus first is on which countries can release domestic services thanks to effective mass vaccination, with the least damage to potential growth.
Eventually the focus would turn to countries best placed for ESG-oriented regulatory and structural change in the long term. In a world still starved for growth, inflation and yield, country selection may become even more important in asset allocation, to identify economies best able to both recover and build back better.

Related articles


Keep up-to-date
Sign up to receive the latest insights from Invesco’s global team of experts and details about on demand and upcoming online events.
Investment risks
-
The value of investments and any income will fluctuate (this may partly be the result of exchange rate fluctuations) and investors may not get back the full amount invested.
Important information
-
Data as of 31 May 2021 unless stated otherwise.
This document is marketing material and is not intended as a recommendation to invest in any particular asset class, security or strategy. Regulatory requirements that require impartiality of investment/investment strategy recommendations are therefore not applicable nor are any prohibitions to trade before publication. The information provided is for illustrative purposes only, it should not be relied upon as recommendations to buy or sell securities.
Where individuals or the business have expressed opinions, they are based on current market conditions, they may differ from those of other investment professionals, they are subject to change without notice and are not to be construed as investment advice.


