
Economy 2021: Global Economic Outlook
What kind of economic recovery can we expect to see in 2021?


When the 2-year US government bond yield goes lower than the Fed funds target rate, we must ask ourselves the question “are the Fed behind the curve?”.
As Figure 1 below shows this crossover happened in 1989, 1995, 1998, 2000, 2006 and earlier this year. In three of the previous occurrences a recession followed so the Fed can be judged, with hindsight, to have been behind the curve as previous rate rises proved to be too much for the economy. Rates were eventually cut aggressively.
Following the other two occurrences (1995 and 1998) the 2-year rate continued to decline for a short period as rates were cut about 1% but then reversed course allowing Fed funds to rise modestly.
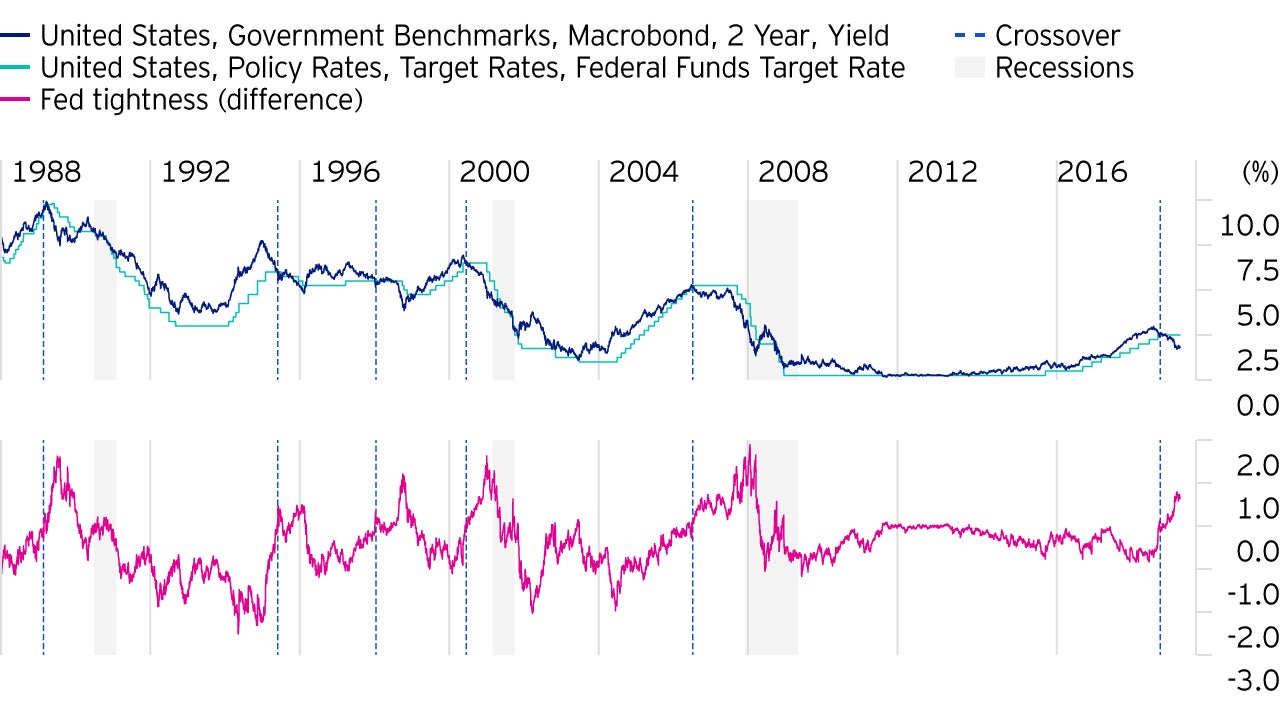
We are now facing an interesting fork in the road. After a rally in the 2-year bonds of similar magnitude to the 1995 and 1998 crossover events and with about 75bp of rate cuts priced in, where do we go from here?
If a growth environment is to persist in the US, then credit growth will need to pick up again. Recently, money growth (M2) and bank lending have been growing at about 5% year-on-year, levels that are traditionally seen around recessions. It doesn’t help that the senior loan officers survey (on loan demand) remains downbeat.
Apart from loan demand, we have also focused on whether banks have the capacity to lend. Their balance sheets are constrained by legislation (Basel 3) but also, for the investment banks, by actions of market participants.
For example, if a counterparty sells them a cash bond it takes up space on their balance sheets that might otherwise be used for lending. These constraints manifest themselves in market pricing, so, for example, cash bonds might trade cheap compared to an equivalent swap trade. We have built an index to track these constraints on behaviour across a range of markets.
This index of stress in bank capacity is, as you might expect, associated with swings in risk assets. When the index rises then, typically, sovereign bonds, the US dollar and volatility also rise while equities fall and credit spreads widen.
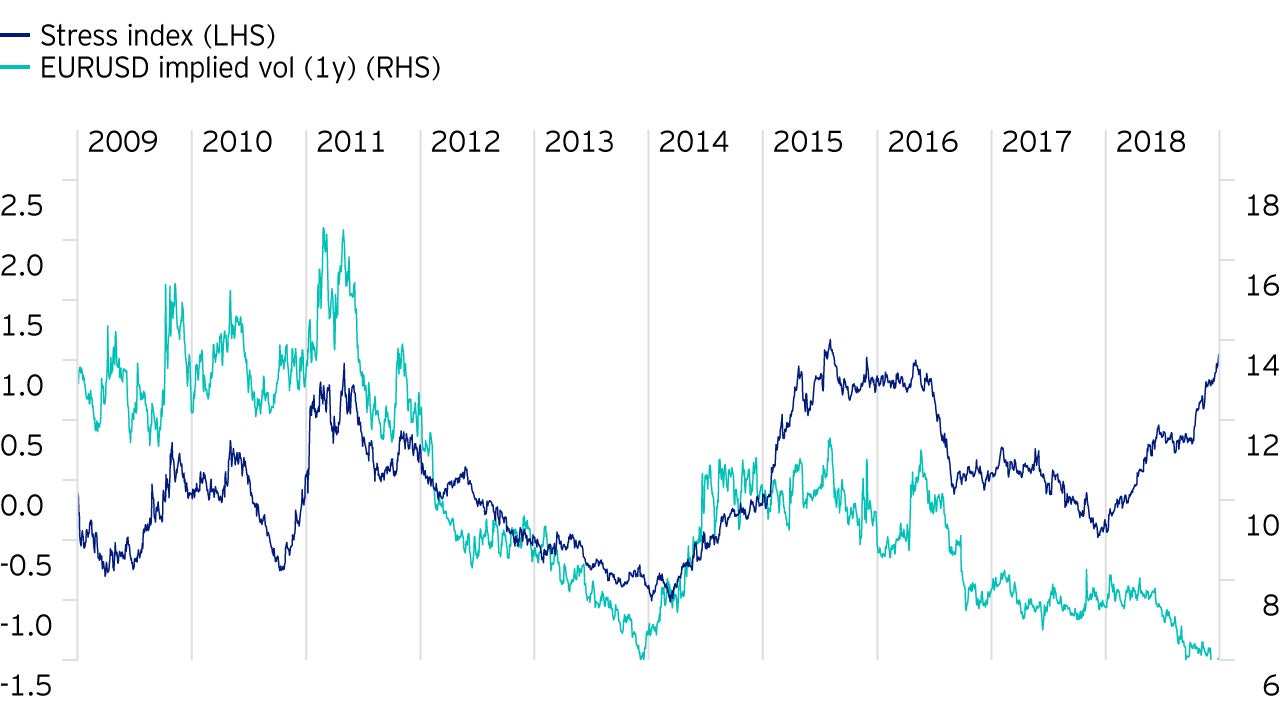
In the last few years, the behaviour of most asset classes has been consistent with this index. The biggest exception right now looks to be volatility – it looks too cheap considering banks are under pressure (Figure 2 shows EURUSD implied volatility).
Is now the time for volatility to pick up? We’ve certainly been waiting for a while but at the very least it surely has more upside than downside, something that can’t be said about rates anymore.
What kind of economic recovery can we expect to see in 2021?

This white paper addresses our short-term investment views based on our forward-looking global macro framework.

After a short, sharp recession (and more rapid rebound than we expected), the question is whether we are now at the start of a new global cycle?

