Markets and Economy
Above the Noise: Getting back to normal
While the economic ramifications of COVID-19 quarantines have persisted, normalization is in sight as an easing cycle appears to be on the horizon.

By January 2025, the Federal Reserve (Fed) is likely to be in an easing cycle, which may benefit the market regardless of who wins the election.
A recent quote from Fed Chair Jerome Powell about the Fed, inflation, and confidence was music to my ears.
I share which market chart I would give each presidential candidate to help them make their economic case to voters.
I’ve been reflecting a lot lately. I’ll chalk it up to the four-year anniversary of the COVID outbreak. It’s comforting for me to contemplate how far we’ve come in such a short time. A weight was lifted when I no longer had to make parenting and investment decisions in the throes of a pandemic.
My unquiet brain has also been ruminating over the period before the Global Financial Crisis. No, I don’t believe we’re heading towards a leverage-driven calamity. Rather, I’m reminded of the period in the spring and summer of 2007 when oil and copper prices spiked1, inflation climbed2, and the 2-year US Treasury rate surged by over 60 basis points to hit 5%.3 I vividly remember being told by many that the US Federal Reserve was going to have to raise rates again. That hasn’t aged well. Unfortunately, it’s all too familiar to what I’m hearing in certain corners now. I’m not buying it this time either. Policy tightening operates with variable lags. A hard landing for the US economy is unlikely, but a slowdown and coincident easing cycle are likely coming.
As an investor, I prefer to not fight the Fed.
“We’re waiting to become more confident…when we do get that confidence—and we’re not far from it—it’ll be appropriate to begin to dial back the level of restriction.”4 – Jerome Powell
That’s music to my ears. If the core Personal Consumption Expenditures index, which is the Fed’s preferred measure of inflation, has grown by only 2.8% over the past year5 then why do we need a Fed Funds Rate of 5.25%?6 That feels unnecessarily restrictive, particularly for the nation’s regional banks, which could greatly benefit from the normalization of the yield curve.
…the evidence suggests that US inflation will cool regardless of the “stickiness” seen in recent reports:
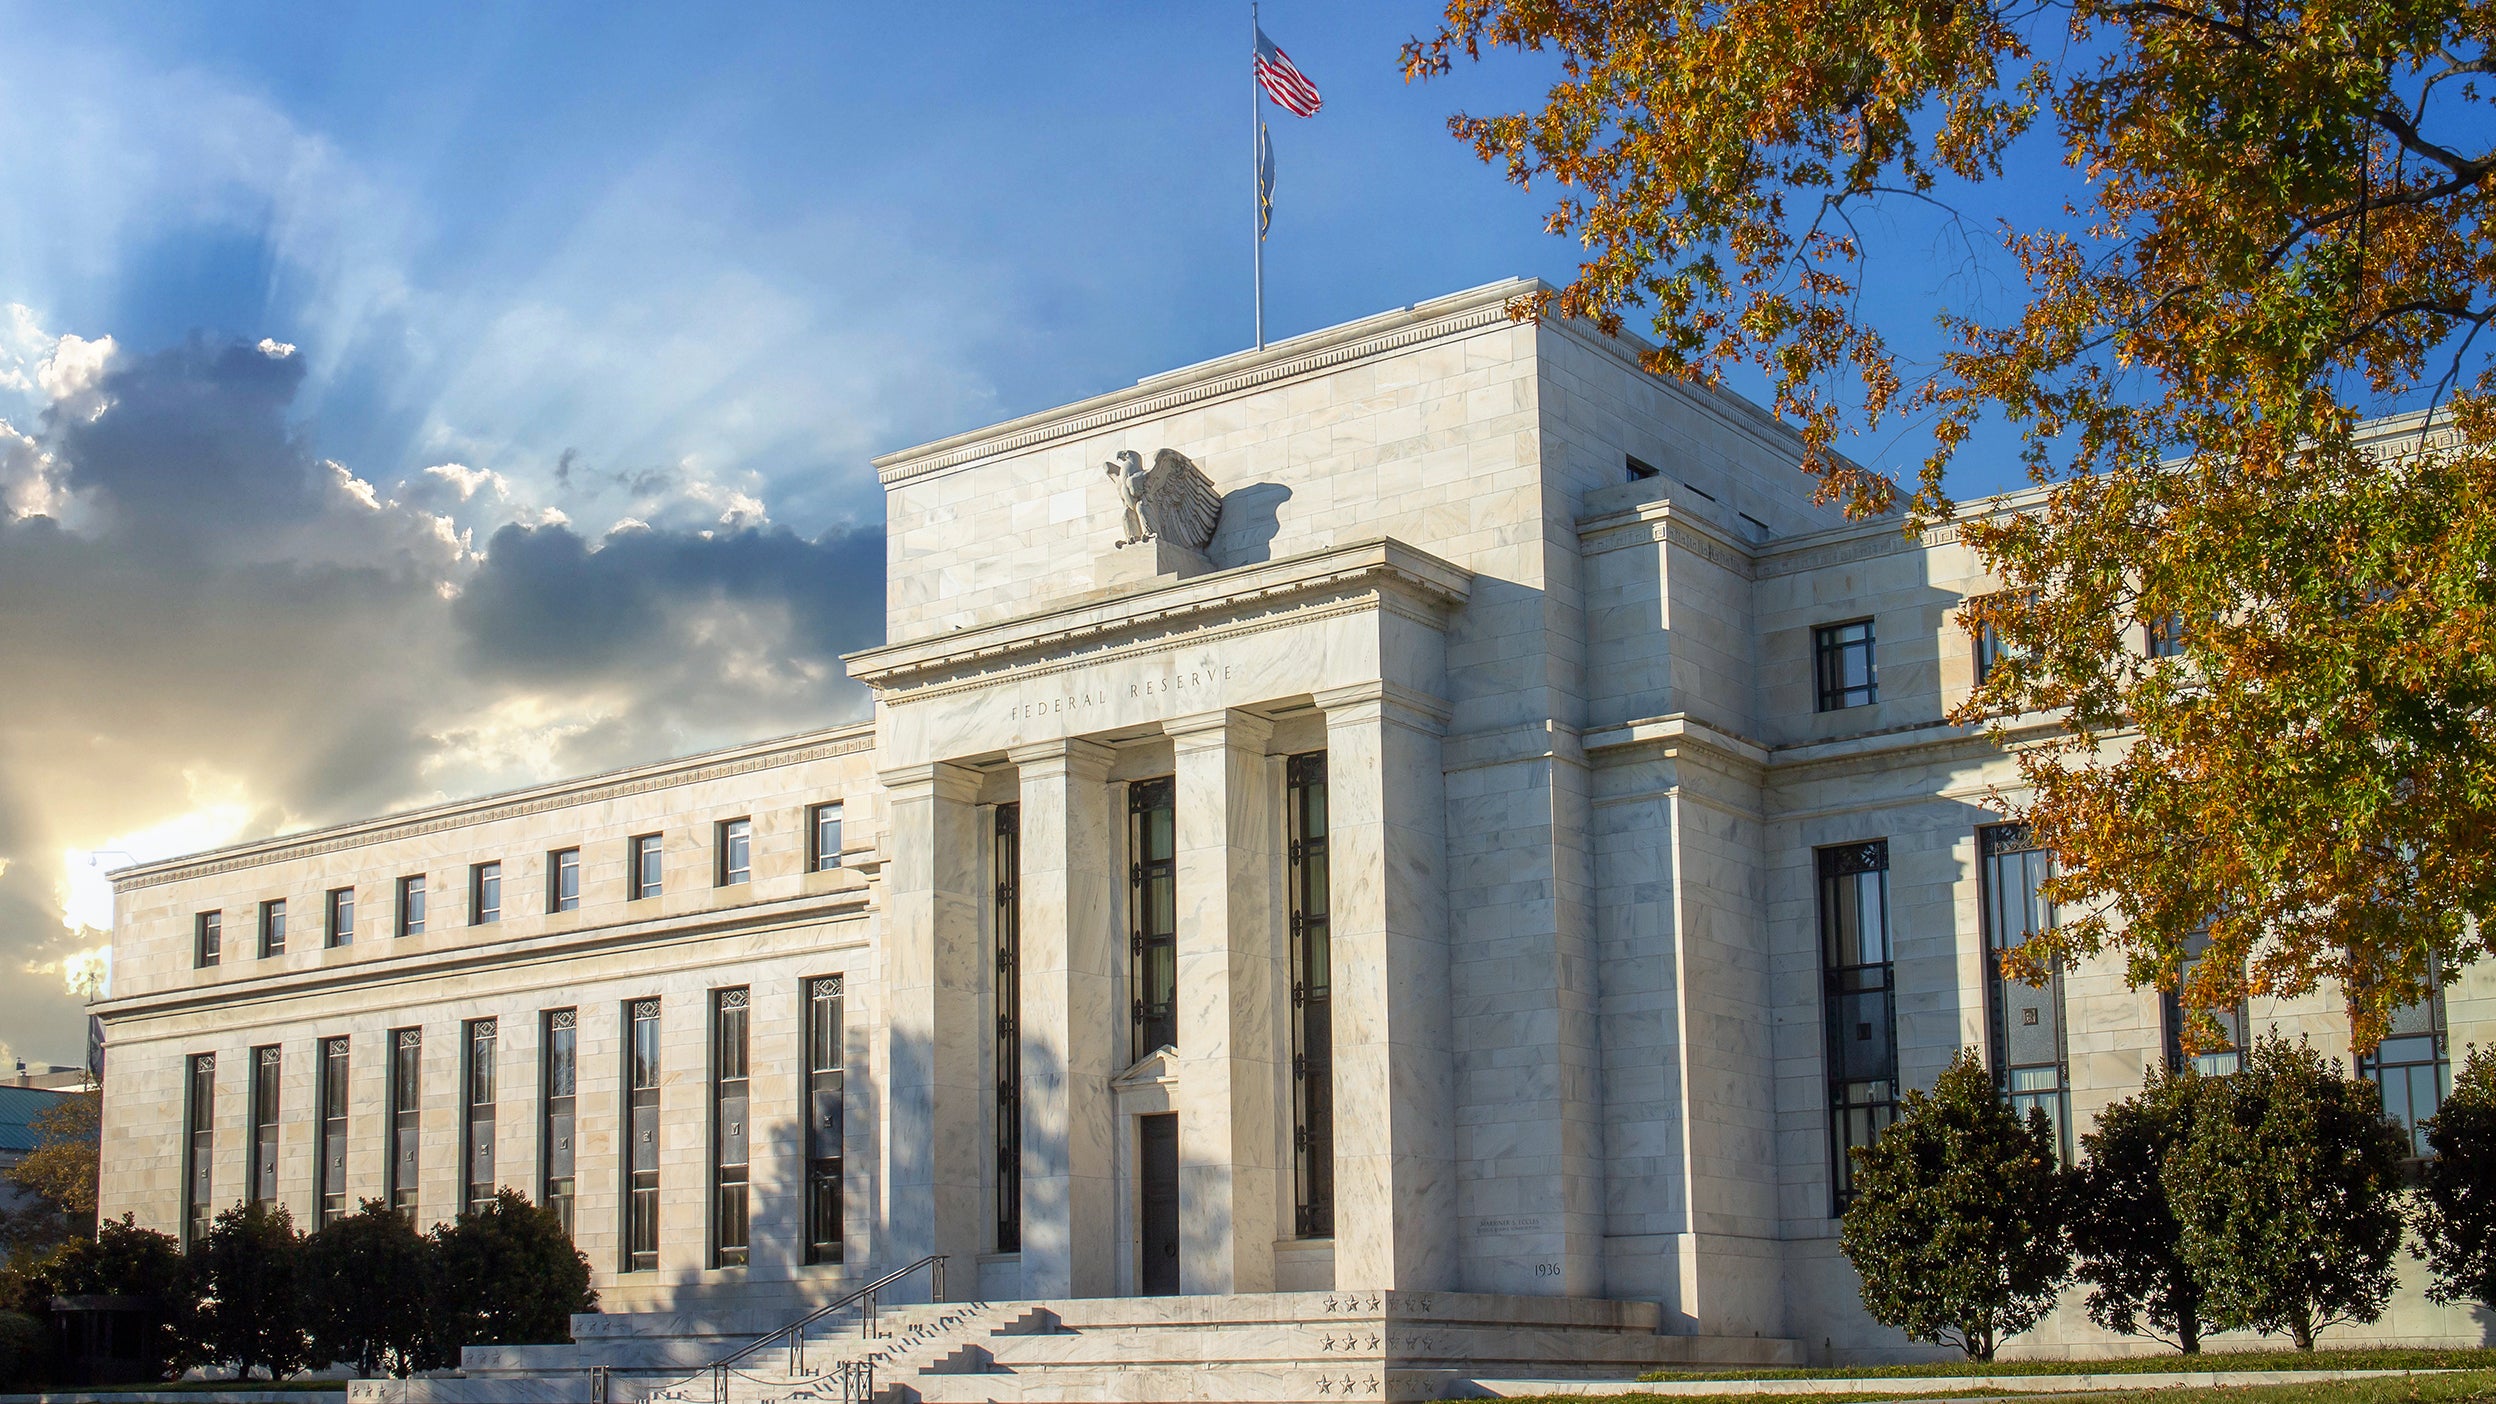
At the risk of being a broken record, there is too much investor focus on the US presidential election. I’ve often joked that when the Levitt family goes to Washington, DC, we don’t first go to the White House but rather to the Federal Reserve Building. That way the family can see where the decisions that truly matter for the financial markets are made.
Historically, presidents have been helped or hurt by whether the Federal Reserve has been working to ease or tighten financial conditions. As an example, Trump and Biden both experienced strong equity returns in their first years in office, only for the second year to be challenging as the Federal Reserve raised interest rates. In each case, third year returns were strong as the Fed backed off their tightening stances.11 By January 2025, the Federal Reserve is likely to be in an easing cycle. History suggests that may benefit the market regardless of who wins the election.
(Read more about why I believe investors shouldn’t worry about the election results.)
Q: Are you concerned that the US equity market won’t perform well in 2025 if the corporate tax cuts of 2018 are allowed to expire?
A: First, it’s hard to be concerned when we don’t know what the outcome of the election will be. Second, let’s not assume that we know exactly what any administration will do. Remember the feared fiscal cliff in 2013? President Obama ultimately extended 82% of the Bush-era tax cuts.12 Finally, the corporate tax rate has increased five times since 1950.13 The US equity market posted gains in each of those five years. The average return was 12.96%.14 Let’s not stress about this.
Interest rates have once again moved higher. Are you concerned that this is the result of investors losing their appetite for US debt? I posed this question to Arnab Das, Global Macro Strategist at Invesco. His response:
No, fiscal concerns do not appear to be driving US rates. Historically there has not been a clear relationship between the yield that investors require to hold a longer-term security and the fiscal status of the US. In fact, the additional real yield required to own longer-term bonds has been remarkably stable over time, suggesting that there is not a fiscal credibility problem.15 For what it is worth, the inflation compensation that investors require has also been stable over time, indicating that the US Federal Reserve also does not have a credibility problem.16 Rather, the incremental yield demanded by investors to own longer-term security appears to be almost entirely driven by Federal Reserve policy.17 This suggests that the upcoming Fed easing cycle will likely drive interest rates lower across the yield curve, irrespective of the fiscal health (or lack thereof) of the US government.
My recent travels took me to Greenville, South Carolina. I was told by a client that the audience was impressed by the number of charts that I had brought with me. I quipped that I’m paid by the chart. He said, “Maybe you should be. Perhaps you could advise one of the candidates. Provide them charts for the campaign trail, like Ross Perot had in 1992.” He then asked if I could give each campaign one chart then what would it be? Oh boy. Dangerous ground. Here goes:
Did I handle that well? I’m not sure if I pleased everyone or upset everyone. I will not be seeking Invesco approval to have an outside business interest of providing charts to politicians. I doubt this election will be won by the stat keepers anyway.
Welcome to April. Spring is here!
Source: Bloomberg.
Source: US Bureau of Labor Statistics. The US Consumer Price Index climbed from September 2006 to November 2007 from 1.4% to 4.3% on a year over year basis.
Source: Bloomberg. The 2-year US Treasury climbed from 4.5% in March 2007 to 5.1% in June 2007.
Source: CNBC, “Powell says the Fed is ‘not far’ from the point of cutting interest rates,” March 7, 2024.
Source: Bureau of Economic Analysis, 1/31/24.
Source: US Federal Reserve, 3/18/24.
Source: Federal Reserve Bank of Atlanta, 2/29/24. Based on the Atlanta Wage Growth Tracker, which uses census data to measure wage growth of individuals in the US.
Source: Federal Reserve Bank of New York 2/29/24. Based on US inflation expectations for one-year ahead.
Source: Drewry World Container Index, 3/14/24. Based on the World Container Index Composite Container Freight Benchmark Rate per 40 Foot Box. The index reports actual spot container freight rates for major East-West trade routes.
Source: S&P CoreLogic Case-Shiller, 2/29/24.
Source: Bloomberg, 2/29/24. Based on the S&P 500 Index. Returns in 2017, 2018, and 2019 were 21.8%, -4.4%, and 31.5%, respectively. Returns in 2021, 2022, and 2023 were 28.9%, -18.1%, and 26.3%, respectively.
Source: US Treasury Department
Source: US Treasury Department, 12/31/23.
Source: Bloomberg, 12/31/23. Based on the annual returns of the Dow Jones Industrial Average in 1950, 1951, and 1952. Based on the annual returns of the S&P 500 Index in 1968 and 1993. The Dow Jones Industrial Average was used in 1950-1952 because the S&P 500 Index didn’t go live until 1957. The Dow Jones Industrial Average is a price-weighted index of the 30 largest, most widely held stocks traded on the New York Stock Exchange.
Source: Bloomberg, 2/29/24. Based on the components of the US Treasury term premium.
Source: Bloomberg, 2/29/24. Based on the components of the US Treasury term premium.
Source: Bloomberg, 2/29/24. Based on the components of the US Treasury term premium.
Source: Organisation for Economic Co-operation and Development, 12/31/23. Based on growth in gross domestic product from Q4 2019 to Q4 2023.
Source: US Federal Reserve, 2/29/24. M2 is a measure of the US money stock that includes M1 (currency and coins held by the non-bank public, checkable deposits, and travelers' checks) plus savings deposits (including money market deposit accounts), small time deposits under $100,000, and shares in retail money market mutual funds.

Above the Noise: Getting back to normal
While the economic ramifications of COVID-19 quarantines have persisted, normalization is in sight as an easing cycle appears to be on the horizon.

Beyond money markets: Maximizing your cash
Higher interest rates have enticed investors into money markets. But they aren’t risk free, and stocks and bonds have historically returned more over the long term.

Above the Noise: Stagflation fears and election years
Today’s unemployment and inflation environment is a far cry from what it was in the 1980s’ stagflationary years. Plus, the market isn’t necessarily more volatile in election years.
Important information
NA3471295
Image: tanarch / Adobe Stock
Some references are US specific and may not apply to Canada.
All investing involves risk, including the risk of loss.
Past performance does not guarantee future results.
Investments cannot be made directly in an index.
This does not constitute a recommendation of any investment strategy or product for a particular investor. Investors should consult a financial professional before making any investment decisions.
In general, stock values fluctuate, sometimes widely, in response to activities specific to the company as well as general market, economic and political conditions.
The US Consumer Price Index (CPI) measures change in consumer prices as determined by the US Bureau of Labor Statistics. Core CPI excludes food and energy prices while headline CPI includes them.
Personal consumption expenditures (PCE), or the PCE Index, measures price changes in consumer goods and services. Expenditures included in the index are actual US household expenditures.
The S&P CoreLogic Case-Shiller U.S. National Home Price Index is a composite of single-family home price indices for the nine US Census divisions.
Tightening monetary policy includes actions by a central bank to curb inflation.
The yield curve plots interest rates, at a set point in time, of bonds having equal credit quality but differing maturity dates to project future interest rate changes and economic activity.
The federal funds rate (or fed funds rate) is the rate at which banks lend balances to each other overnight.
The Group of Seven, or G7, is an informal group of industrialized democracies that meets annually to coordinate global economic policy and address other transnational issues.
A basis point is one hundredth of a percentage point.
Term premium is the additional return or yield investors expect for holding long-term US bonds and notes instead of shorter-term debt.
Gross domestic product is a broad indicator of a region’s economic activity, measuring the monetary value of all the finished goods and services produced in that region over a specified period of time.
The opinions referenced above are those of the author as of March 25, 2024. These comments should not be construed as recommendations, but as an illustration of broader themes. Forward-looking statements are not guarantees of future results. They involve risks, uncertainties and assumptions; there can be no assurance that actual results will not differ materially from expectations.
This link takes you to a site not affiliated with Invesco. The site is for informational purposes only. Invesco does not guarantee nor take any responsibility for any of the content.