Insurance Insights Q1 2023: Enhancing credit exposures

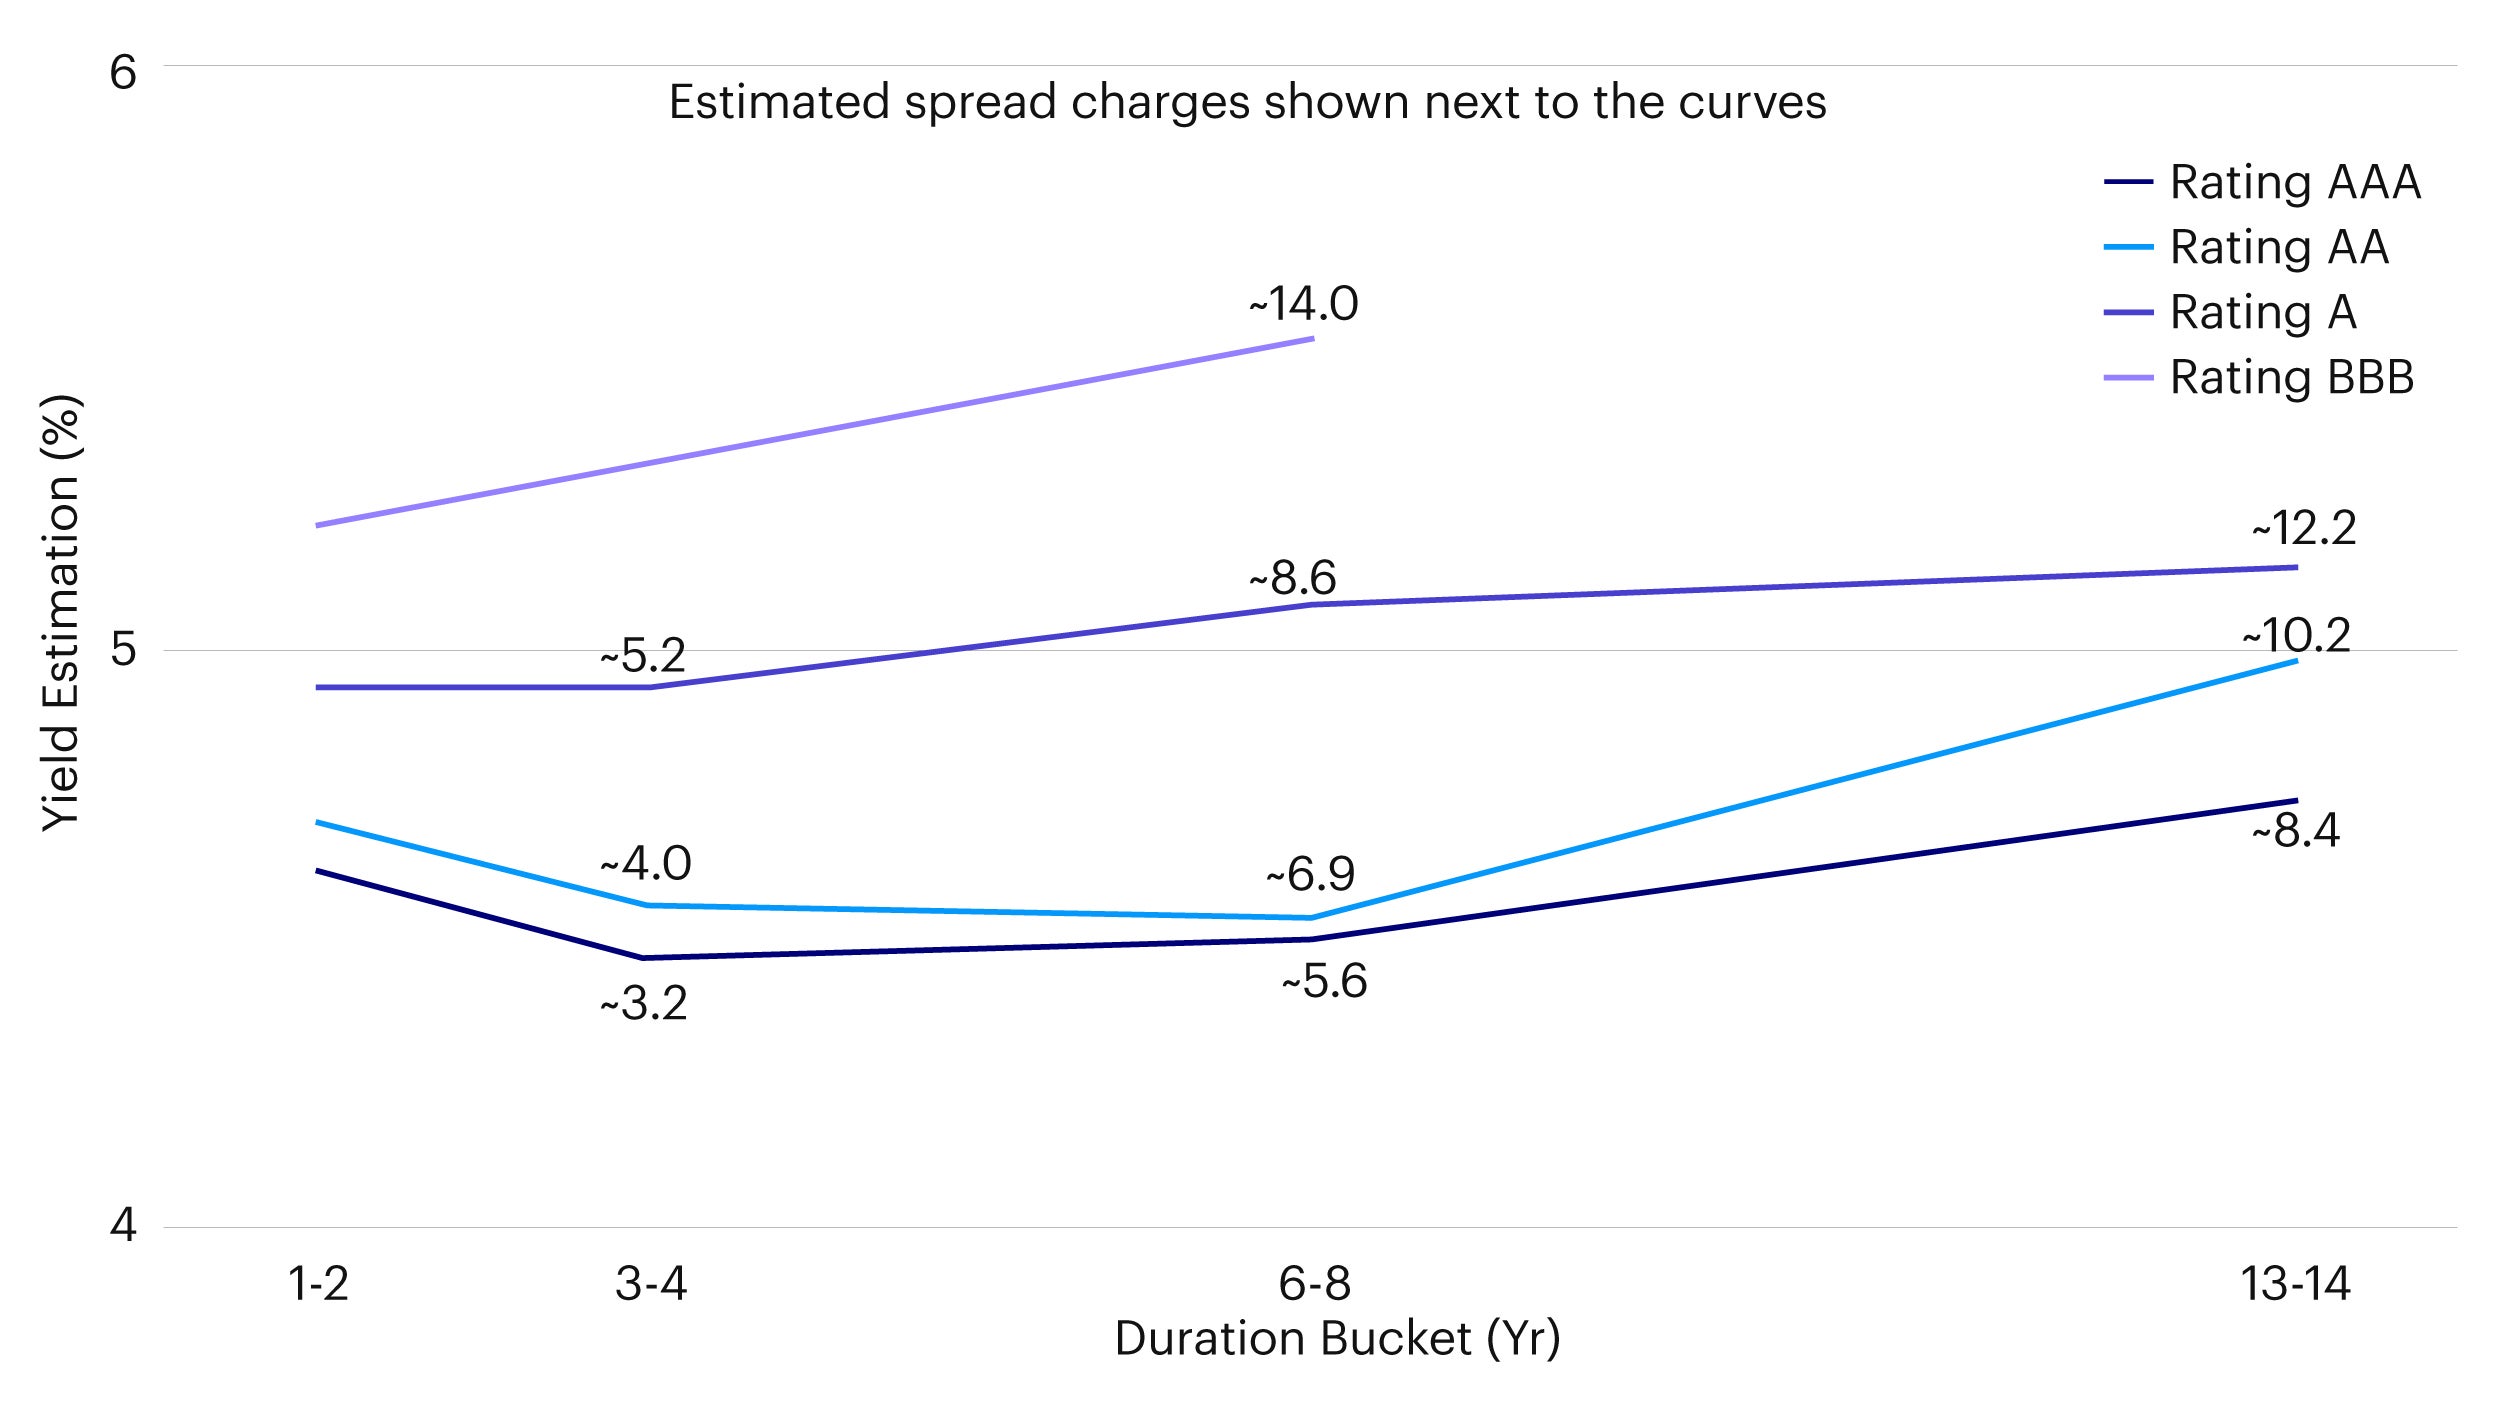
As an extension to the earlier analysis, we take a closer look at the impact of spread risk requirements on credit duration exposures generically and assess ways to manage this duration-spread interplay. The chart below shows the estimated yields (adjusted for defaults) for various durations and ratings of credit indices (and estimates of spread risk requirements under Solvency II) – as an illustrative example only1 (the yields are at a point in time and simply meant to highlight variations that can occur, and which can be considered when looking at asset allocations and where to deploy funds):

Note: ICE BofAML 1-3 Year AAA US Corporate Index, ICE BofAML 3-5 Year AAA US Corporate Index, ICE BofAML 7-10 Year AAA US Corporate Index, Bloomberg U.S. Long Credit Aaa (Ret), ICE BofAML 1-3 Year AA US Corporate Index, ICE BofAML 3-5 Year AA US Corporate Index, ICE BofAML 7-10 Year AA US Corporate Index, Bloomberg U.S. Long Credit Aa (Ret), ICE BofAML 1-3 Year Single-A US Corporate Index, ICE BofAML 3-5 Year Single-A US Corporate Index, ICE BofAML 7-10 Year Single-A US Corporate Index, Bloomberg U.S. Long Credit A (Ret), ICE BofAML 1-3 Year BBB US Corporate Index, ICE BofAML BBB US Corporate Index .
As an example of the type of analysis that can be done to manage spread risk requirements, we go through a simple case study, where we have assumed a portfolio with an allocation to generic A-rated US credit.

Note: Bloomberg U.S. Credit A (Ret) Index (LDA1TRUU IDX).
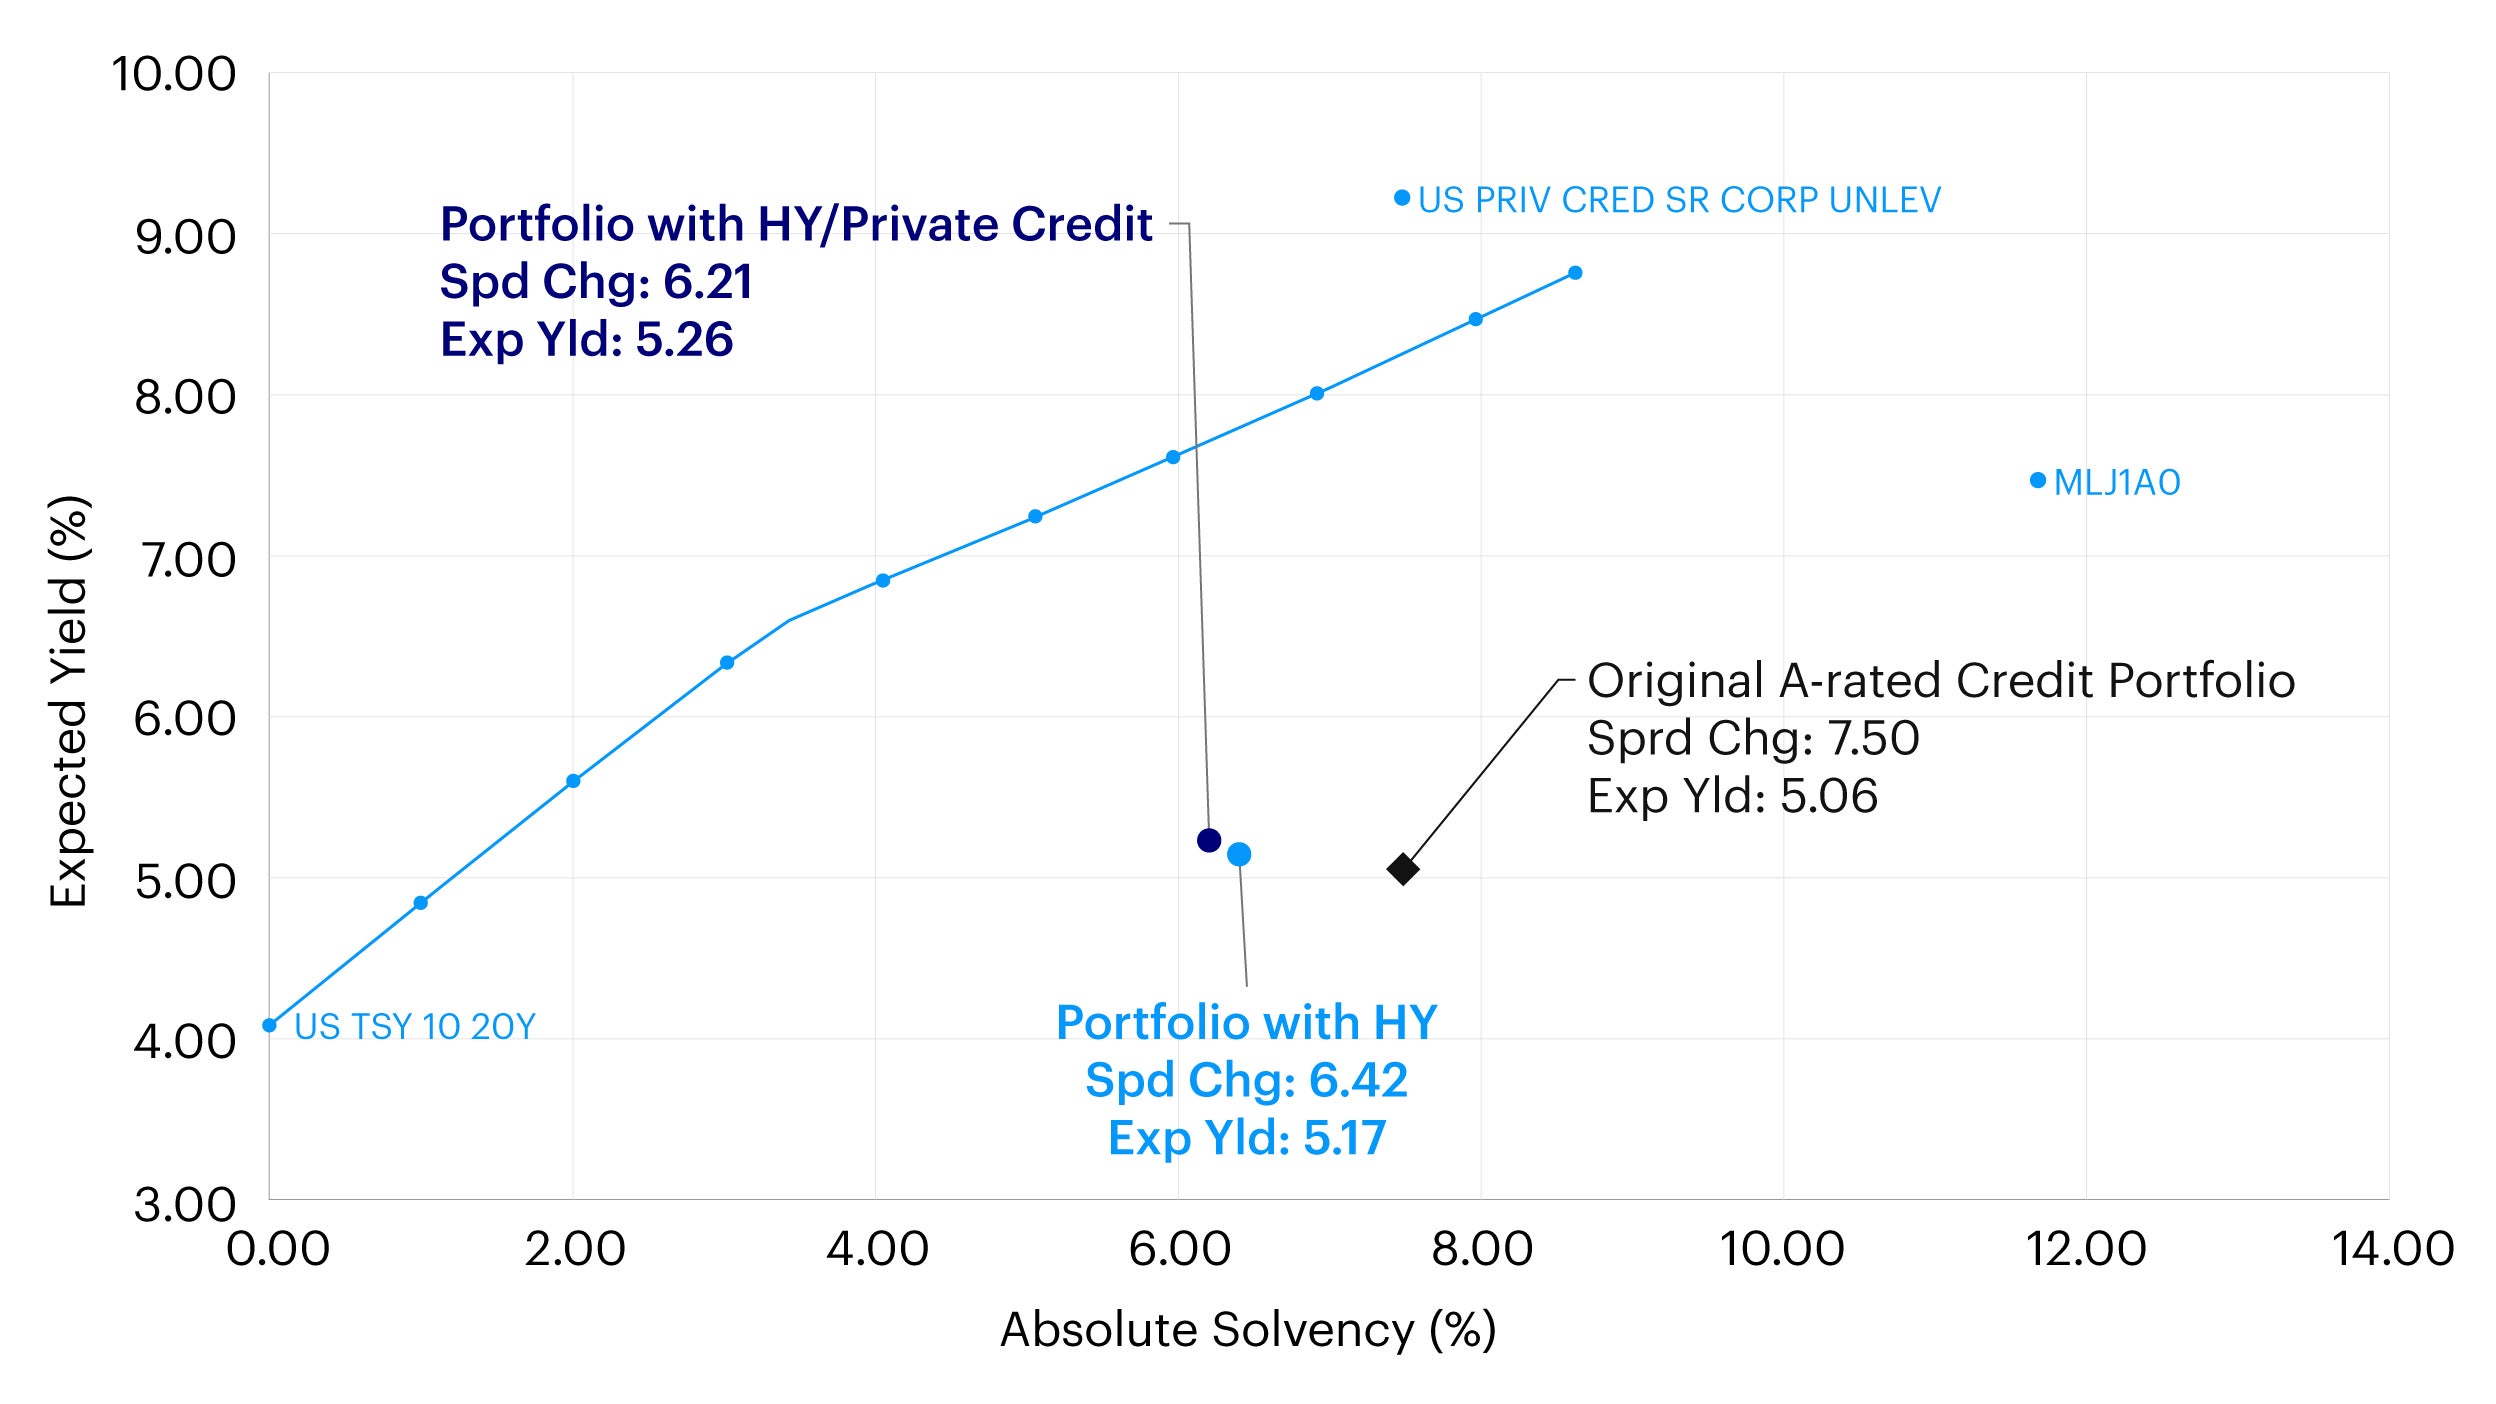
We have used the Bloomberg U.S. Credit A as a proxy for this exposure; the estimated yield of the index is 5.06% with a duration of around 6.9 years and with a resultant spread risk requirement of around 7.5%.
Now, we assess whether with adding long-duration government bonds and shorter-dated more yielding fixed income assets can enhance efficiency:

Note: Bloomberg US Treasury 10-20 Year Index (LT10TRUU IDX), ICE BofAML 1-3 Year US Cash Pay High Yield Index (J1A0 IDX).
By adding a 20% exposure to longer-dated US Treasuries (proxied by the Bloomberg US Treasury 10-20 Year index) and a 10% allocation to short duration high yield (proxied by the ICE BofAML 1-3 Year US Cash Pay High Yield Index) and reducing the allocation to US A-rated Credit to 70% in the table above, we see that we can enhance the yield estimate by around 10bp and reduce the spread risk requirement to around 6.4%; the duration of the portfolio has increased by around 1 year.
We can also add small exposure to an alternative asset class to help enhance the characteristics of the portfolio:

Note: Bloomberg U.S. Credit A (Ret) Index (LDA1TRUU IDX), Bloomberg US Treasury 10-20 Year Index (LT10TRUU IDX), ICE BofAML 1-3 Year US Cash Pay High Yield Index (J1A0 IDX), Invesco Private Credit US Senior Corporate Unlevered (IVZ_PC_US_SRCORP0L).
As a further modification, if we split the 10% high yield allocation into 5% high yield and 5% private credit (proxied by Invesco’s Private Credit US Senior Corporate Unlevered Index) in the table above, we are able to enhance the estimated yield by a further 9bp and reduce the spread risk requirement to around 6.2%; the duration remains almost unchanged from the earlier modification.
We show the results of the analysis in the chart below:

Source: Invesco analysis, 31 December 2022.
While certain parameters have been improved, there is some element of mismatch/reinvestment risk that is being introduced (in addition to slight illiquidity risk corresponding to the private credit allocation), and this should be assessed more fully in the context of overall asset-liability management. This is meant to be a simple illustration of how to continually look for efficiencies in portfolio construction – however, with the caveat that all sources of risk that might be introduced must be understood and managed appropriately.
Investment risks
The value of investments and any income will fluctuate (this may partly be the result of exchange rate fluctuations) and investors may not get back the full amount invested. Diversification and asset allocation do not guarantee a profit or eliminate the risk of loss.
Invesco Investment Solutions (IIS) develops Capital Market Assumptions (CMAs) that provide long-term estimates for the behavior of major asset classes globally. The team is dedicated to designing outcome-oriented, multi-asset portfolios that meet the specific goals of investors. The assumptions, which are based on 5- and 10-year investment time horizon, are intended to guide these strategic asset class allocations. For each selected asset class, IIS develop assumptions for estimated return, estimated standard deviation of return (volatility), and estimated correlation with other asset classes. Estimated returns are subject to uncertainty and error and can be conditional on economic scenarios. In the event a particular scenario comes to pass, actual returns could be significantly higher or lower than these estimates.
Footnotes
-
1
Hypothetical Simulated Performance
Performance shown is simulated. The simulation presented here was created to consider possible results of a strategy not previously managed by Invesco for any client. Simulated performance is hypothetical. It does not reflect trading in actual accounts and is provided for informational purposes only to illustrate these strategies during specific periods. There is no guarantee the simulated results will be realized in the future.
When available, underlying holdings are used to calculate performance. If historical underlying holdings returns are not available, a blend of underlying holding returns and underlying benchmark returns are used, with indexes being adjusted for expenses.
Actual investment performance will differ due to transaction and other costs and may be materially lower or higher than that of the hypothetical portfolios. Changes in investment strategies, contributions or withdrawals may materially alter the performance. These hypothetical results include reinvestment of dividends and other earnings.
Invesco cannot assure the simulated performance results shown for these strategies would be similar to the firm’s experience had it actually been managing portfolios using these strategies. In addition, the results actual investors might have achieved would vary because of differences in the timing and amounts of their investments. Returns shown for this simulation would be lower when reduced by the advisory fees and any other expenses incurred in the management of an investment advisory account. For example, an account with an assumed growth rate of 10% would realize a net of fees annualized return of 8.91% after three years, assuming a 1% management fee.
Simulated performance results have certain limitations. Such results do not represent the impact of material economic and market factors might have on an investment advisor's decision-making process if the advisor were actually managing client money. Simulated performance also differs from actual performance because it is achieved through retroactive application of a model investment methodology and may be designed with the benefit of hindsight.


