Nasdaq 100 Index – Commentary

Accessing Innovation in the US
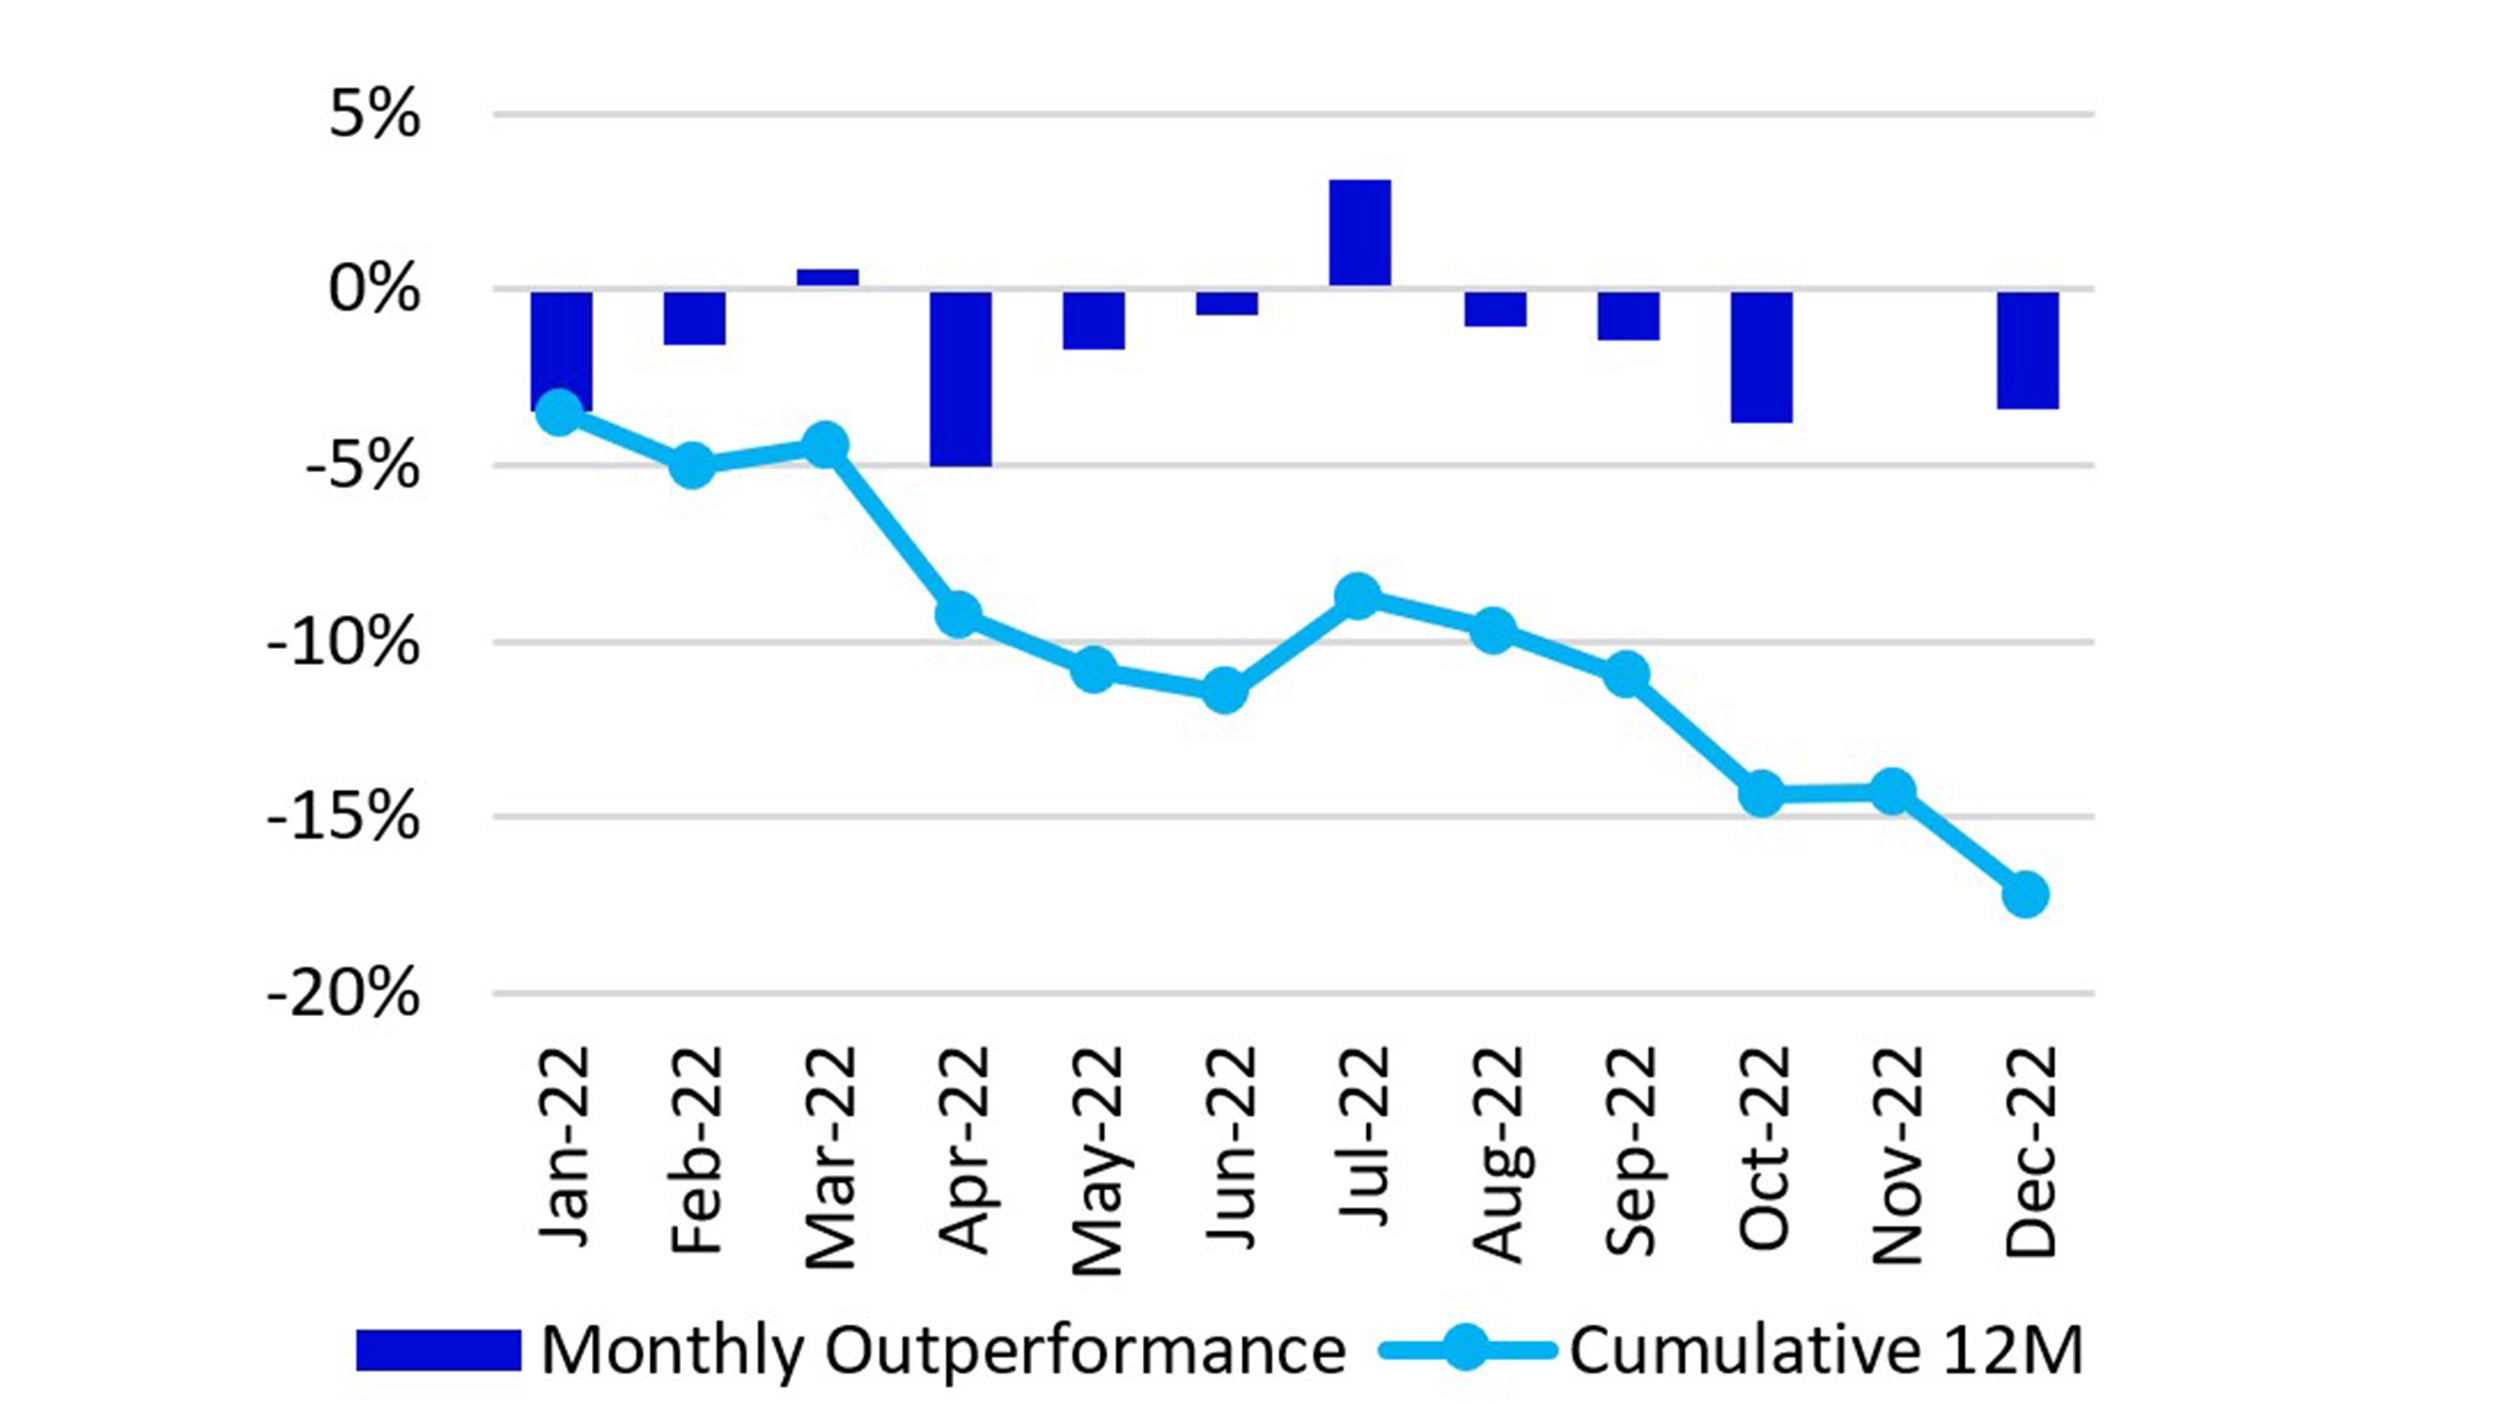
For the month of December, the Nasdaq 100 Index (NDX) returned -9.0%, underperforming the S&P 500 Index which also returned -5.8%. After the massive move up on the last day of trading seen in December, the market continued the overall trend seen this year and moved lower in December. The S&P 500 and NDX finished the year at levels seen at the beginning of December with NDX near its 52-week low. The release of the December Consumer Price Index (CPI) reading and the December Federal Open Market Committee (FOMC) meeting, the last meeting of 2022, proved to be major news events for the market, as we saw trading volume drop in the second half of the month.
The December CPI reading, which is a measure of inflation in the US, was released on December 12th and came in below analysts’ expectations. The month-over-month reading was reported at 0.1% vs. the 0.3% expectation, while the year-over-year came in at 7.1% vs. 7.3% reading. This was a significant change from the prior month’s year-over-year reading of 7.7%. Energy and commodities saw decreases compared to the prior month, the change in food was the same while the cost of services ex-energy continued to climb. Markets rose on December 12th with the hopes that the lower inflation reading would lead to a dovish stance from the FOMC.
During his post-meeting press conference, Jerome Powell remained firm that the fight against inflation is far from over and that rates will likely remain higher for longer. He reiterated the need for rates to remain restrictive to prevent inflation from becoming entrenched. Results from the meeting indicated that the terminal rate, or the level where the FOMC would stop rate hikes, may rise to 5.1%. This level indicated that there may be as many as three more 0.25% rate hikes in 2023. Moreover, the FOMC also indicated that rate cuts may not arrive until 2024.
China rolled back many of the “zero-COVID” policies that had been in place since the beginning of the outbreak of COVID-19. Individuals can now quarantine in their home vs. state-sponsored facilities if they have mild or no symptoms. They are also able to travel more freely inside the country.
Index performance
| 1M | YTD | 1Y | 10Y(ann.) | |
|---|---|---|---|---|
NASDAQ-100 |
-9.0% | -32.6% | -32.6% | 16.1% |
| S&P 500 | -5.8% | -18.5% | -18.5% | 11.9% |
Relative |
-3.4% | -17.2% | -17.2% | 3.7% |
Source: Bloomberg as of 30 Dec 2022.
Returns may increase or decrease as a result of current fluctuations. An investment cannot be made directly into an index.

Source: Bloomberg as of 30 Dec 2022.
Returns may increase or decrease as a result of current fluctuations. An investment cannot be made directly into an index
Past performance does not predict future returns.

Data: Invesco, FactSet Data as of 30 Dec 2022. Data in USD. Returns may increase or decrease as a result of currency fluctuations.
Nasdaq 100 Performance Drivers
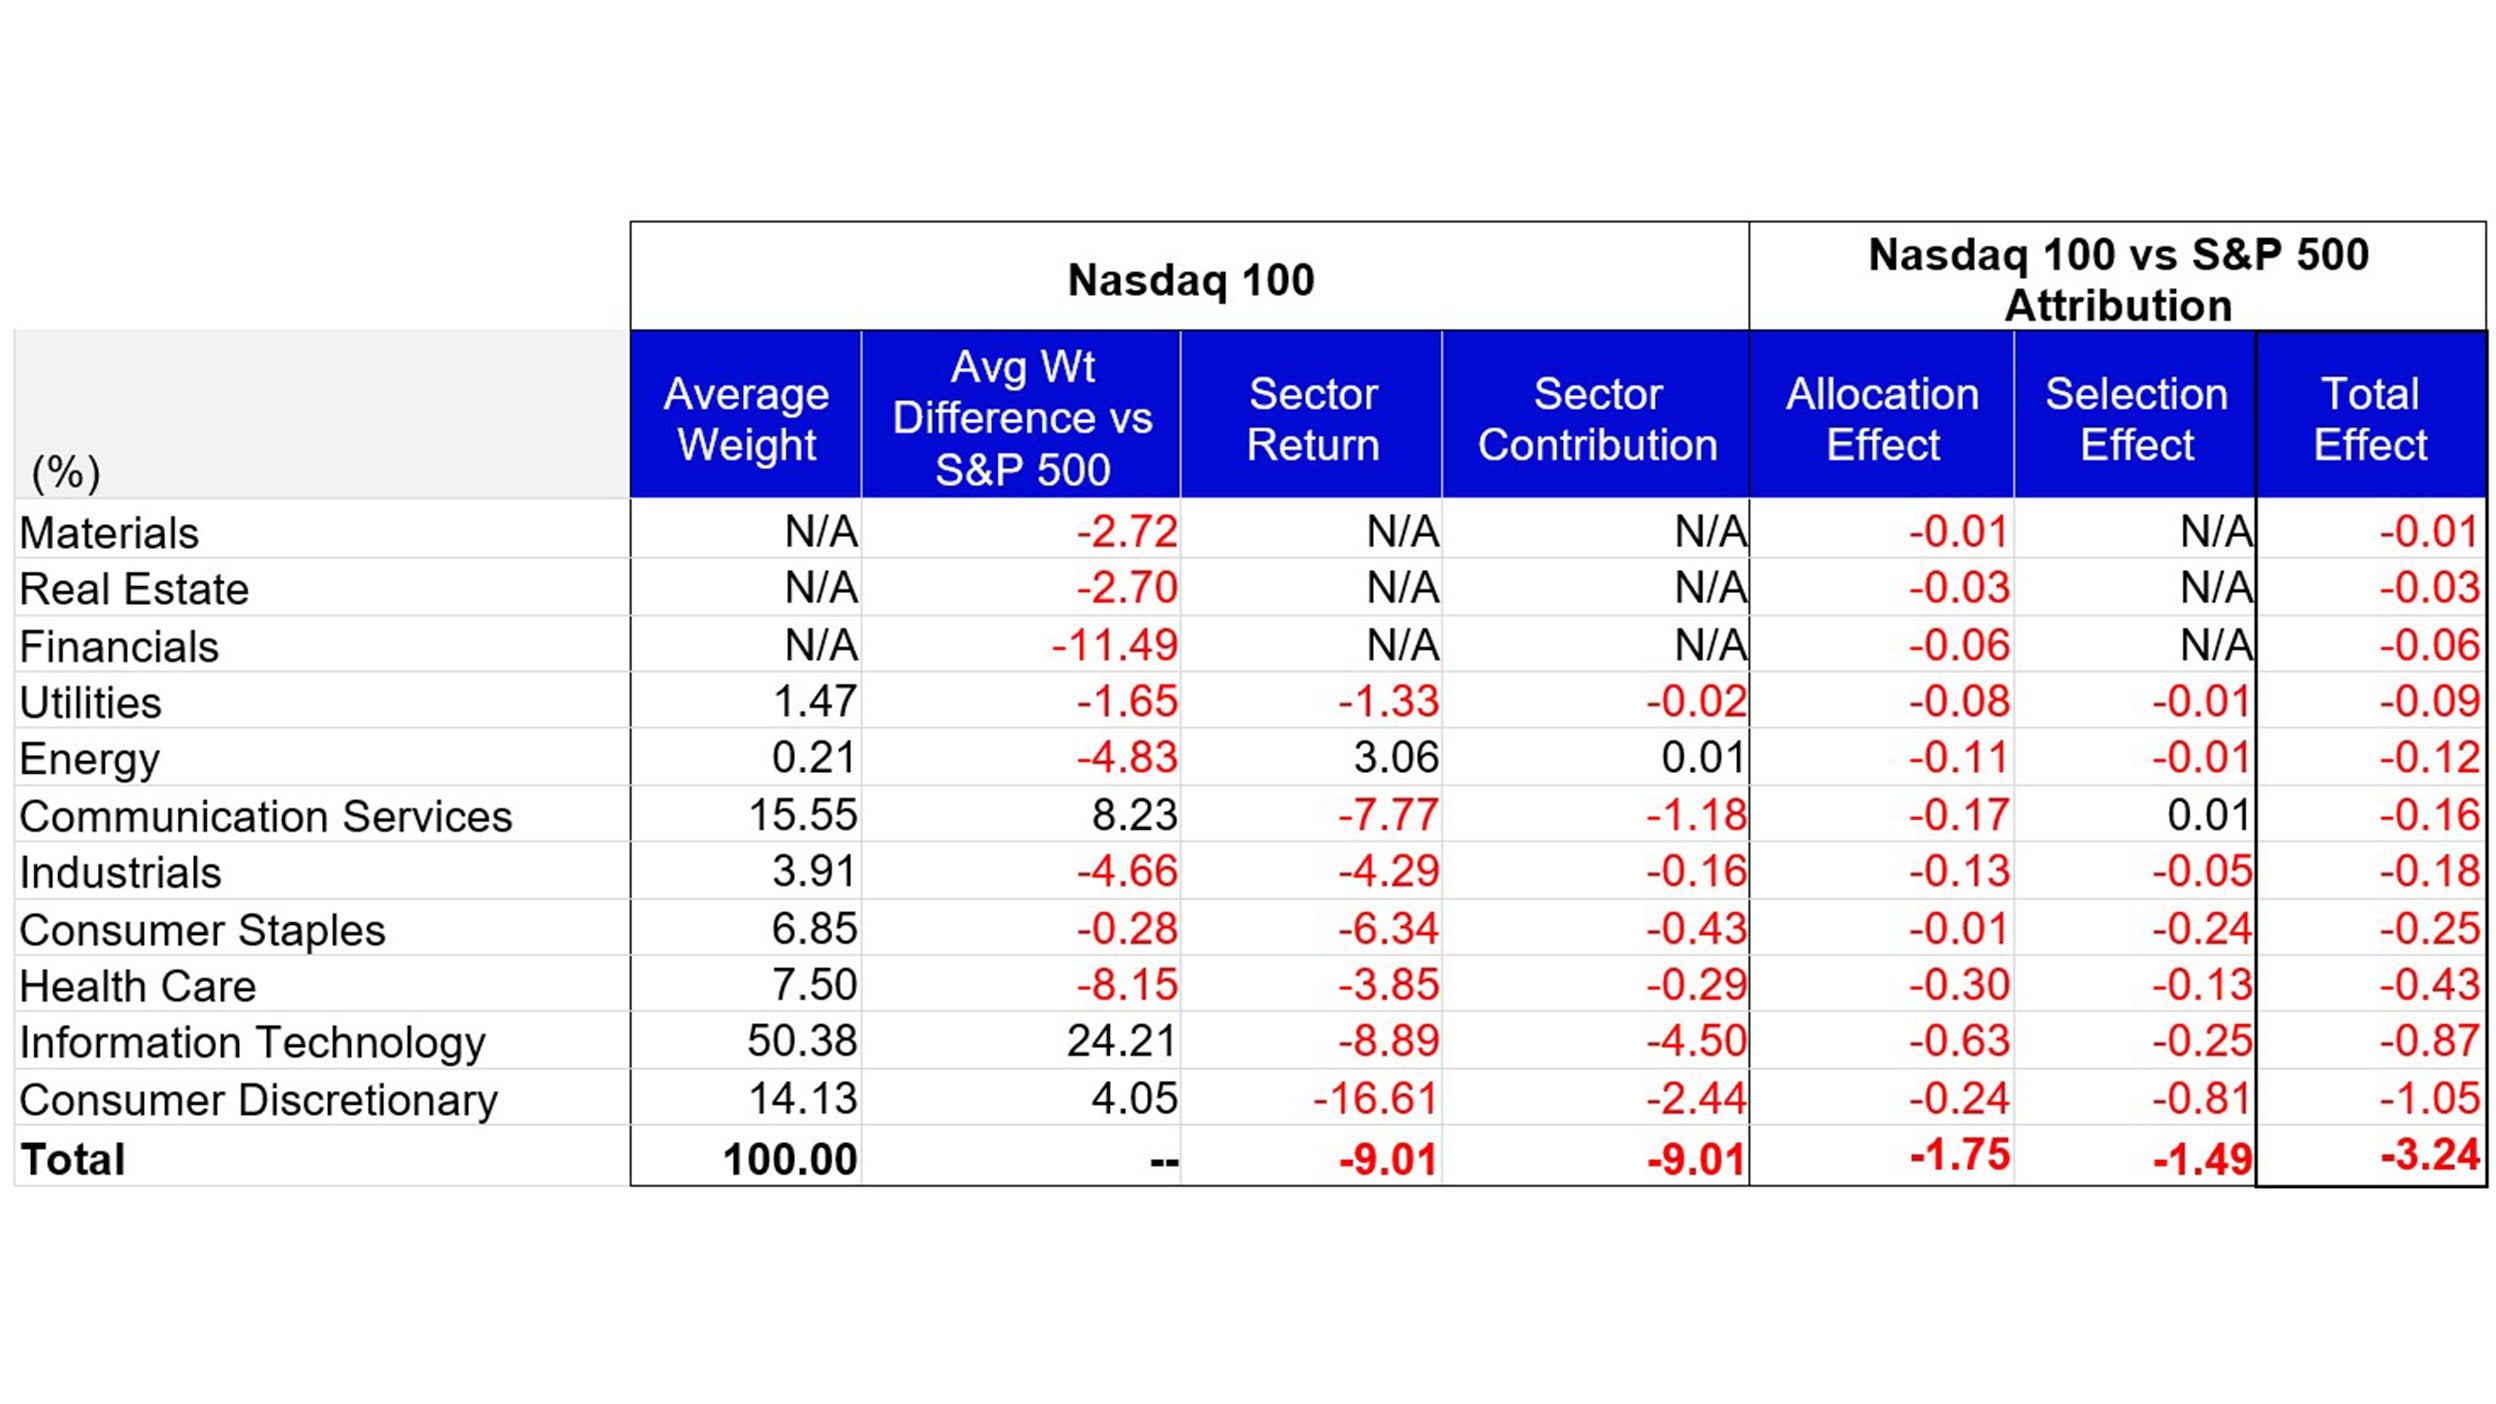
December performance attribution of the Nasdaq 100 vs the S&P 500 Index
For the month of December, the Nasdaq 100 Index returned -9.0%, underperforming the S&P 500 Index, which returned -5.8%. Consumer discretionary, Information Technology, and Communication services were NDX’s worst performing sectors and returned -16.6%, -8.9% and -7.8%, respectively. The Energy sector was the only positive contributor to performance with a return of 3.1%.
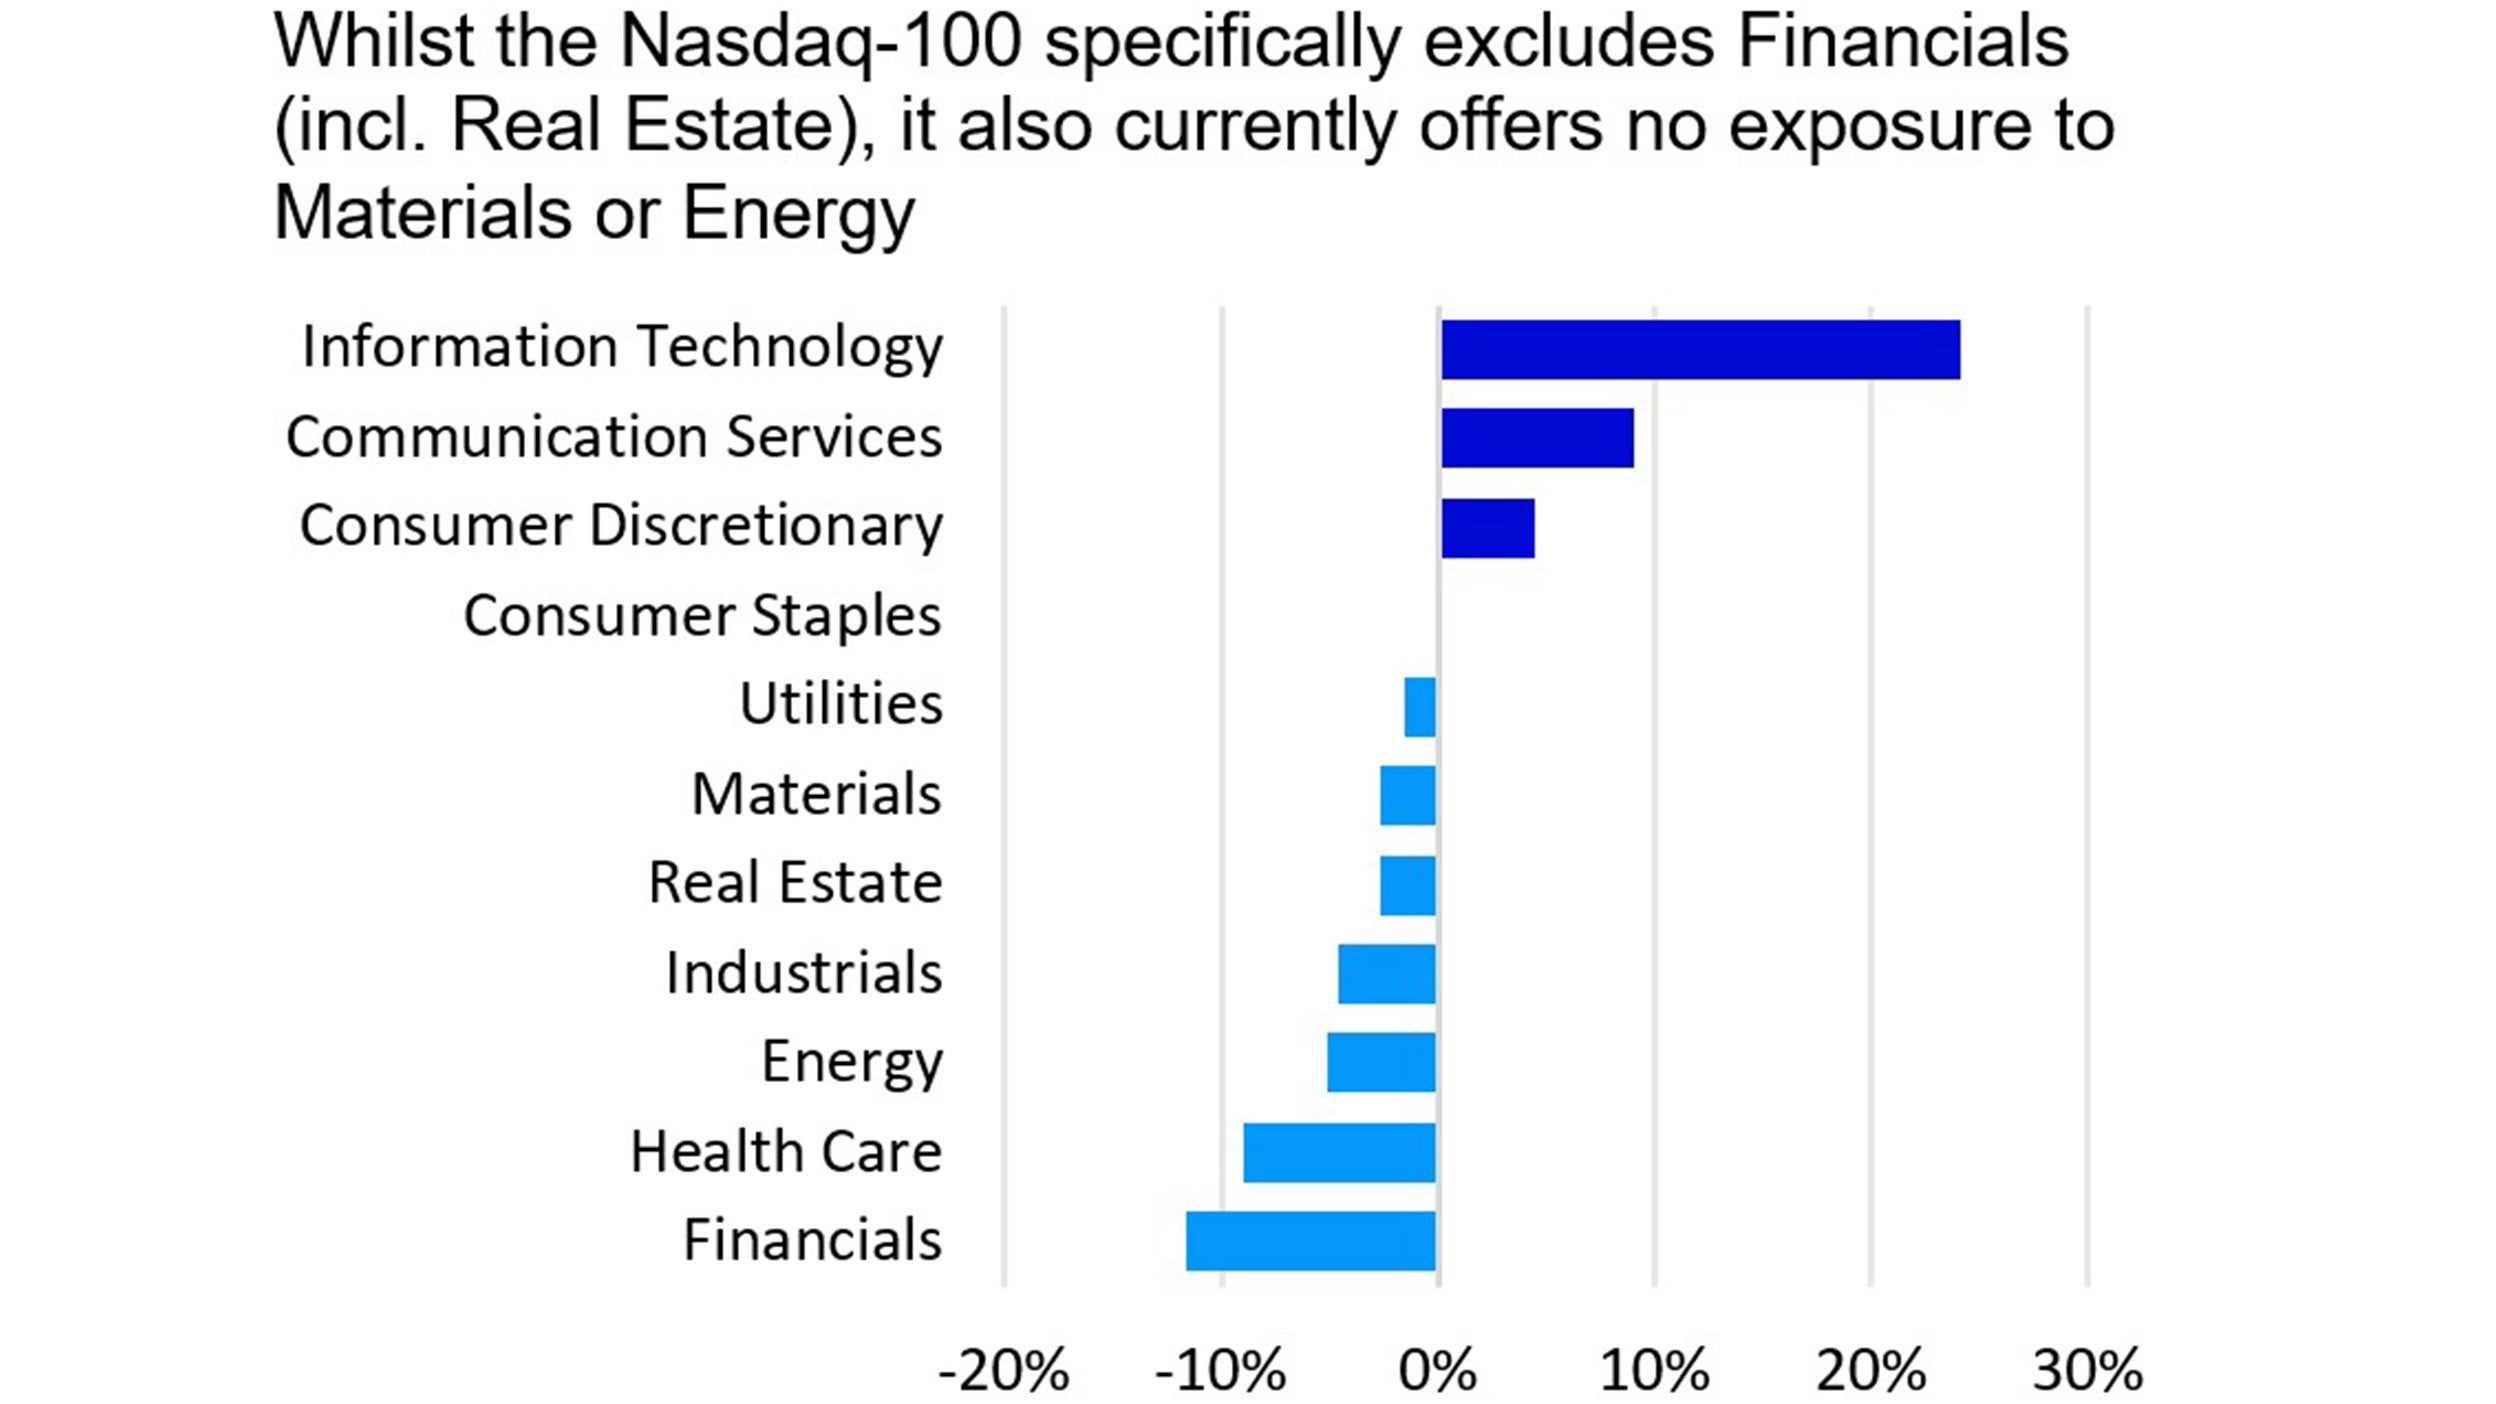
NDX’s underperformance vs. the S&P 500 was largely driven by its overweight exposure and differentiated holdings in the Consumer Discretionary and Information Technology sectors. Lack of exposure to Materials, Real Estate and Financials also detracted from the index’s relative performance vs. the S&P 500.

Data: Invesco, FactSet, as of 30 Dec 2022 Data in USD.

Source: Bloomberg, as of 30 Dec 2022. Past performance does not predict future returns. Top and bottom performers for the month by relative performance.

Past performance does not predict future returns
Data: Invesco, Bloomberg, as of 30 Dec 2022. Data in USD. Returns may increase or decrease as a result of currency fluctuations. An investment cannot be made directly into an index.
Investment Risks
The value of investments and any income will fluctuate (this may partly be the result of exchange rate fluctuations) and investors may not get back the full amount invested.


