Private markets for Asian investors: Income

This is the second of a four-part blog series on integrating private markets into Asian investor portfolios, while accounting for FX risk. The first blog in our series set the scene in terms of opportunities and challenges for Asian investors. This blog will focus on private income investments. Subsequent blogs will analyze private growth and real return opportunities with a similar lens.
As we continue the discussion on private markets for Asian investors, for this analysis we’ll focus specifically on income investments. While we’ve discussed private credit in prior pieces, this series is geared toward Asian investors with specific local currency return considerations. Earlier, we analyzed the current global interest rate regime and how that impacts hedging costs, which at this juncture serves as an impediment for many non-USD investors. Given the current macro backdrop, market participants have begun to shift their expectations with respect to the pathway for Fed rate cuts. As of the date of writing, there is a greater than 90% chance of zero to two rate cuts by December1, a much more conservative estimate than what the market expected earlier in the year. This suggests rate differentials and subsequent hedging costs will remain “higher for longer”, a frequently echoed phrase but with a slightly different contextual backdrop in this instance.
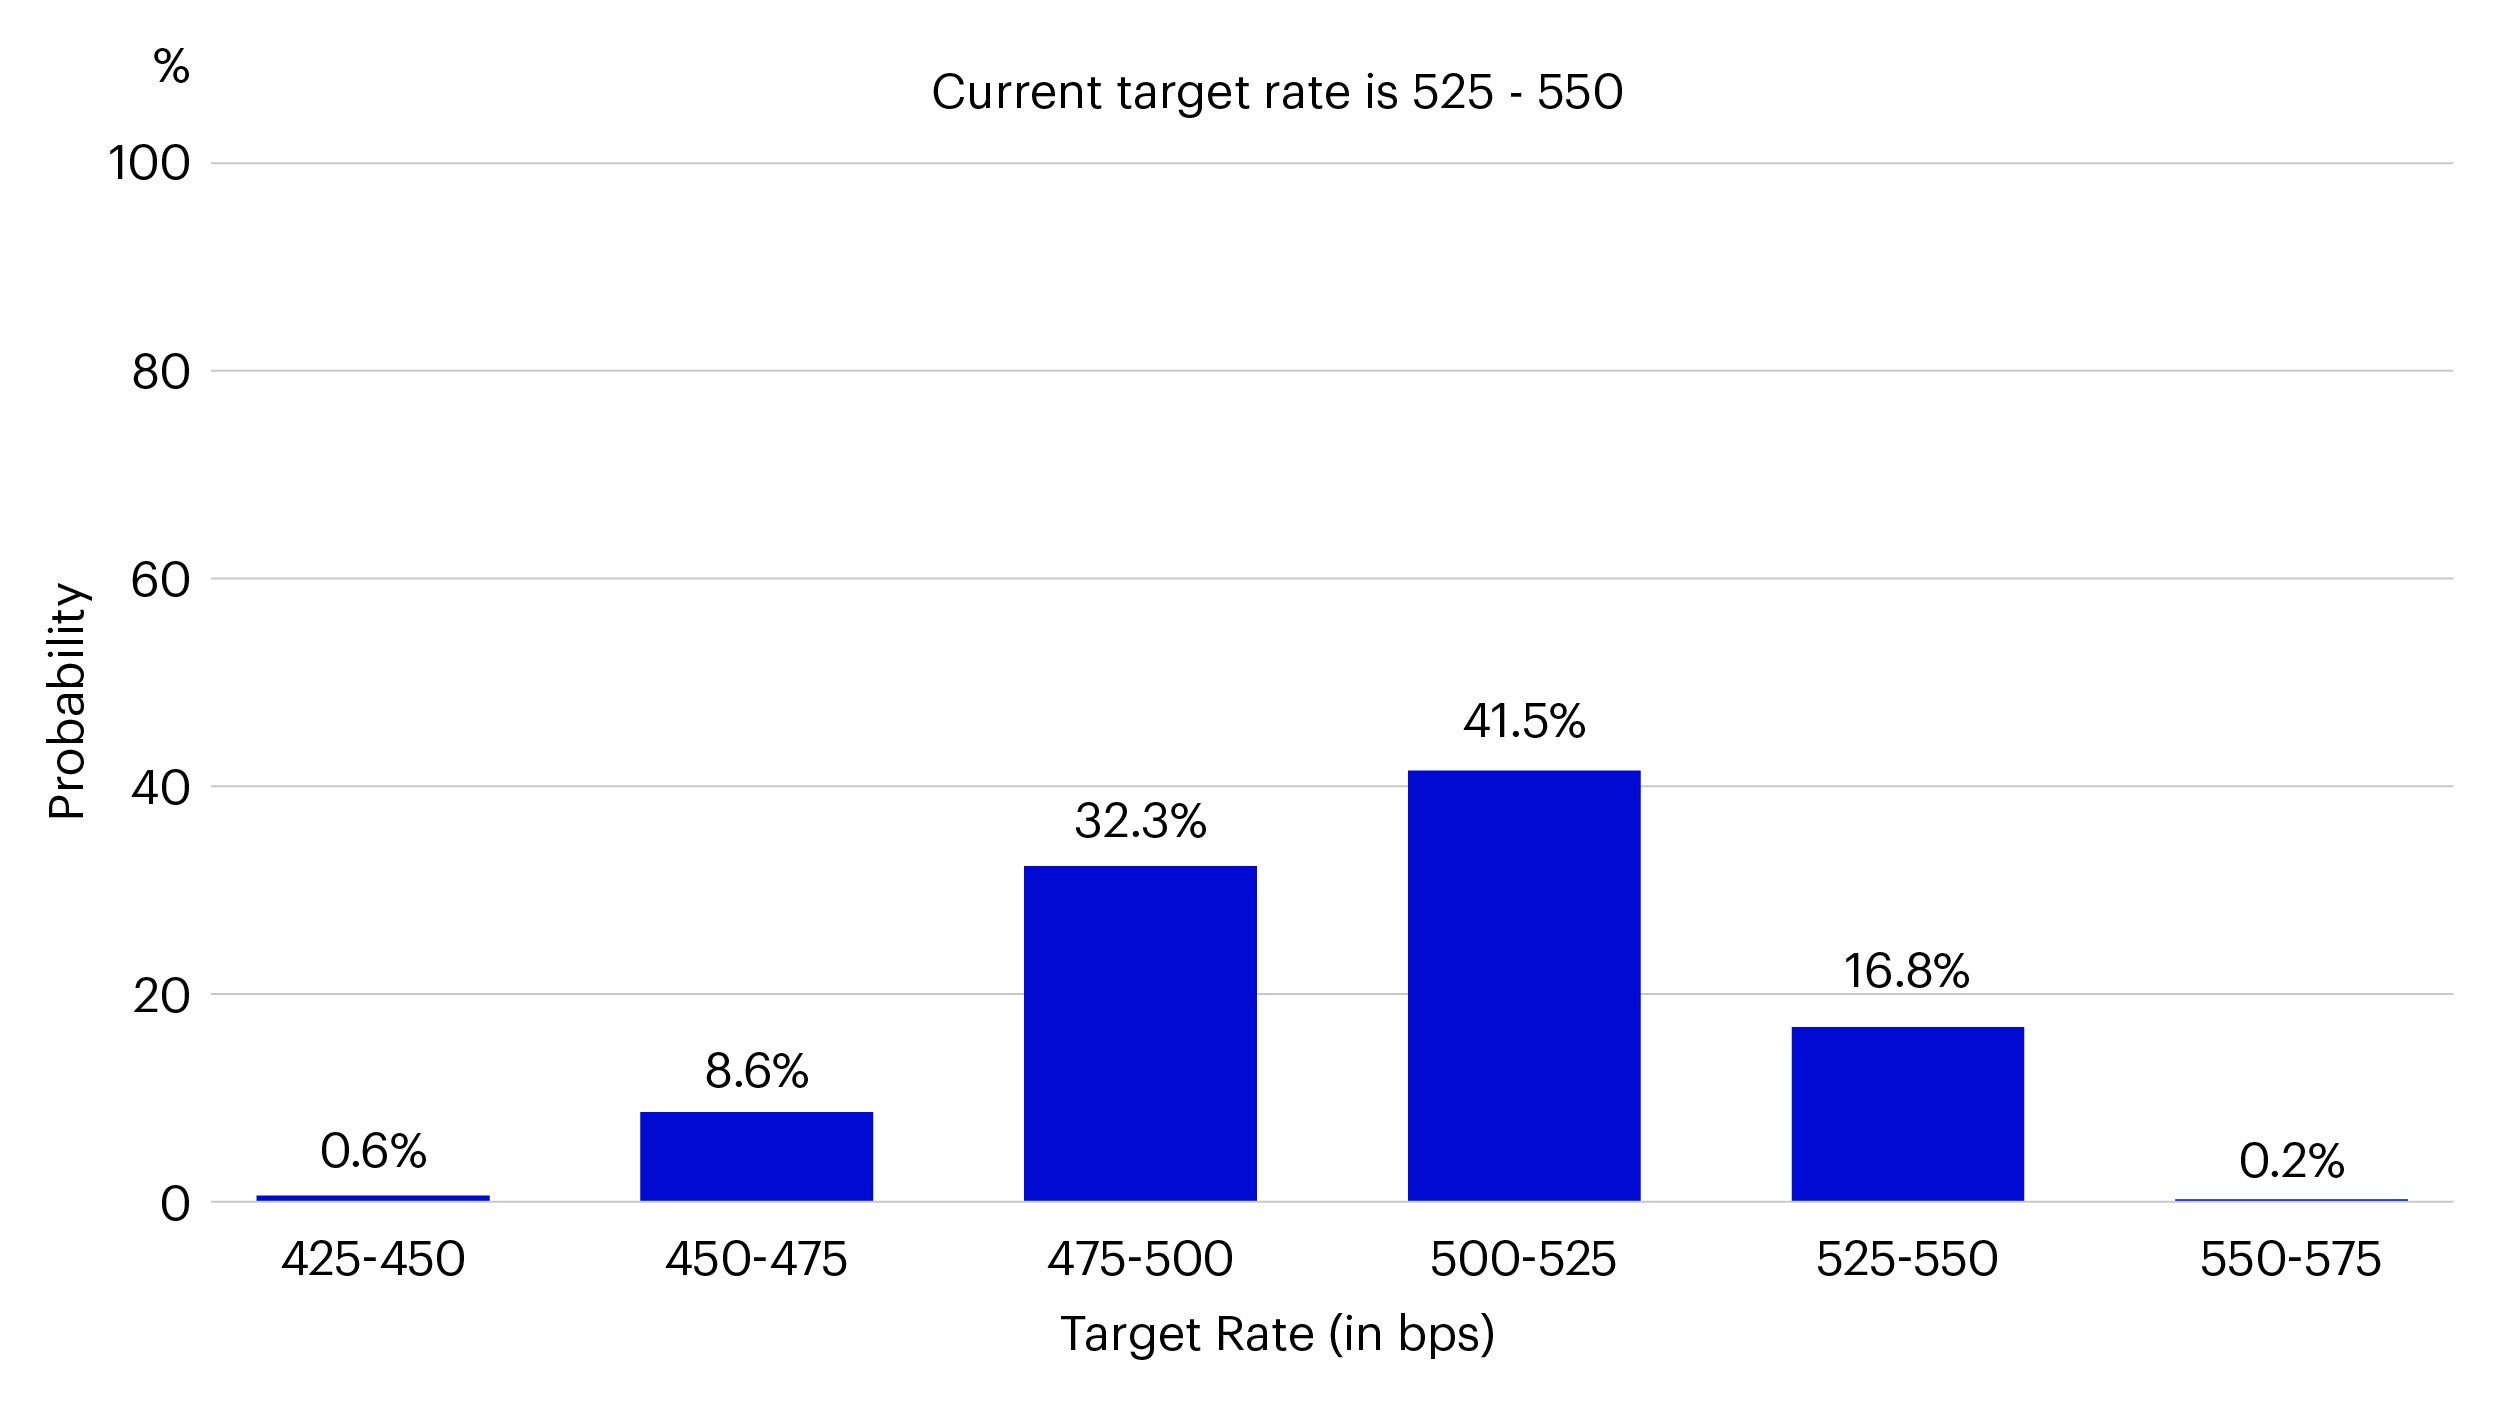
Source: CME Group, data as of 28 May 2024.
This is ultimately due to the continued resilience of the US economy and inflationary trends, and therefore could be argued a positive for many USD investors, especially those with exposure to equities and credit-sensitive assets such as private credit. However, this puts many central banks, especially those in Asia, in somewhat of a bind. Rate cuts that might be necessary to spur economic activity could further exacerbate currency valuation issues, and so leave many Asian central banks anchored to Fed policy. This implies that the current situation with hedging costs will remain in place, and potentially even exacerbate in the near to intermediate future.
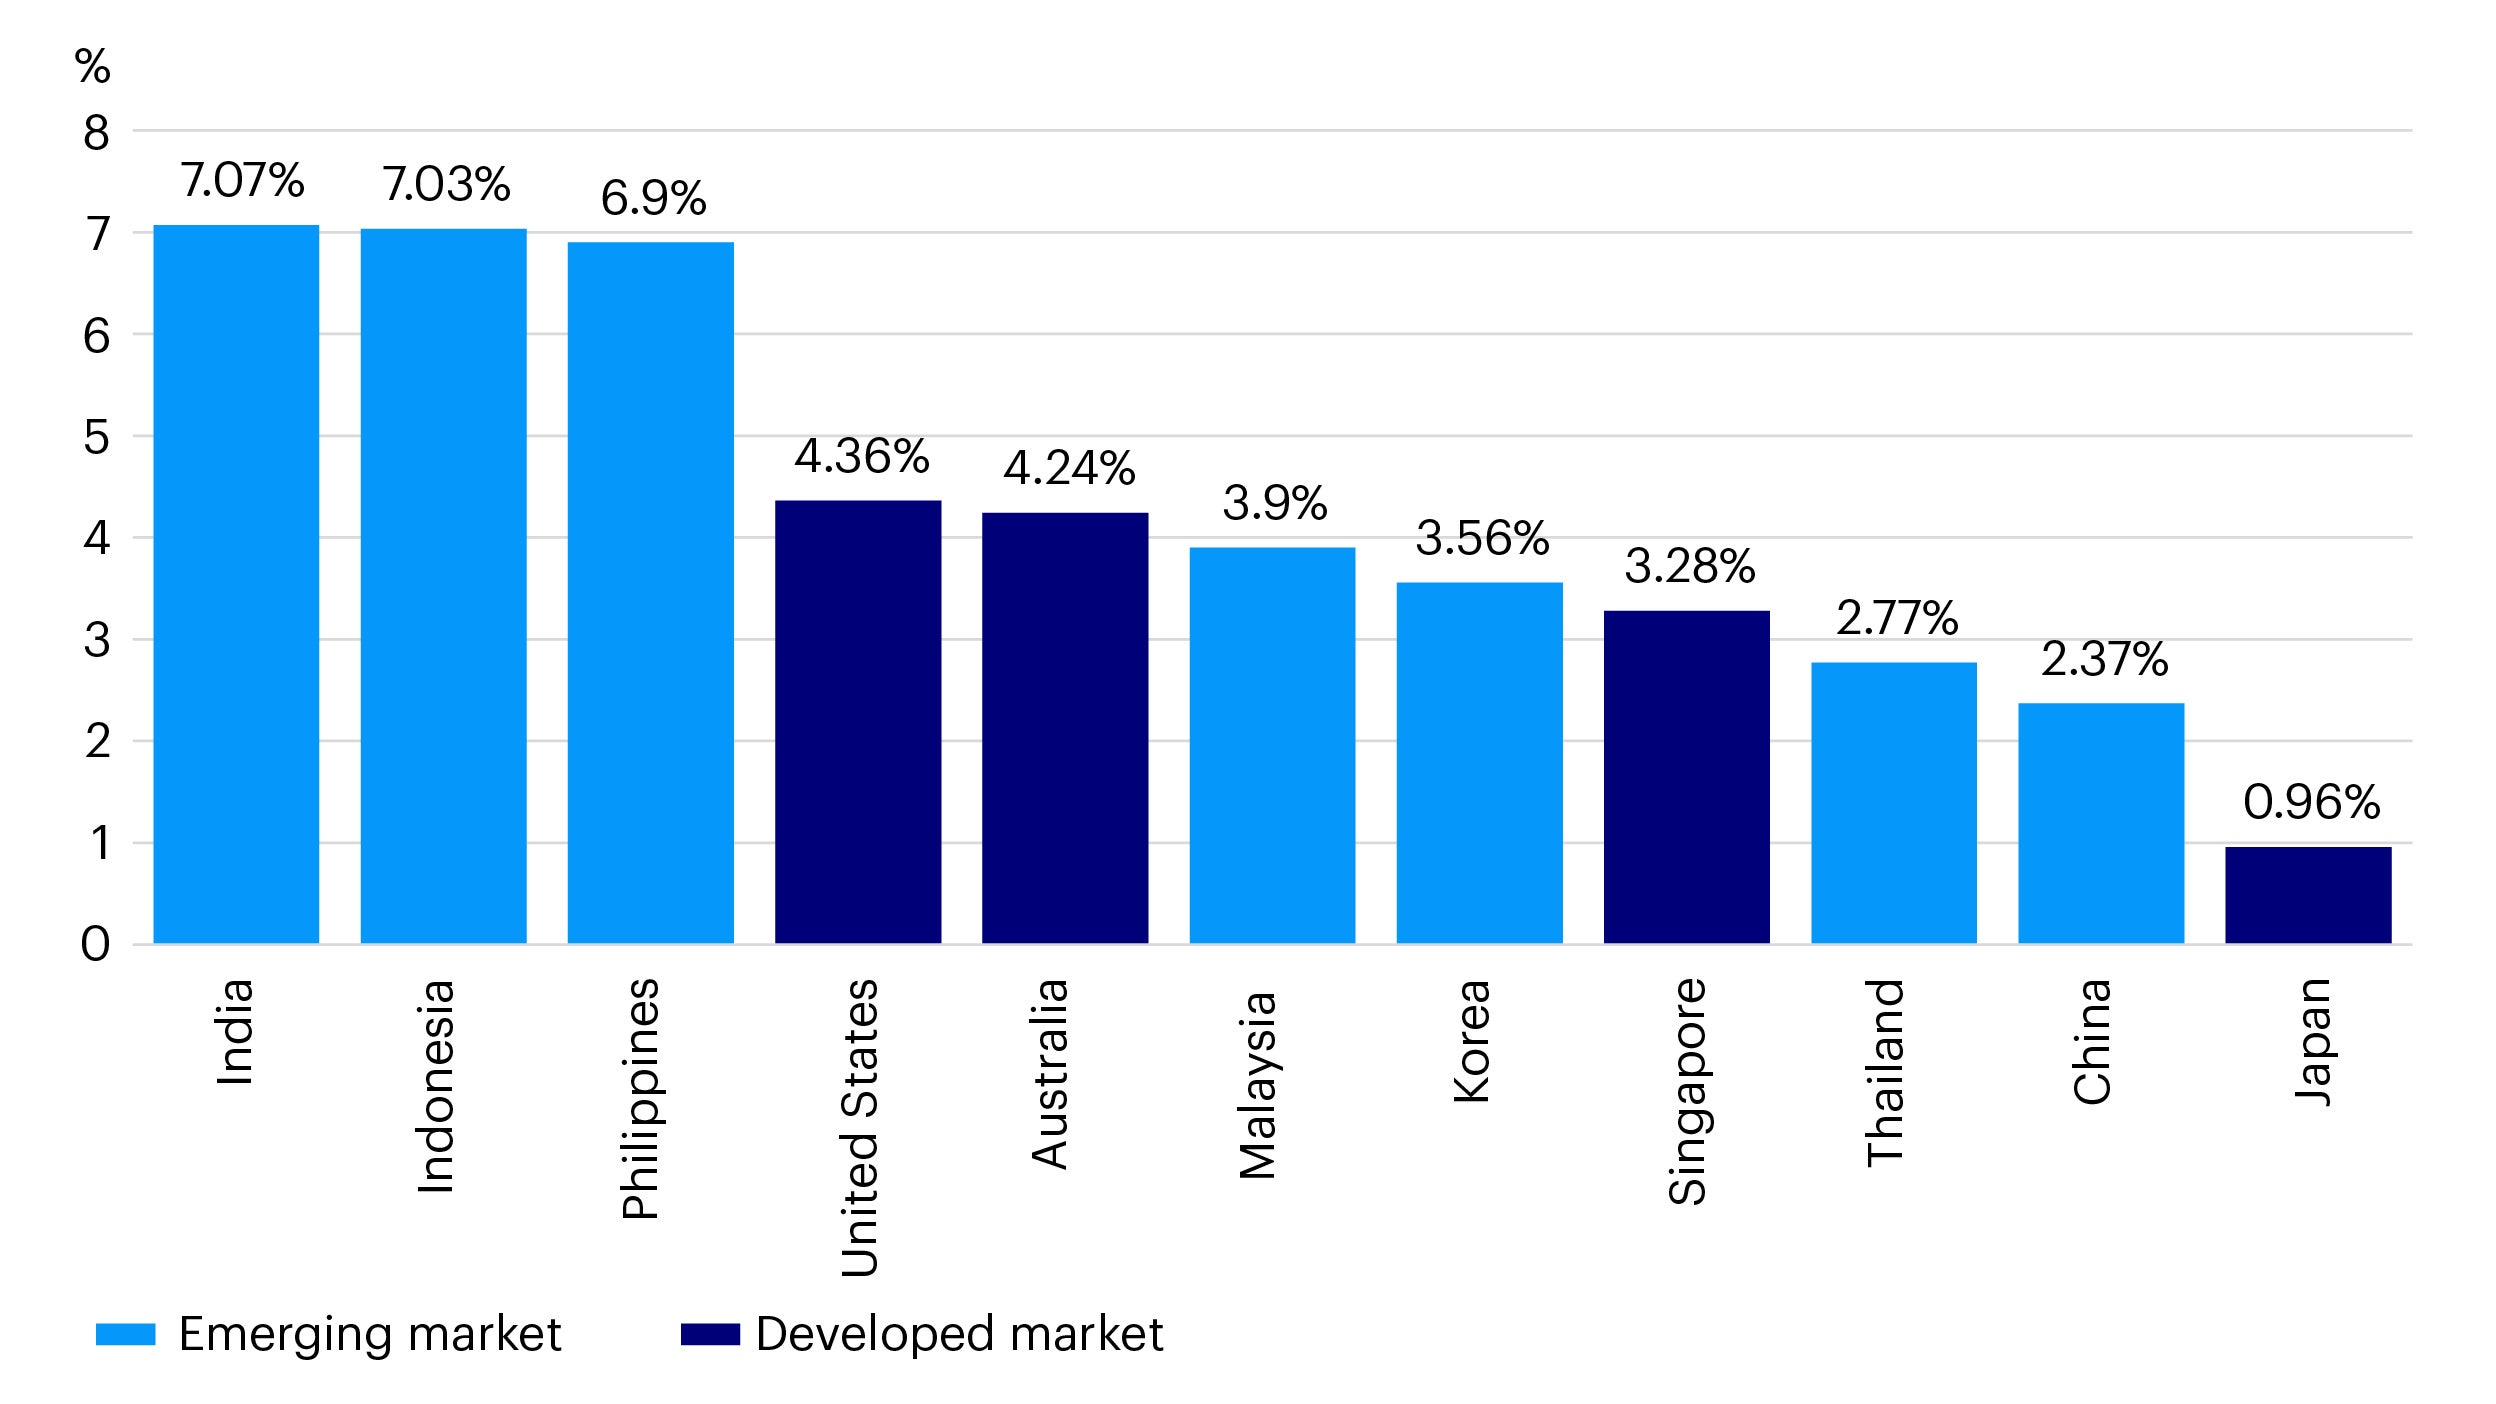
Source: Bloomberg, data as of 16 May 2024. Past performance does not guarantee future results.
Currency hedging costs typically impact fixed income allocations to a greater degree than equity allocations, as investors often choose to let the latter go unhedged. As such we will dive into a sample bond allocation and explore the various trade-offs that occur when looking at this portfolio through a local currency lens. For this exercise, we’ll assume the investor has a base currency of Thai Baht (in our previous analysis we chose Korean Won, but we’ll explore multiple currencies in this series to demonstrate the efficacy of this analysis across geographies).
Let’s consider a baseline fixed income portfolio with the following allocation:

We’ll now analyze this allocation through the Invesco Vision tool, which should help us to formulate an efficient frontier analysis. For comparison’s sake, we’ll contrast USD and THB-denominated frontiers to demonstrate the impact of currency hedging and associated local return reduction. Since the exercise is focused on public and private credit, we’ll home in on the expected yields of each portfolio and construct an efficient frontier accordingly.
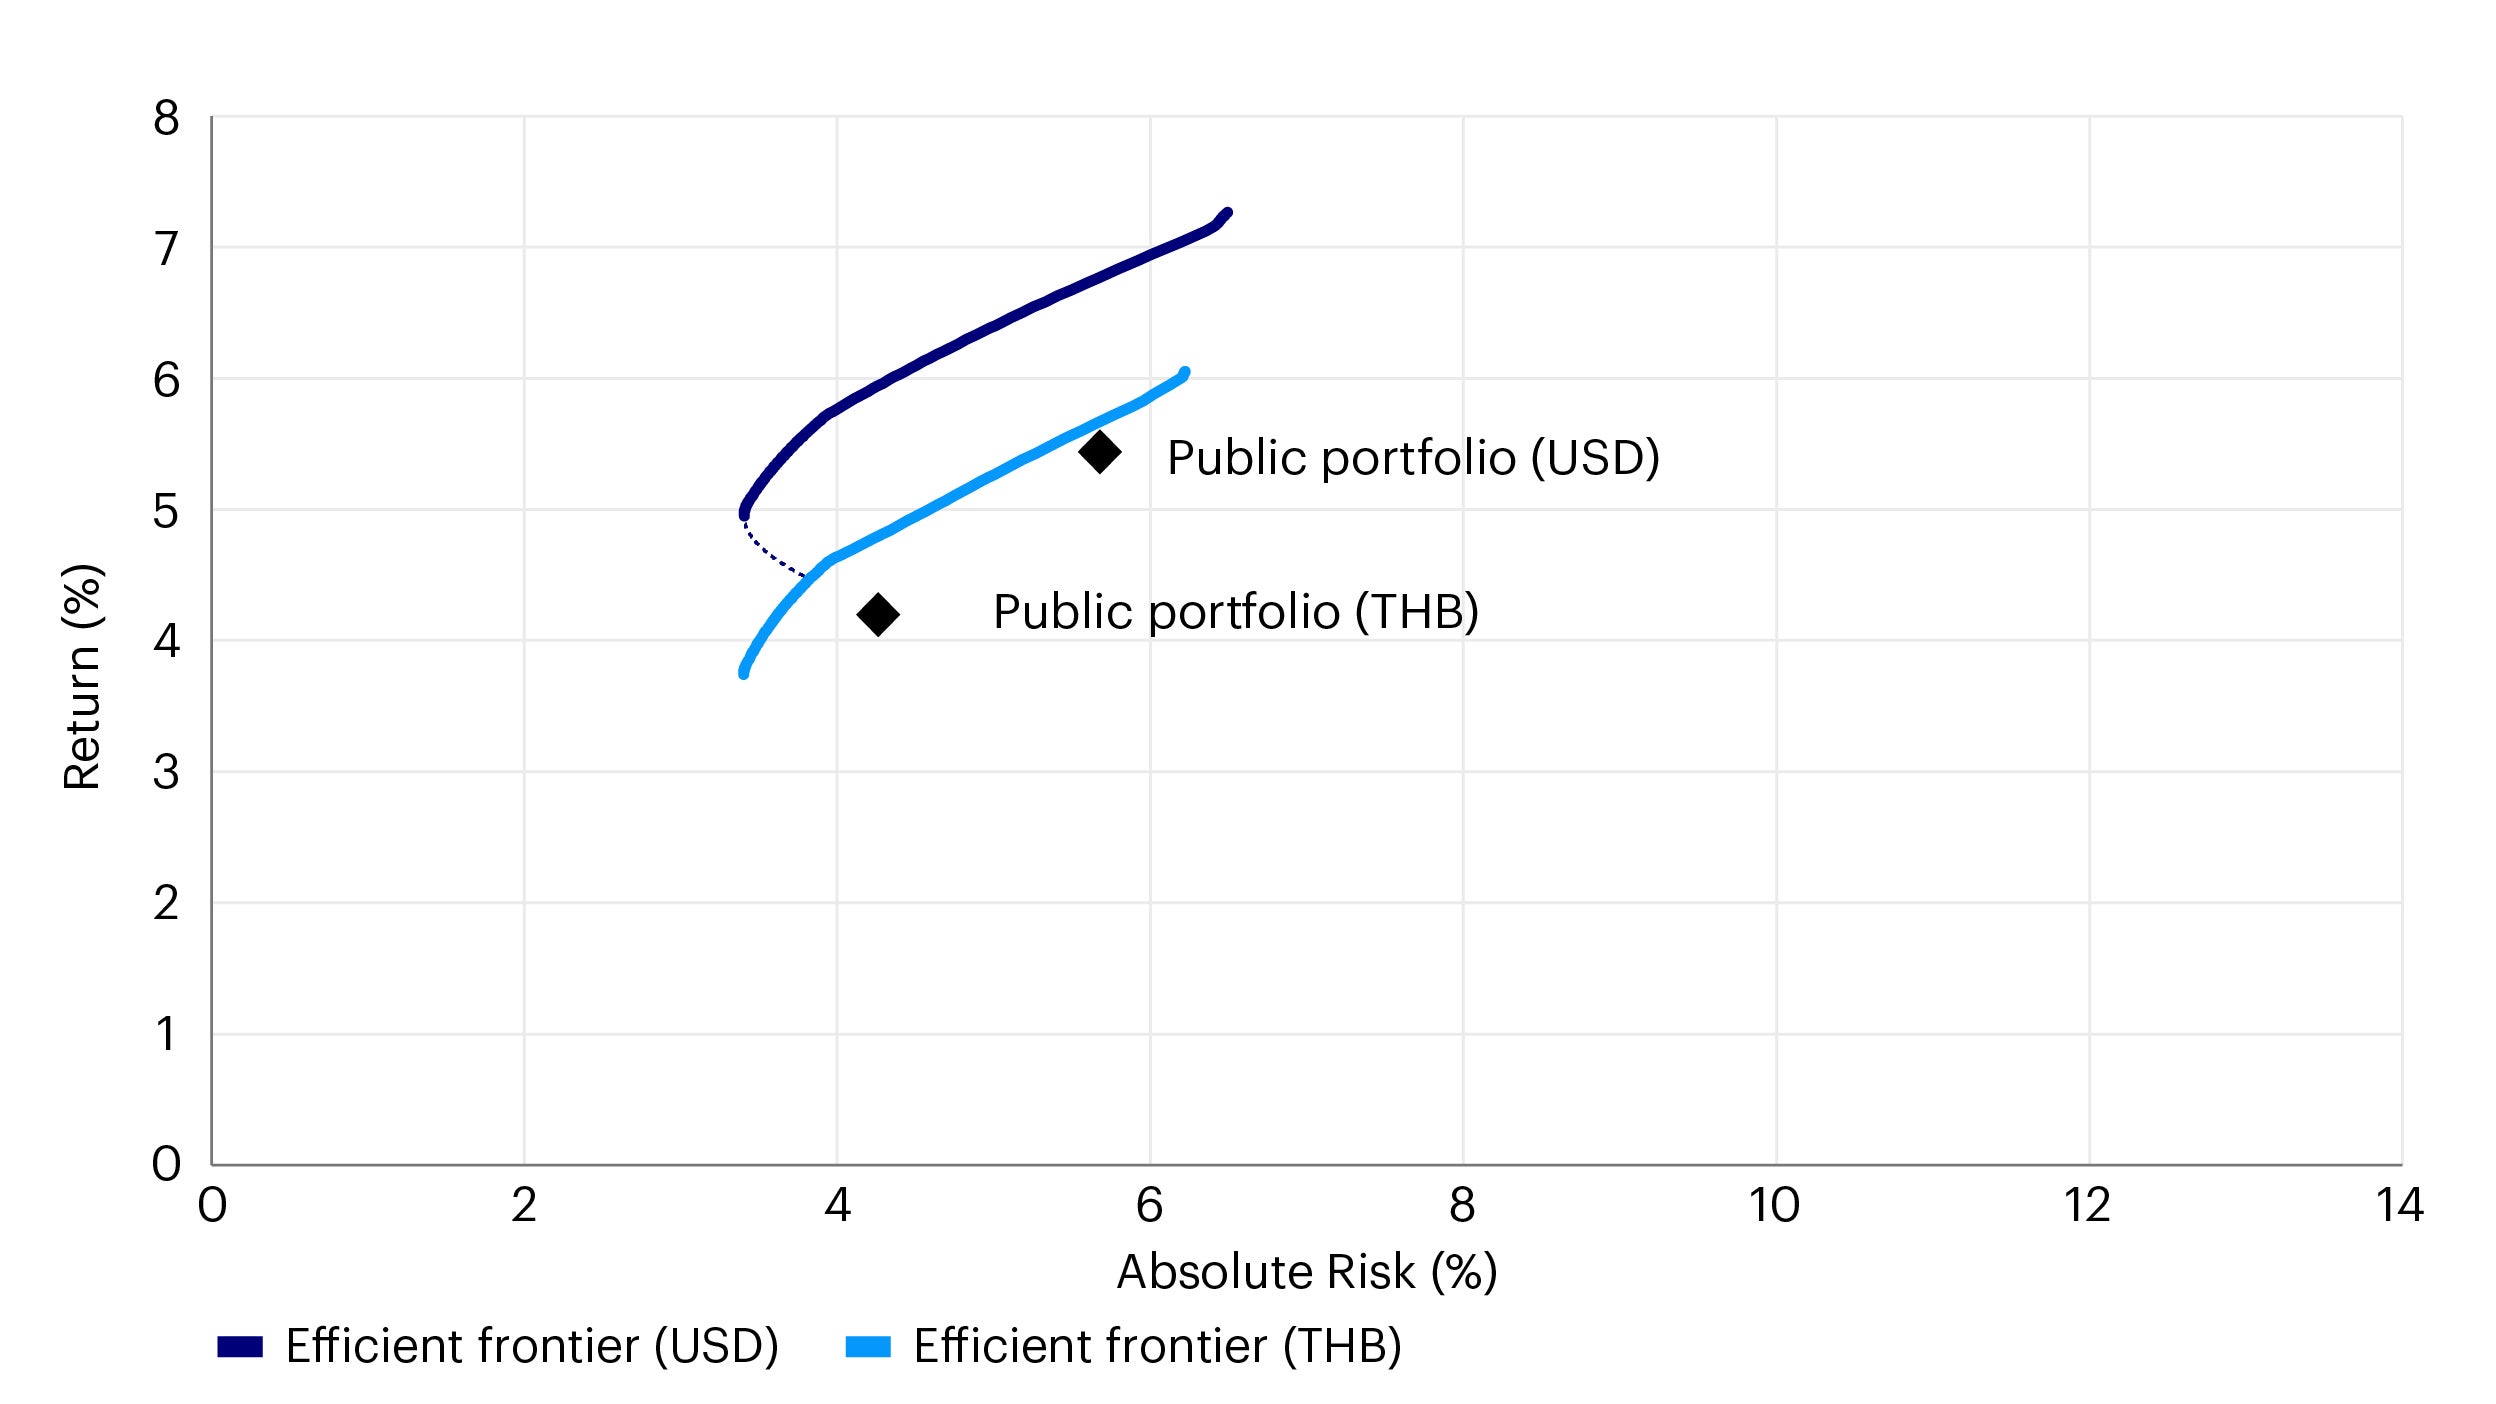
Source: Invesco Vision, data as of 31 March 2024. Return estimates are based on the 2024 Long-Term Capital Market Assumptions. These estimates are forward-looking, are not guarantees, and they involve risks, uncertainties, and assumptions. Note: Proxies are as follows: Global Aggregate Bonds - Bloomberg Global Aggregate, Global Corporates - Bloomberg Global Corporate, Global High Yield - Bloomberg Global High Yield, Emerging Market Debt - Bloomberg Emerging Market Debt, Leveraged Loans - Credit Suisse Leveraged Loan, Thailand Bonds - ICE BofA Thailand Government.
When we look at the portfolio return and risk assumptions leveraging Invesco Solutions long-term capital market assumptions, we see a meaningful yield reduction when converting from USD to THB.

For illustrative purposes only. There can be no assurance that any estimated returns or projections can be realized.
This local currency yield impairment of 140 basis points, brought about by interest rate differentials and hedging costs, creates an unfavorable outcome for fixed income investors concerned with local currency returns. Given the prevailing interest rate environment, we believe these investors need to consider additional asset classes to adjust for these adverse conditions to continue to optimize for their core investment outcomes.
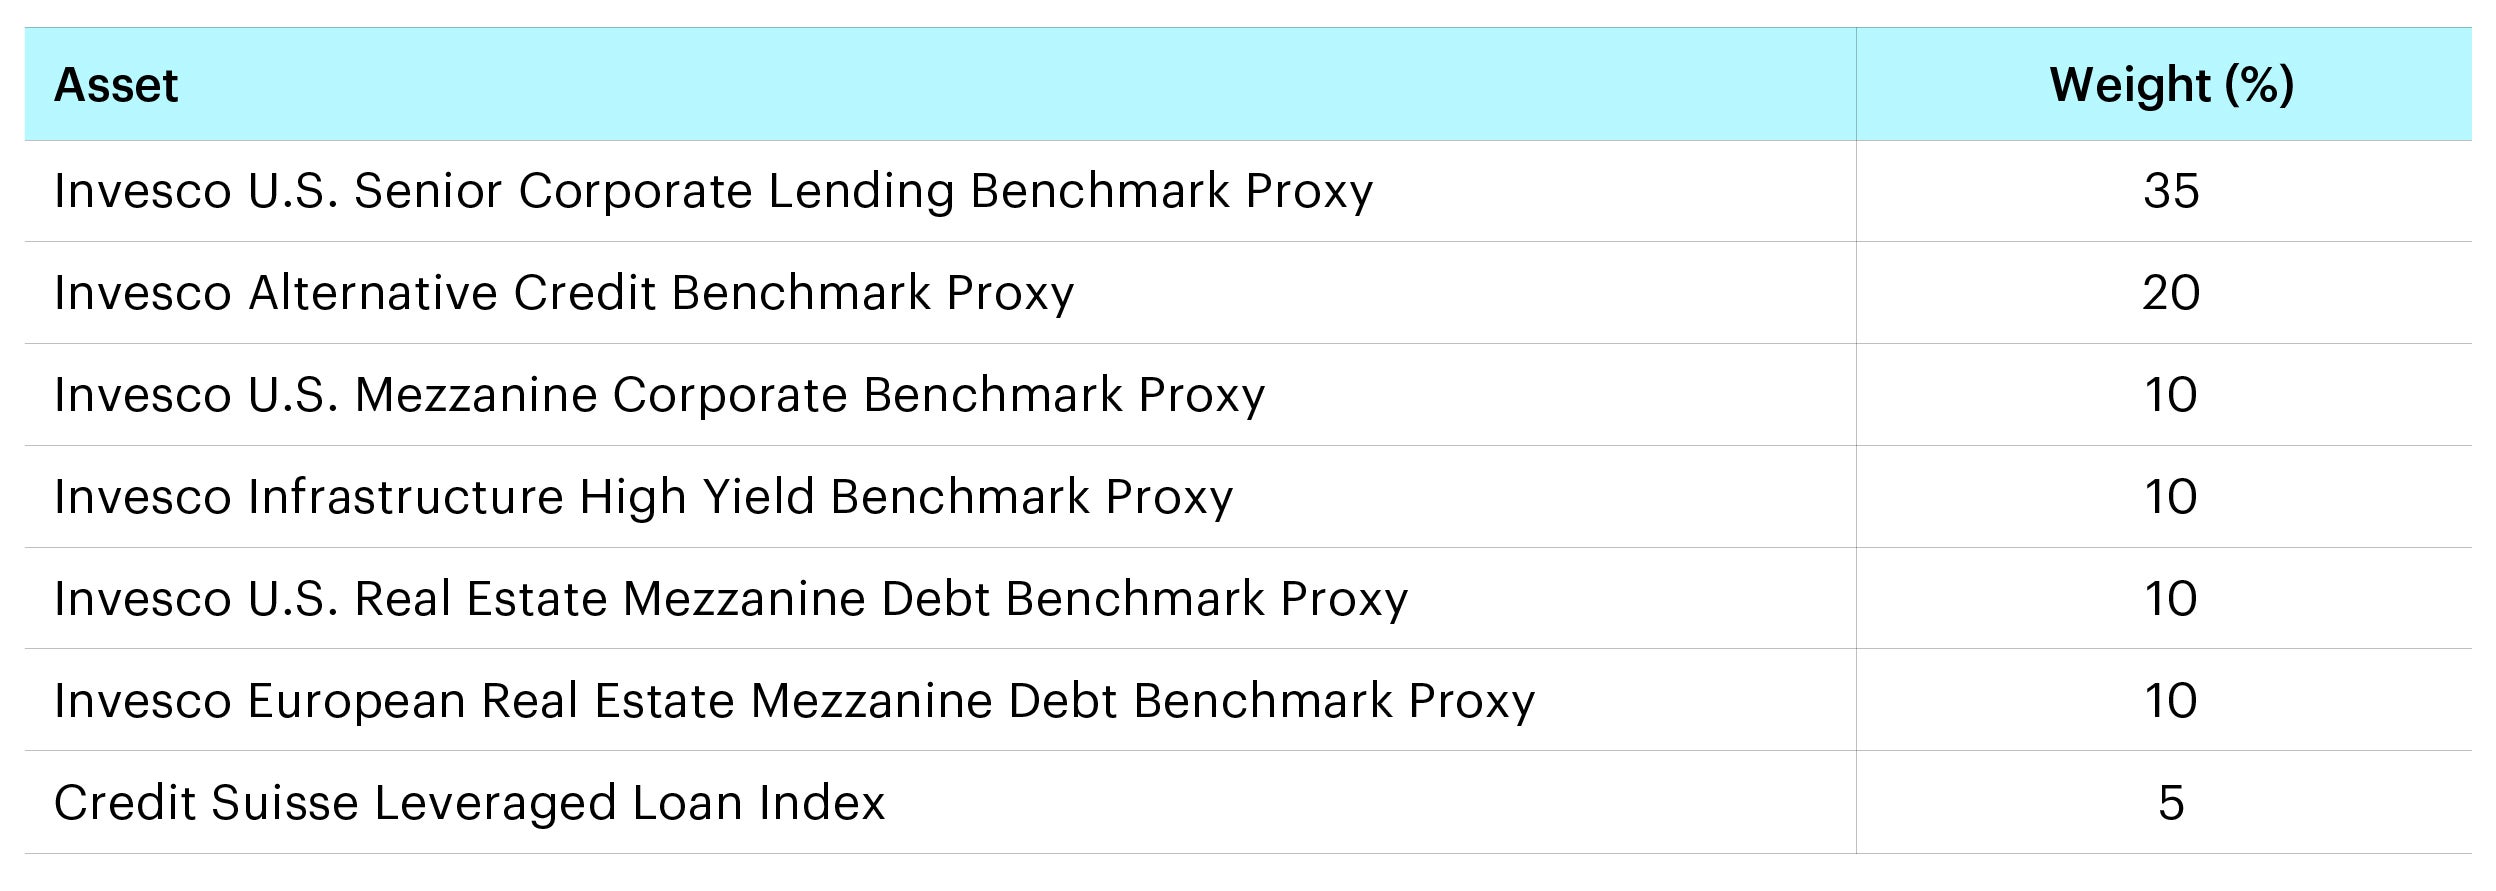
Considering this, we have created a new portfolio with a 30% allocation to diversified private markets income. The portfolio has been constructed as follows:
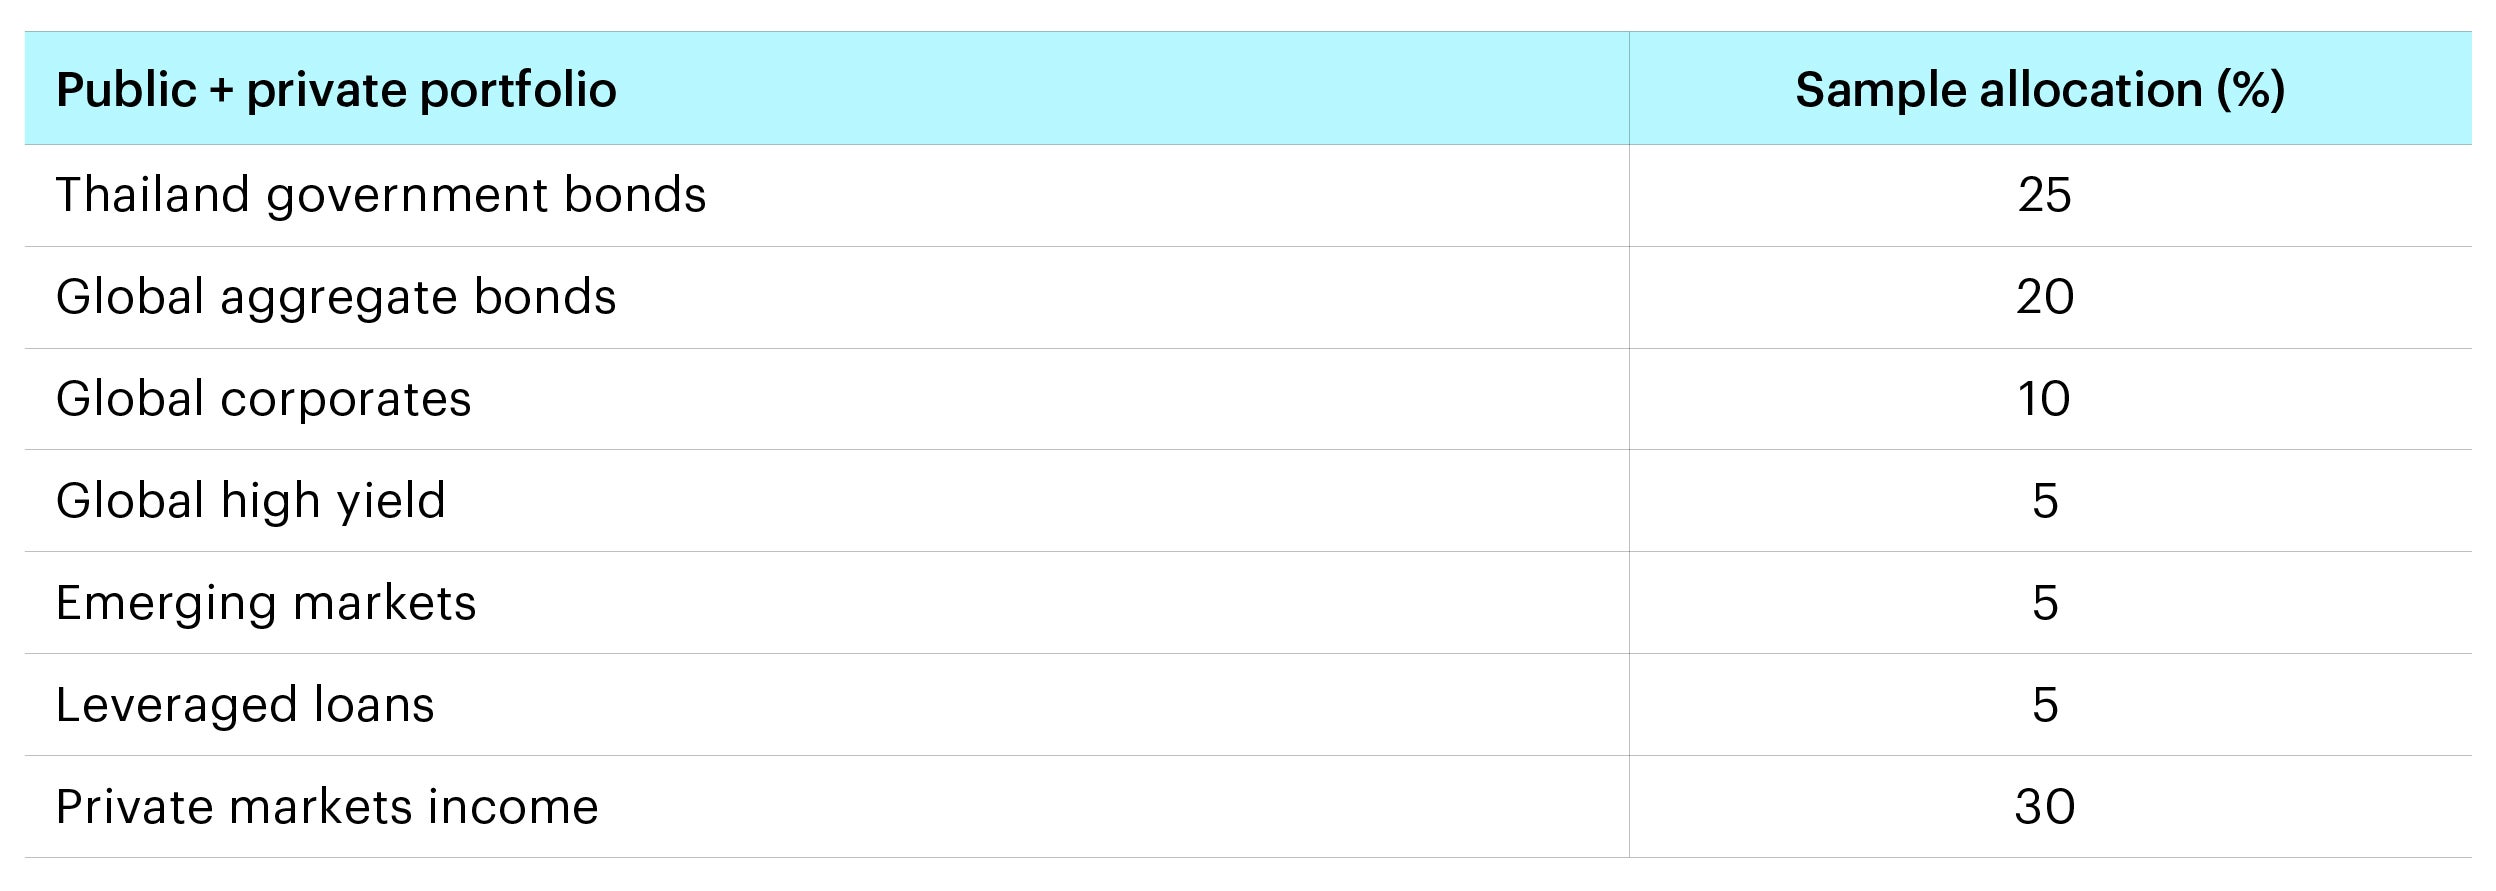
Source: Invesco Vision, data as of 31 March 2024. Return estimates are based on the 2024 Long-Term Capital Market Assumptions. These estimates are forward-looking, are not guarantees, and they involve risks, uncertainties, and assumptions. Note: Proxies are as follows: Global Aggregate Bonds - Bloomberg Global Aggregate, Global Corporates - Bloomberg Global Corporate, Global High Yield - Bloomberg Global High Yield, Emerging Market Debt - Bloomberg Emerging Market Debt, Leveraged Loans - Credit Suisse Leveraged Loan, Thailand Bonds - ICE BofA Thailand Government.
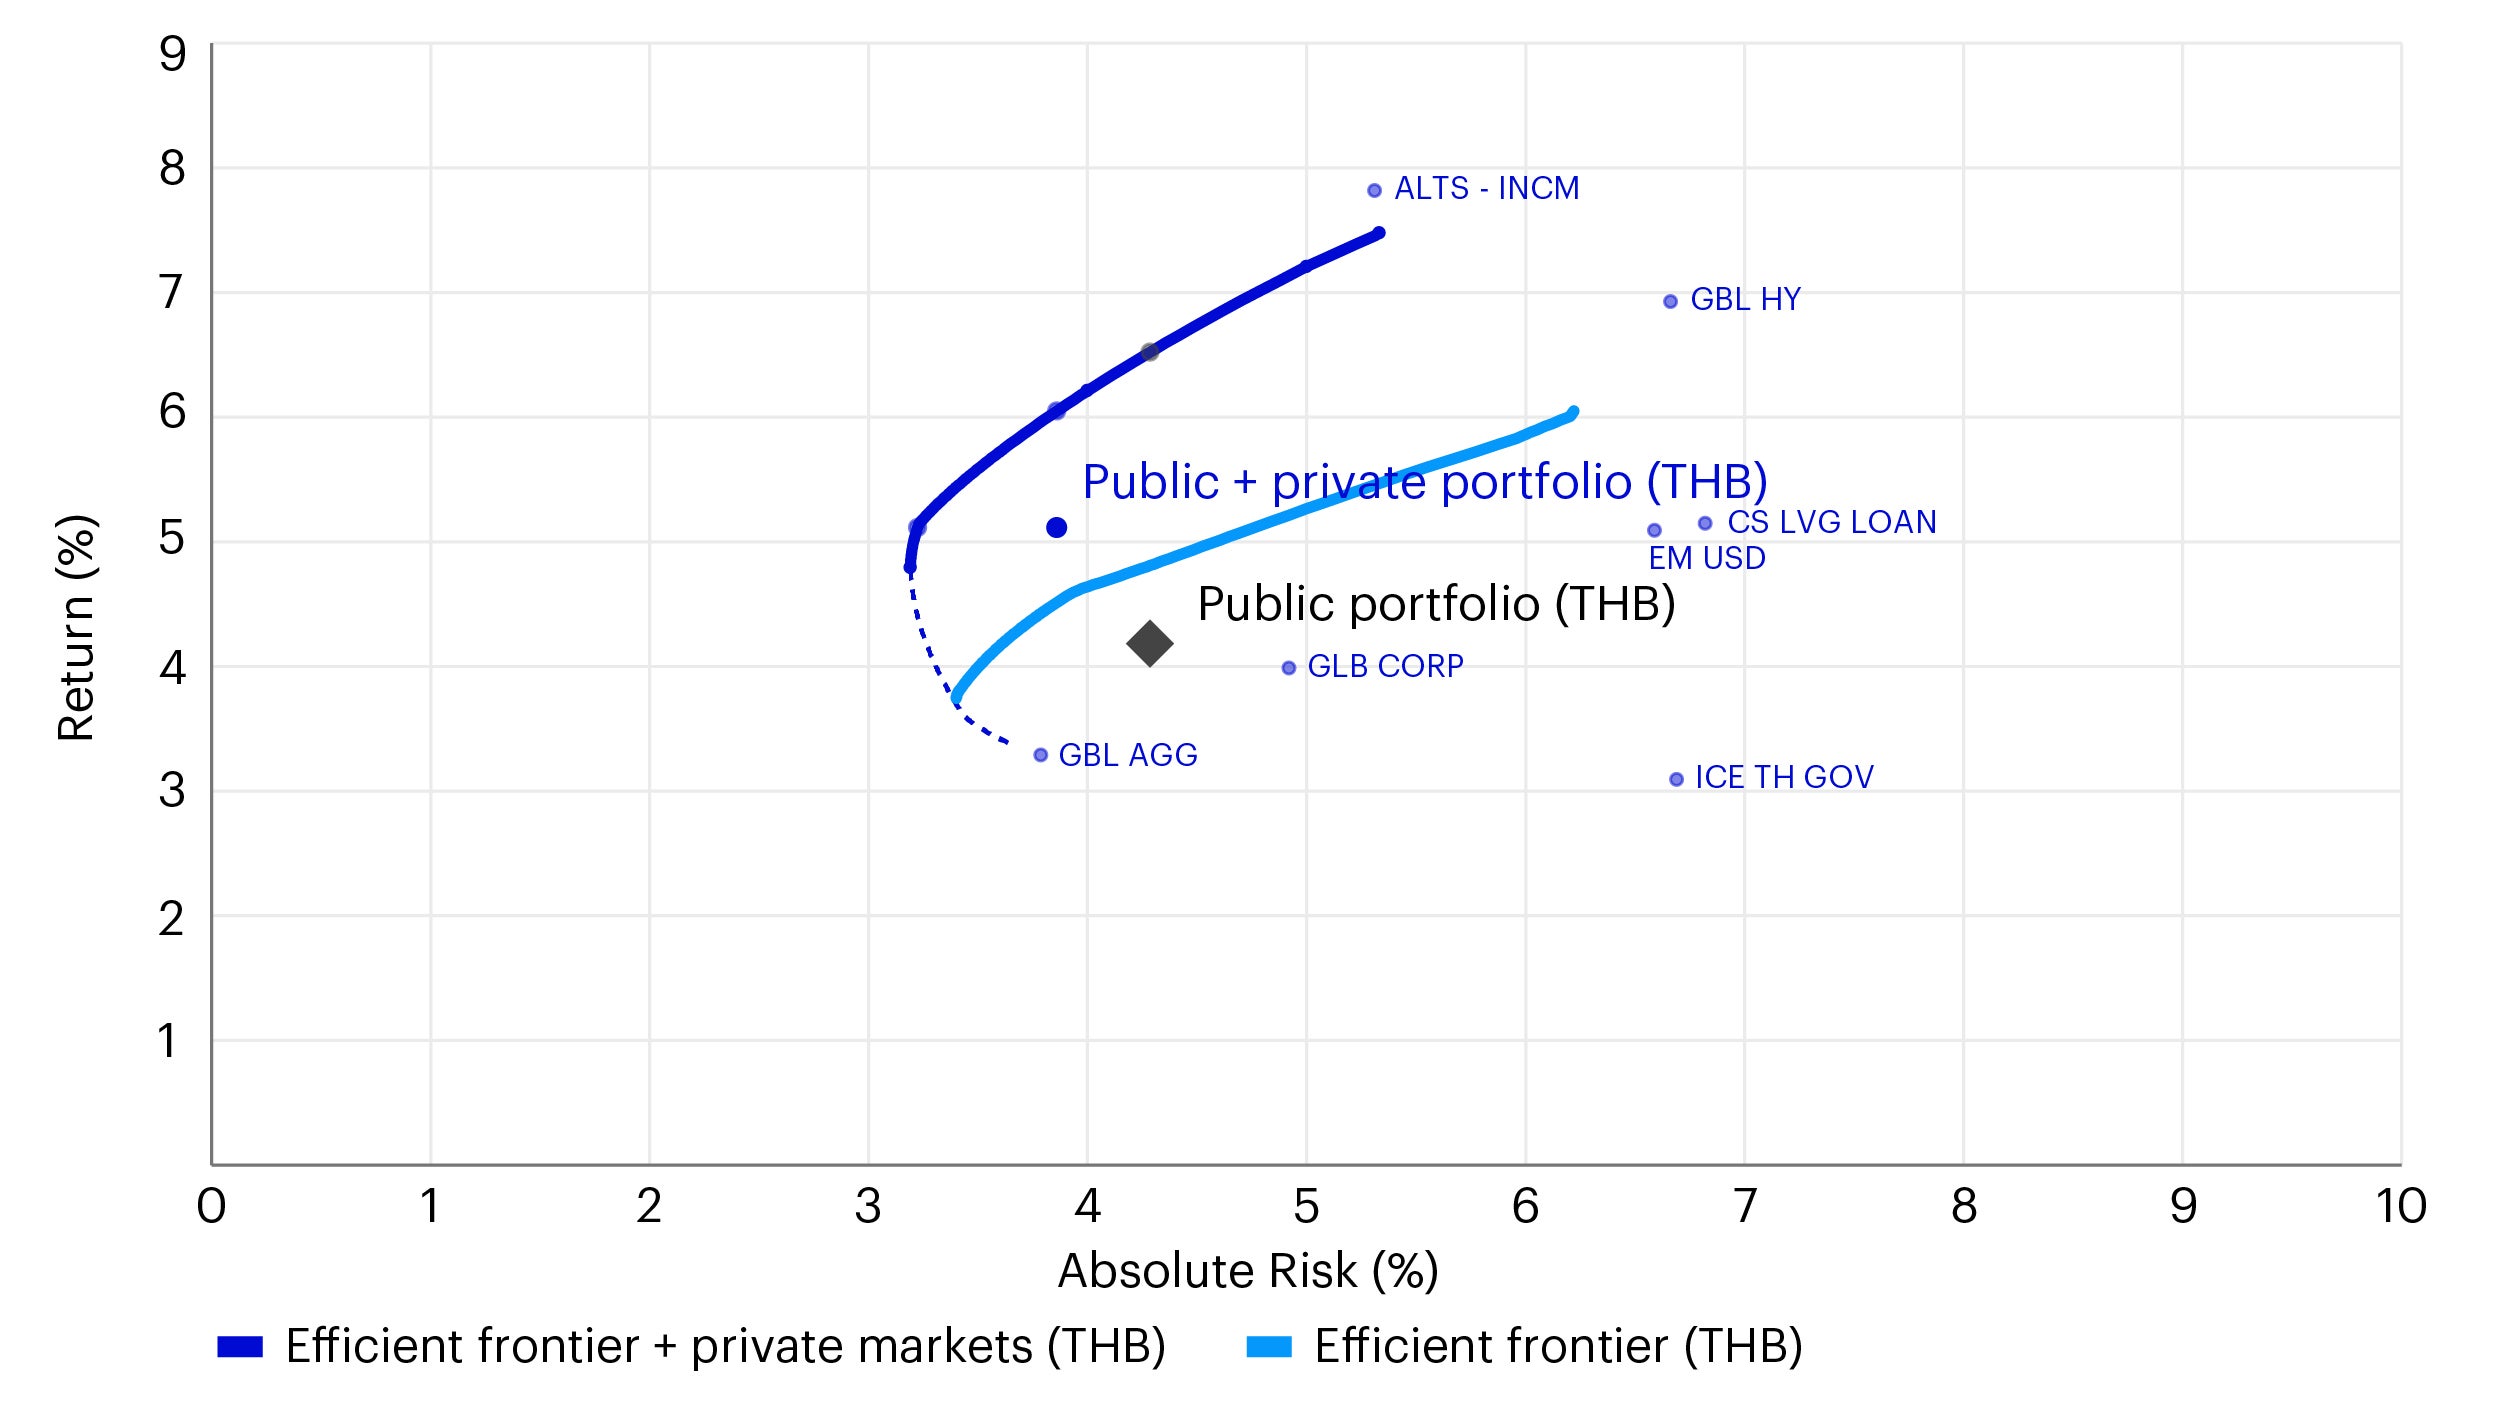
Implementing a 30% allocation to private markets income generates the following output:

For illustrative purposes only. There can be no assurance that any estimated returns or projections can be realized.
Adding private markets income clearly drives the expansion of the efficient frontier and increases expected yields by almost 80 basis points, whilst maintaining the same allocation to local government bonds and ensuring there is adequate portfolio liquidity. By incorporating a diversified private markets income sleeve to a public fixed income portfolio, non-USD investors can meaningfully enhance portfolio returns and cash flows through increased yields, and better position their portfolios for the current market environment.
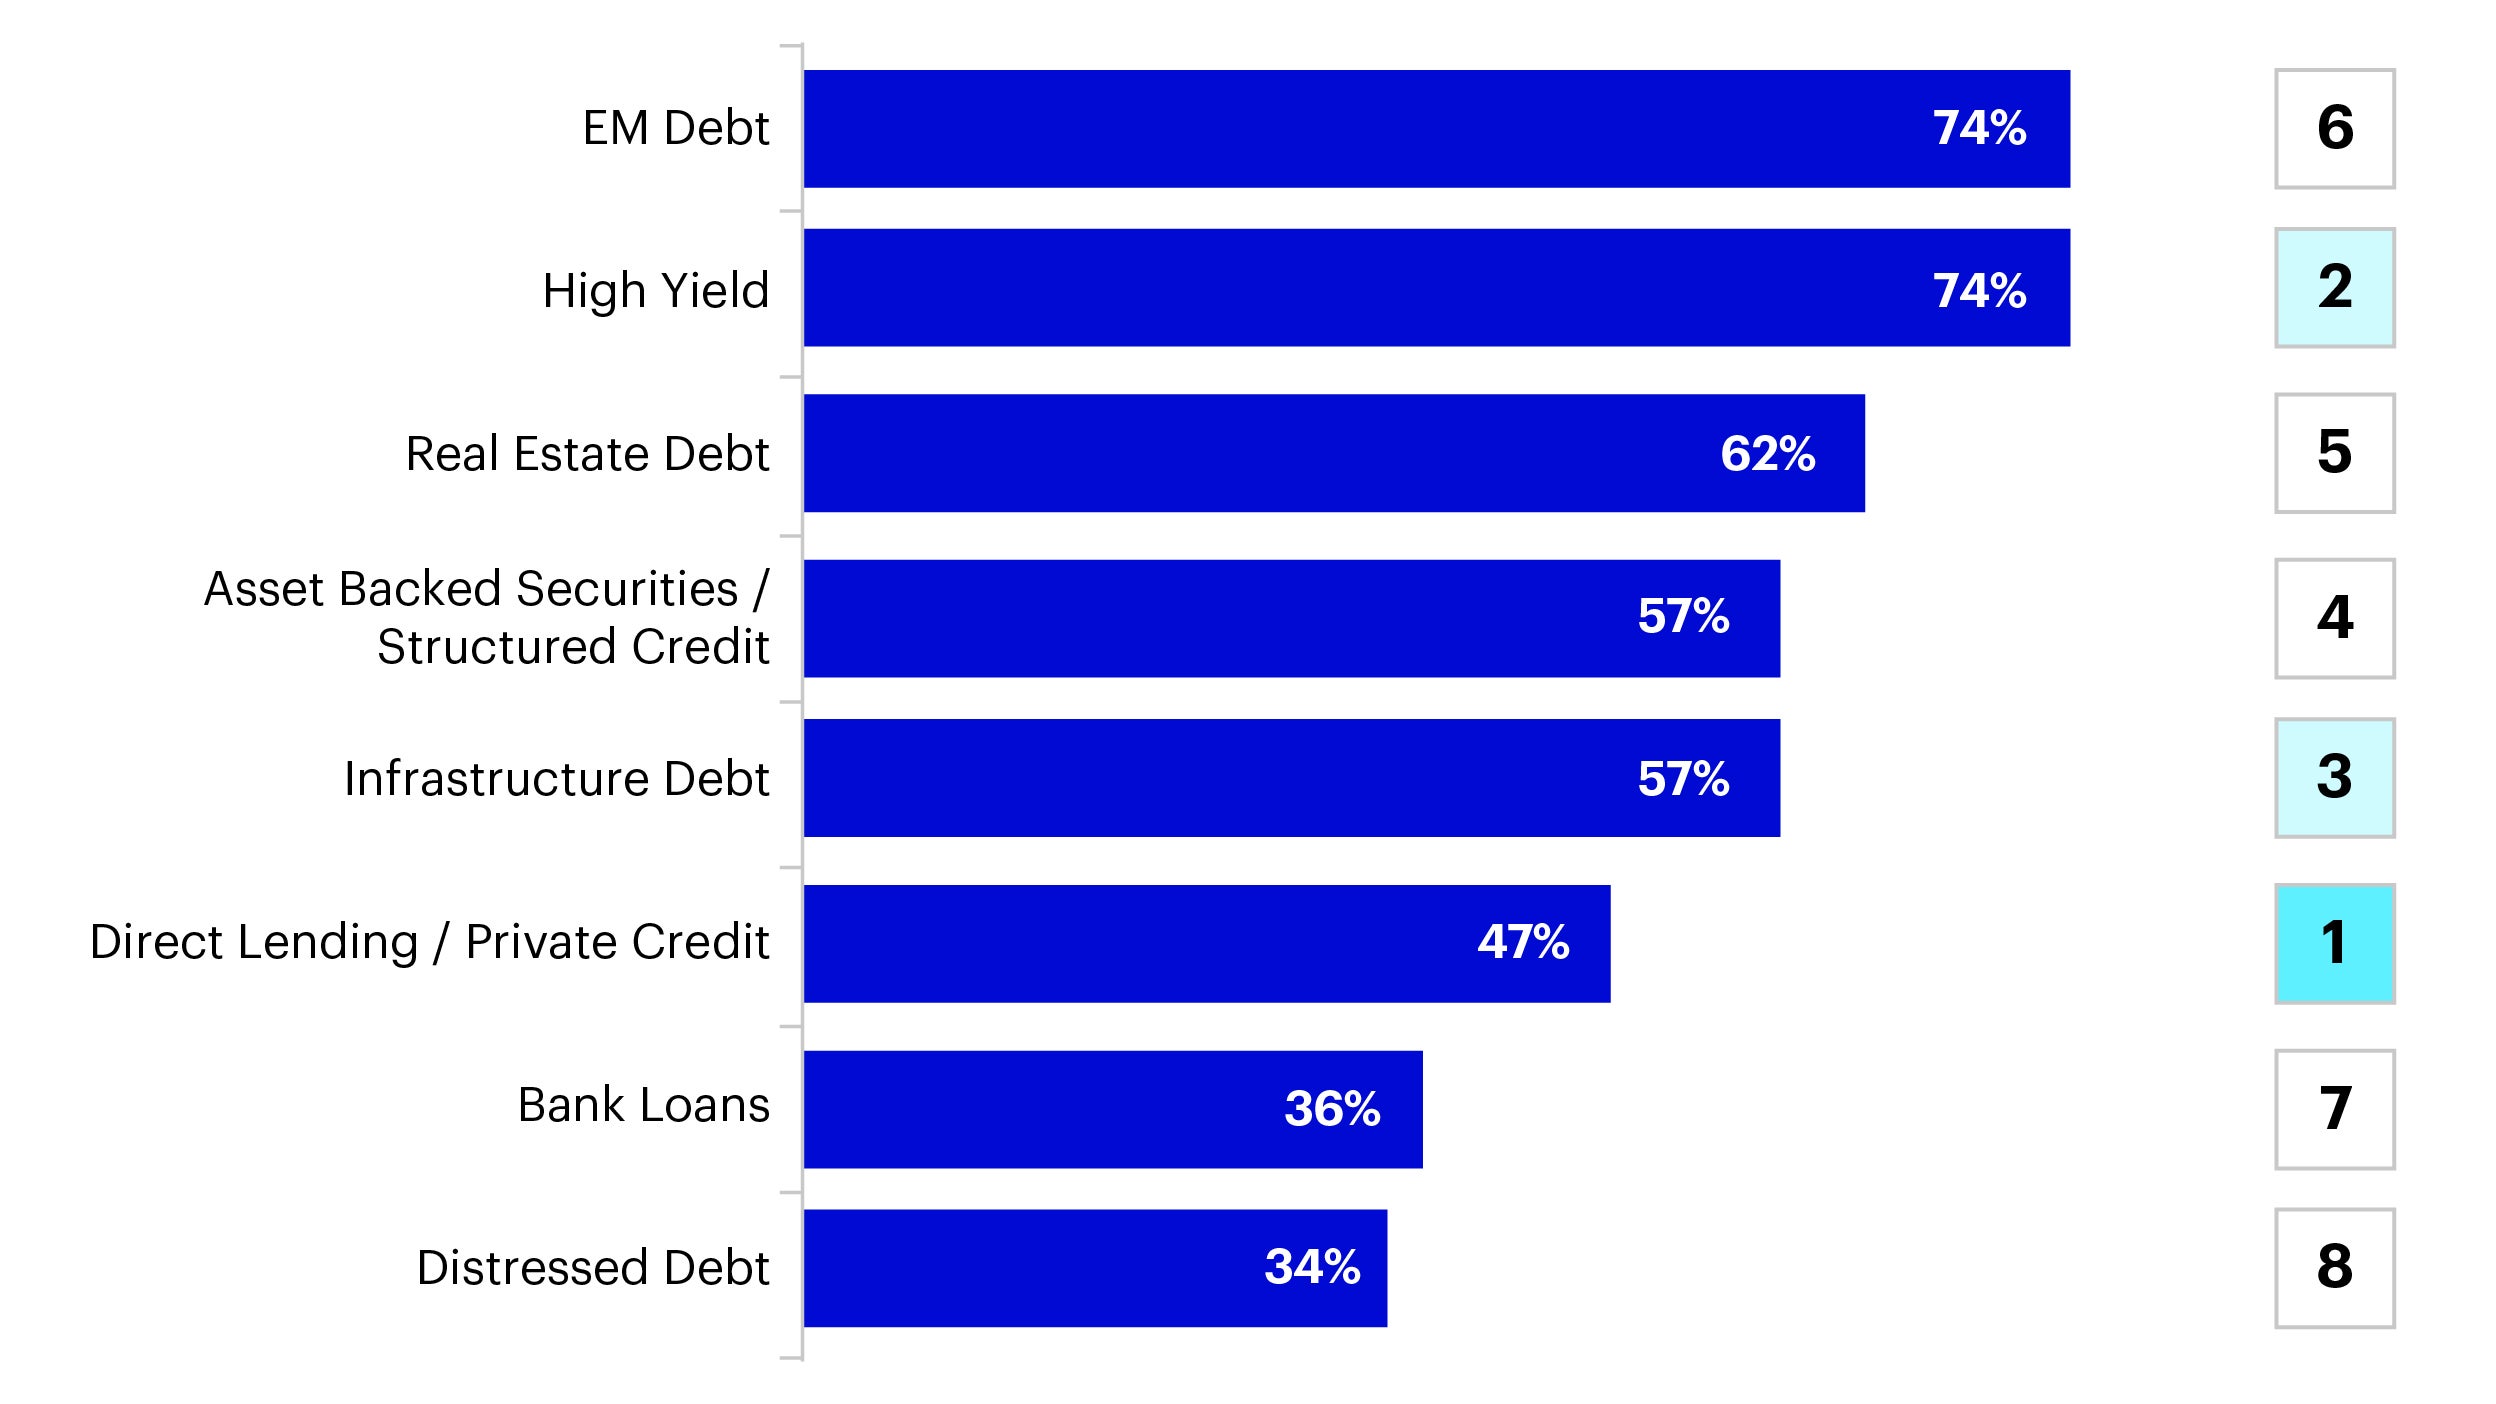
When thinking about private markets income, it is also important to consider diversification by obtaining adequate exposure across direct lending, real estate and infrastructure debt, and asset-based finance. By adding an additional layer of diversification within private markets, investors can harvest illiquidity premia and gain exposure to multiple sectors and secular growth themes. Our Invesco Global Sovereign Asset Management Study surveys global sovereign investors, who often have local currency considerations, on an annual basis. Our 2023 findings showed that sovereign wealth funds were the most optimistic about increasing their allocations to private credit among the various alternative fixed income investment types. Additionally, over half of sovereign wealth respondents have not even invested in private credit, further pointing to a continued opportunity for growth in the space.
Source: Invesco Global Sovereign Asset Management Study 2023; Question: Which of the following types of fixed income do you invest in? How attractive do you see each of these for increasing allocations over the next 12 months? Sample size: 53.
In sum, we believe Asian investors, many of whom have specific local currency return objectives, are well positioned to implement private credit into their public fixed income allocations. The current US interest rate environment, which has lasted longer than anticipated, has increased currency hedging costs and impaired local currency returns. This warrants consideration of additional approaches to portfolio construction and new asset classes, private credit in particular. While we’d argue the case for private credit remains strong globally, this is especially true for Asian investors impacted by increasing hedging costs.
Appendix
All data pulled from Invesco Vision as of 31 March 2024. For illustrative purposes only. There can be no assurance that any estimated returns or projections can be realized.
Investment risks
-
The value of investments and any income will fluctuate (this may partly be the result of exchange rate fluctuations) and investors may not get back the full amount invested.
Invesco Investment Solutions develops CMAs that provide long-term estimates for the behavior of major asset classes globally. The team is dedicated to designing outcome-oriented, multi-asset portfolios that meet the specific goals of investors. The assumptions, which are based on 5- and 10-year investment time horizons, are intended to guide these strategic asset class allocations. For each selected asset class, we develop assumptions for estimated return, estimated standard deviation of return (volatility), and estimated correlation with other asset classes. This information is not intended as a recommendation to invest in a specific asset class or strategy, or as a promise of future performance. Estimated returns are subject to uncertainty and errors and can be conditional on economic scenarios. In the event a particular scenario comes to pass, actual returns could be significantly higher or lower than these estimates.
Across a variety of alternative investment strategies, our objective is to capture the expected behavior of each strategy as represented by a broad proxy rather than a particular manager or fund. Granular data within private markets is difficult, and often impossible, to find. As such, we use objective, observable data from public proxies wherever possible as an input into our process; where data is not available, our alternatives specialists set forward-looking assumptions informed by their own experience.
Return assumptions vary by category. For Private equity, we use a building-block approach for US leveraged buyouts that captures earnings growth, valuation multiple expansion/contraction, fund leverage (and cost of financing), and fees to derive expected net returns. For other equity strategies such as venture capital, we compare historical returns to buyouts and then apply that difference to our forward-looking estimate for buyout returns on the assumption that return differences in the future will be consistent with the past.
Real Assets. For select real assets, namely Core US Real Estate and Core US Infrastructure, we utilize a building-block approach capturing rental income, maintenance CapEx, expected real income growth, expected inflation, expected valuation changes, leverage (and cost of financing), and fees to derive expected net returns. For other real assets, we utilize historical returns from NCREIF and Burgiss.
Private Credit. For most private credit proxies, we start with gross yields on underlying debt holdings and adjust for expected losses (based on historical averages), fund leverage (and cost of financing), and fees to derive expected net returns.
For a few private credit proxies, such as distressed debt, we utilize historical relationships to derive forward-looking assumptions as described above.
Approach to risk. A key principle of our risk methodology is to represent alternatives as a combination of both private and public exposures. This captures a distinct private element that is not correlated with traditional assets, while at the same time recognizing the underlying exposures themselves are often more public or traditional in nature. Taking private credit as an example, our methodology assumes exposure to a private debt factor as well as a public credit spread factor. The result is a private credit correlation with traditional assets that is greater than 0, but less than what would be suggested by public credit spread exposure alone. Because our Vision modeling platform extensively leverages the Barra framework, absolute risk for a number of alternative strategies is a byproduct of the Barra factor exposures. For alternative strategies not explicitly captured by Barra, we assume overall risk is consistent with history, with factors being mapped to the private and public factors that our alternatives specialists believe best represent the strategy.
Footnotes
-
1
Source: CME Group, data as of 16 May 2024


