Insight

Invesco Sustainable Pan European Structured Equity Strategy: Positioning & Performance

Invesco Sustainable Pan European Structured Equity Strategy: Positioning & Performance

Using a low volatility focus, the Invesco Sustainable Pan European Structured Equity Strategy combines a strict ESG focus with exposure to the Momentum, Quality and Value factors, each adding value in different market environments. This defensive multi-factor strategy has been able to deliver attractive returns at a reduced risk level.

The portfolio positioning can be best represented by its factor exposures. This is illustrated in the adjacent spider web chart (figure 1). It compares the index’s factor exposures in lighter blue against the portfolio’s exposures in dark blue. As the scale increases from the centre to the rim, the strategy shows higher exposures to all factor characteristics that provide the potential for superior risk-adjusted performance over a full market cycle. The strategy is positively exposed to our factors Momentum, Quality and Value while showing a reduced beta and a smaller size exposure than the benchmark 

Figure 1: Standardised factor exposures*
Source: Invesco, as of 31 December 2020. The above information is based on analysis using our proprietary risk model. Data taken from the Pan European Structured Responsible Equity Fund which has the same strategy and settings as the Invesco Sustainable Pan European Structured Equity Strategy. *Factor exposure is measured in standard deviations from the benchmark. Low Beta is measured as difference to the benchmark.

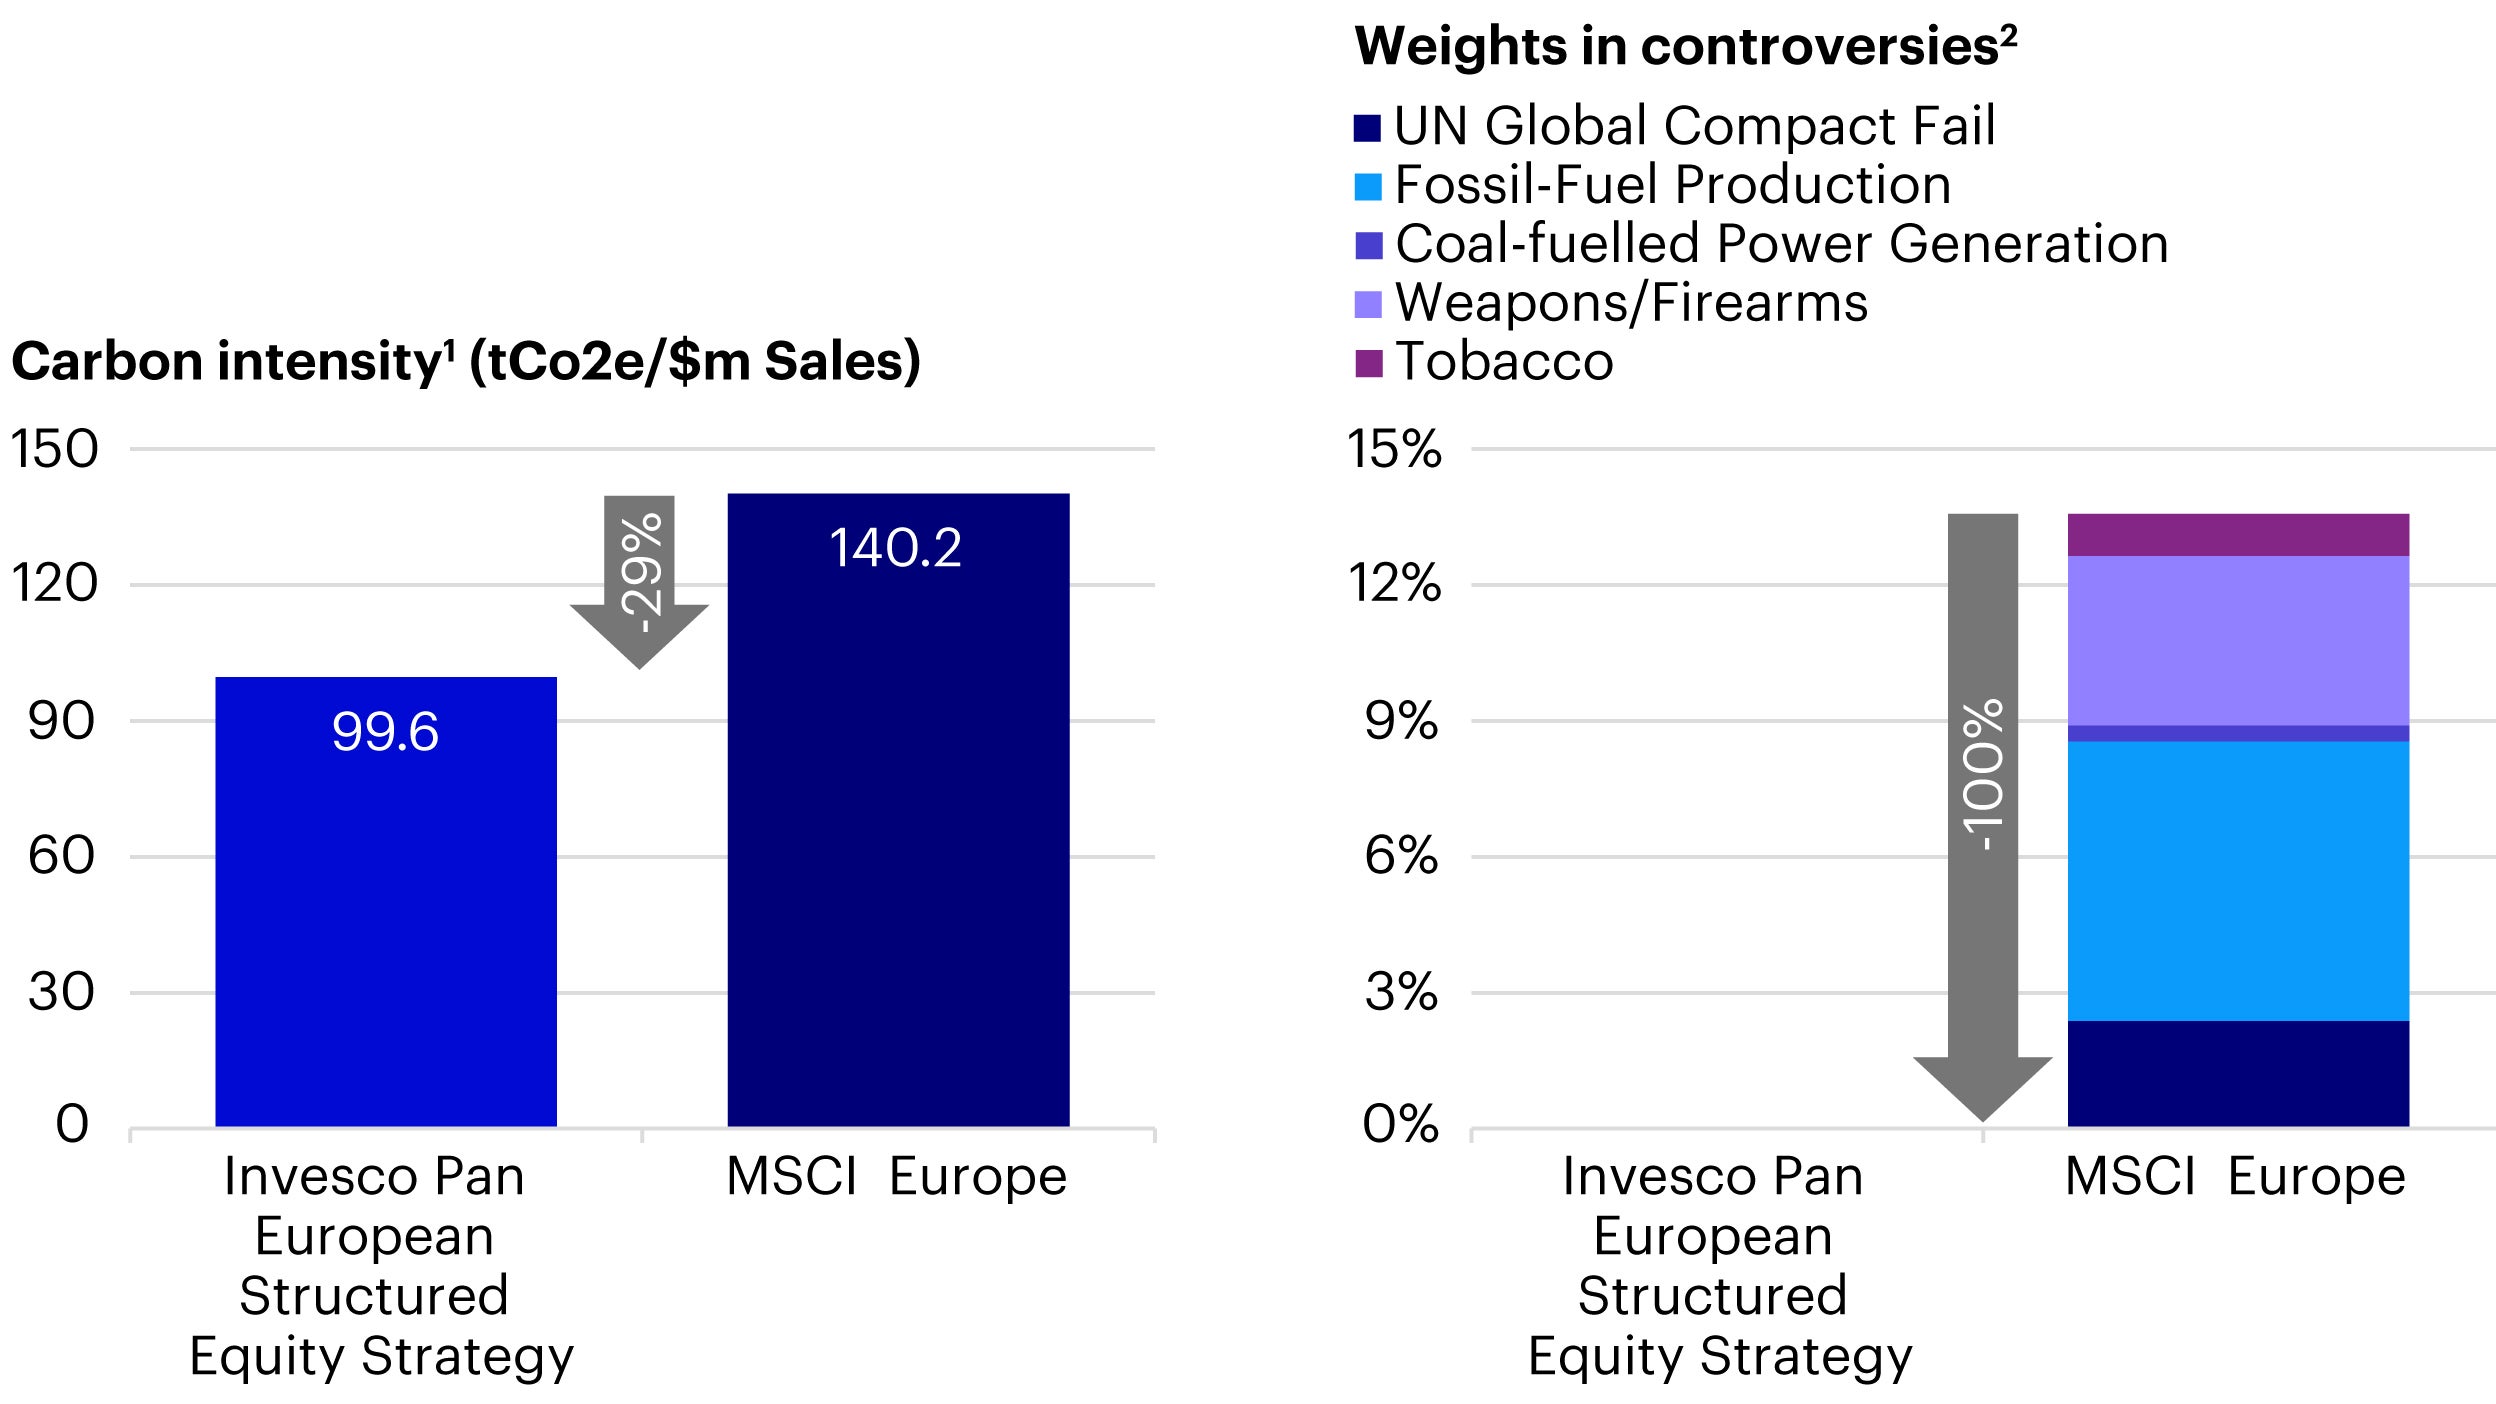
Strict application of ESG metrics leads to superior ESG characteristics in the portfolio. While inheriting a stronger ESG score than the benchmark and reducing carbon intensity by roughly 30%, the strategy achieves all of the above without having any exposure to stocks involved in controversial business activities.

Figure 2: Carbon intensity and controversies
Source: Data taken from the Pan European Structured Responsible Equity Fund which has the same strategy and settings as the Invesco Sustainable Pan European Structured Equity Fund. ¹ Invesco, ISS Climate Solution. Combines scope 1 and 2 emissions Direct emissions (tCO2e) and Energy Indirect emissions (tCO2e). Weighted Coverage is the percentage of the portfolio and benchmark where the ISS Climate Solution Carbon data research is available. Portfolio level carbon intensity figures are an indicative measure of exposure to carbon risk that should be considered alongside sector and company specific metrics. Latest climate dataset available is as of 2019. ² Vigeo Eiris Business involvement data. Indicates portfolio/ benchmark weight of holdings which derive revenue from this business activity above. Data as of 31 December 2020.

The sector and country positions are an outcome of the optimisation process which considers the factor exposures of stocks relative to their risk contribution to the portfolio. These are evaluated and compared to peers from the same region and industry to identify attractive companies from a return perspective.

Figure 3: Monthly absolute sector weights of the Pan European Structured Equity Strategy
Source: Invesco, MSCI Europe Index, Morningstar, data as of 31 December 2020. Sector weights can change any time and without warning. Data relates to the Invesco Pan European Structured Equity Fund. The classification is based on the Morningstar Stock Sector Structure.

How is the portfolio allocation impacted by risk parameters?

In times of low market volatility, there is little risk differentiation between cyclical and defensive sectors resulting in a larger allocation of cyclical stocks. In times of market turmoil, like the Global Financial Crisis or the Covid-19 sell-off, the risk gap between risky and defensive sectors widens, thus causing the portfolio to shift into more defensive sectors. This allows the strategy to benefit from attractive stocks from all sectors while moving towards a less risky positioning when it is needed.

Additionally, the optimisation also penalises industries/countries which experience sudden risk spikes. Figure 3 shows the absolute sector allocation of the strategy since its inception in 2006 while the light blue line illustrates the predicted risk from our proprietary risk model.

It can be seen that the Global Financial Crisis (2008/09), the European Debt Crisis (2011) as well as the Covid-19 sell-off were all accompanied by spikes in the predicted risk levels, and consequently led to a move towards the more defensive sectors.

Figure 4: Performance of the Invesco Pan European Structured Equity Strategy
Source: Invesco, MSCI Europe Index; For illustrative purposes only. Data for the period October 2006 until June 2020. ‘MSCI’ is MSCI Europe ND. Strategy performance: inclusive of net reinvested income and net of the annual management charge and all other fund expenses for the fund’s A shares. Data as of 31 December 2020.

What has been the strategy performance?

The strategy has been able to deliver attractive returns at a reduced risk level benefiting from both the multi-factor approach and its low volatility focus. Figure 3 shows the monthly returns of the MSCI Europe at the bottom and at the top of the chart, the strategy’s active returns of the corresponding month.

In negative months, when markets declined by 3% or more, the strategy achieved an average monthly outperformance of 1.1%, highlighting its defensive nature. In “normal” market periods, the strategy benefited from its multi-factor approach adding 30 bps to the benchmark return on average. Alternatively, in rising markets, the strategy’s defensive nature capped the upside participation to some extend (average by 0.9%).

While the strategy captured approx. 93% of the market upside moves, it only participated on 75% of the downside returns, leading to a significant excess return against the MSCI Europe Index since inception in 2006. The historical average beta has been 0.85. In aggregate this approach results in a style neutral large cap equity portfolio that many of our investors use as a core equity holding.

Outlook

We believe, the combination of superior ESG characteristics, downside protection and extra return potential of equity factors is very appealing to investors. ESG investing will be an essential part of the solution to a sustainable future. As a quantitative investor, IQS can merge the ESG focus with its proven multi factor approach while maintaining its targeted factor characteristics and deliver positive active returns over the long-term.

As our intended factors have added value over full economic cycles, the rationale supporting them remains intact, and we continue to be optimistic about the future. A defensive low volatility strategy serves as a valuable building block for a portfolio, allowing investors to participate in the conversion towards a more sustainable future while being well positioned to weather potential market setbacks.

Investment risks

  • The value of investments and any income will fluctuate (this may partly be the result of exchange rate fluctuations) and investors may not get back the full amount invested.

Important information

  • Where individuals or the business have expressed opinions, they are based on current market conditions, they may differ from those of other investment professionals and are subject to change without notice.

    This document is marketing material and is not intended as a recommendation to invest in any particular asset class, security or strategy. Regulatory requirements that require impartiality of investment/investment strategy recommendations are therefore not applicable nor are any prohibitions to trade before publication. The information provided is for illustrative purposes only, it should not be relied upon as recommendations to buy or sell securities.