
Equities Introduction to Factor Investing
Equities provide a return for bearing investment risk over the long term. The question for an investor is, how to identify stocks with the best return potential given their inherent investment risks.
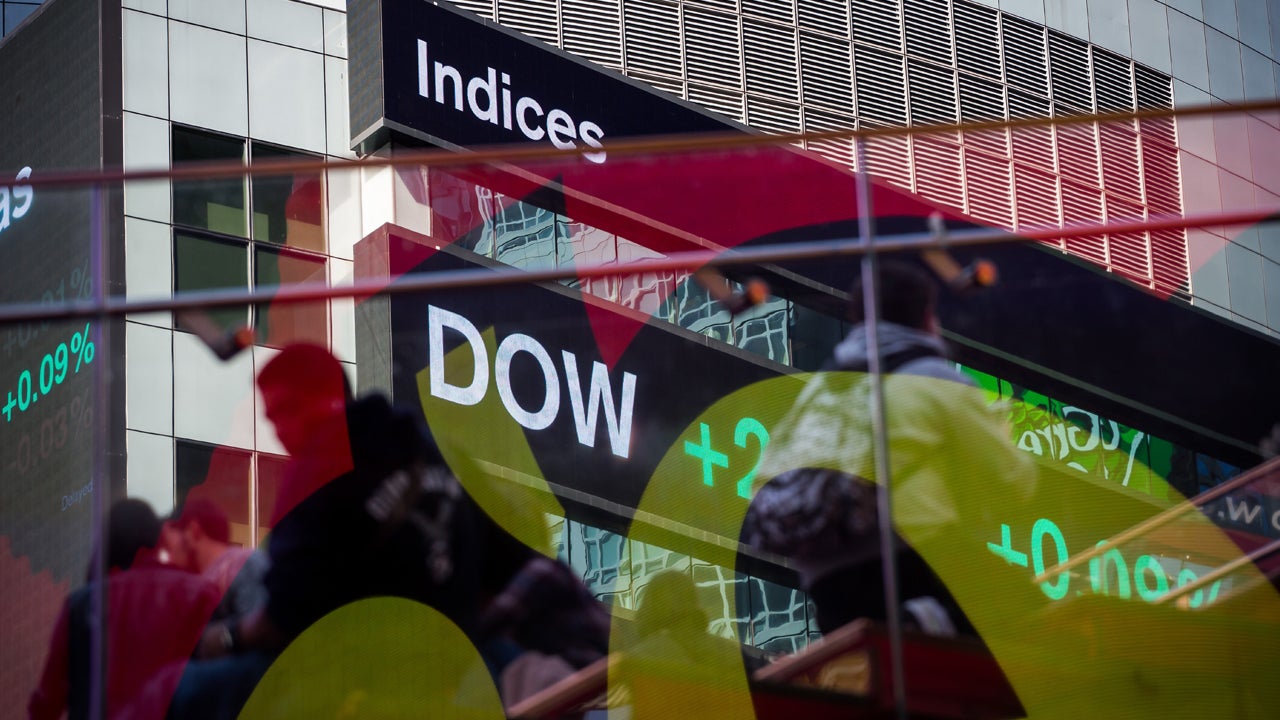
The start of September saw a rapid rotation in equity markets out of momentum stocks into previously shunned value names. For value-investors who have experienced disappointing returns over much of the past 10-years this was welcome development. Does this recent rally represent the long awaited persistent shift in favour of value?
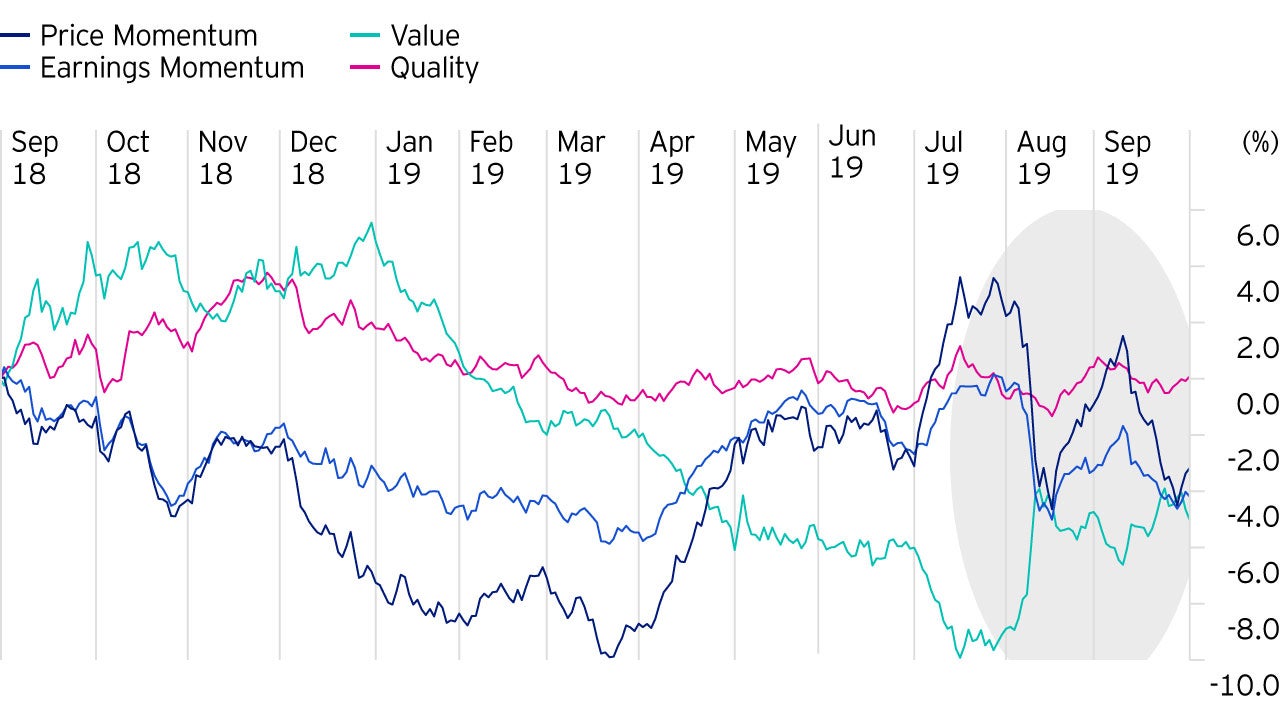
Nonetheless, momentum started to recover in late April and enjoyed positive returns over the following months. This left value as the key detractor from portfolio performance. In early September, however, the rebound in value stocks brought the return divergence between value and momentum to a prompt end. Figure 1 plots the cumulated returns of key factors over the past year and illustrates how the gap between value and momentum has narrowed down to a small margin.
Interestingly, the start of the rally in early September saw the largest gains. Figure 2 shows the daily returns of a long-value-short-momentum strategy. From this it can be seen just how extreme the factor returns have been, particularly on the 9th and 10th of September, which were particularly pronounced outliers.
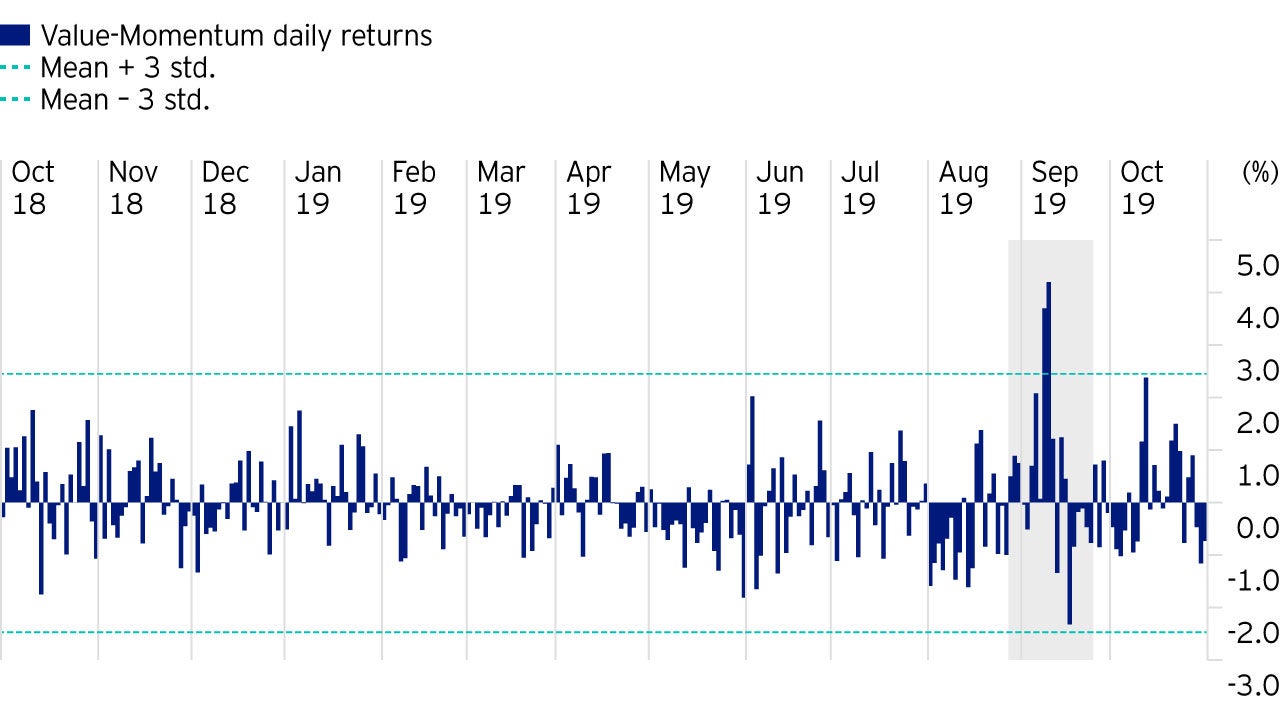
The sharp reversal was followed by a more moderate pull-back over the following days, however, the value rally continued throughout most of October and extended into November.
Fundamentally, the rotation coincided with reversals in bond yields and other cyclically exposed assets and, thus, may be attributed to alleviated fears of a global recession, an unresolved Brexit in Europe and trade war escalations between the US and China.
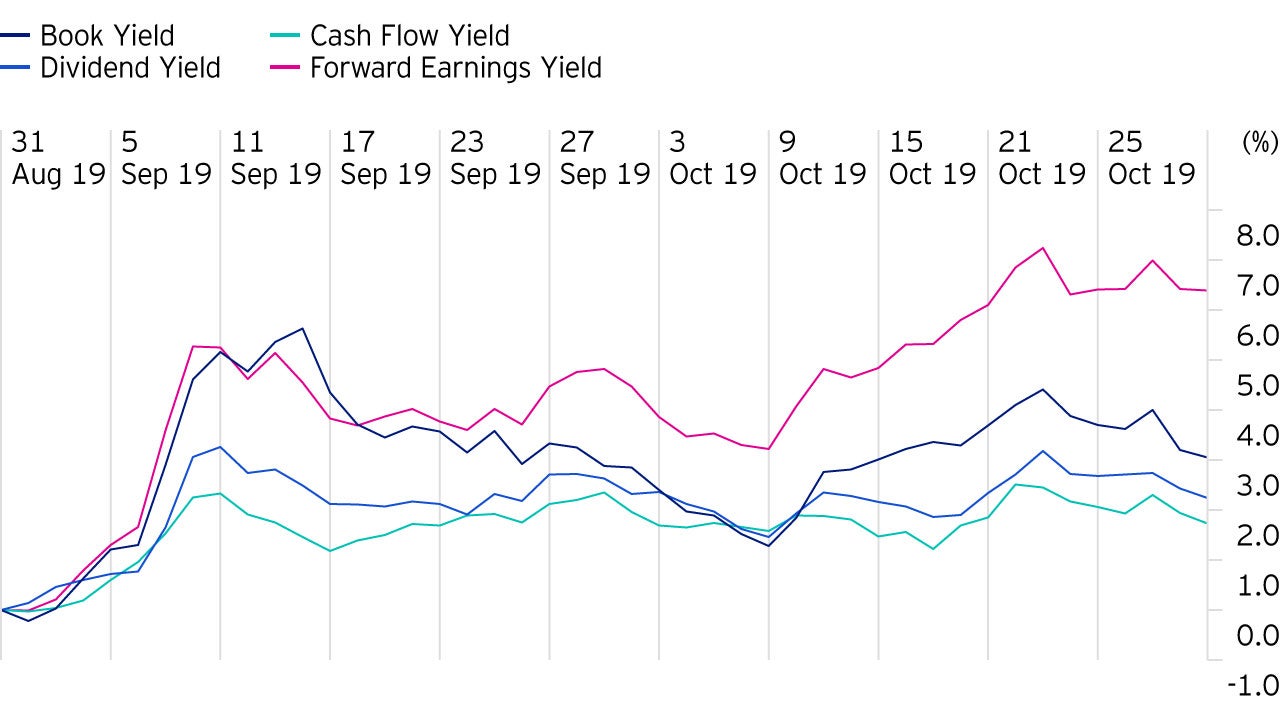
Further analysis of the underlying movements of the rotation reveals that more cyclical definitions outperformed defensive value signals. As shown in figure 3, value returns were led by forward earnings yields or in other words by stocks that appeared attractively valued relative to their earnings. The more defensively oriented cash flow and dividend yield signals trailed the most.
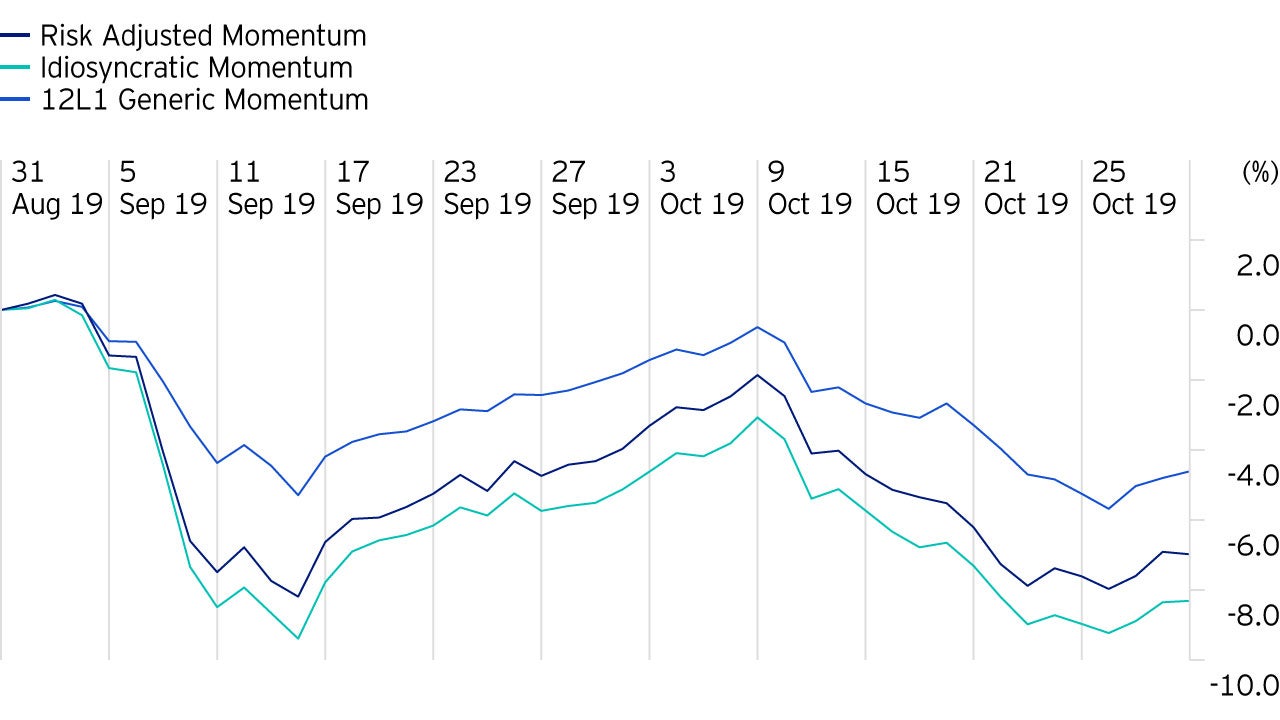
Turning to the other side of this trade, figure 4 illustrates how more sophisticated momentum factor definitions that focus on idiosyncratic or risk-adjusted returns outperformed a generic 12-1 month price return signal. The dashed green line in the chart below shows the generic 12-1 month momentum, while idiosyncratic momentum mainly outperformed by limiting the initial drawdown at the beginning of September. This is also in line with past observations, for instance, during the global financial crisis, when generic definitions of price momentum experienced particularly pronounced sell-offs compared to definitions that also consider risk and abnormal returns.
Today, investors may - rightfully - question whether this is the start of a persistent shift towards value or rather a short-lived technical unwind related to investors’ temporary concerns about valuation levels.
From our perspective, the rationale for the value premium is still intact and we clearly believe that there are various reasons for having exposure to value.
Most importantly, exposure to value remains extraordinarily cheap. The dark blue line in figure 5 depicts the spread between the 90th and the 10th percentile of global forward earnings yields. We can see that the valuation difference between expensive and cheap stocks is clearly wider than normal. Periods with even wider value spreads predominately occurred during the time of the dot-com bubble in the early 2000s and shortly before the global financial crisis.
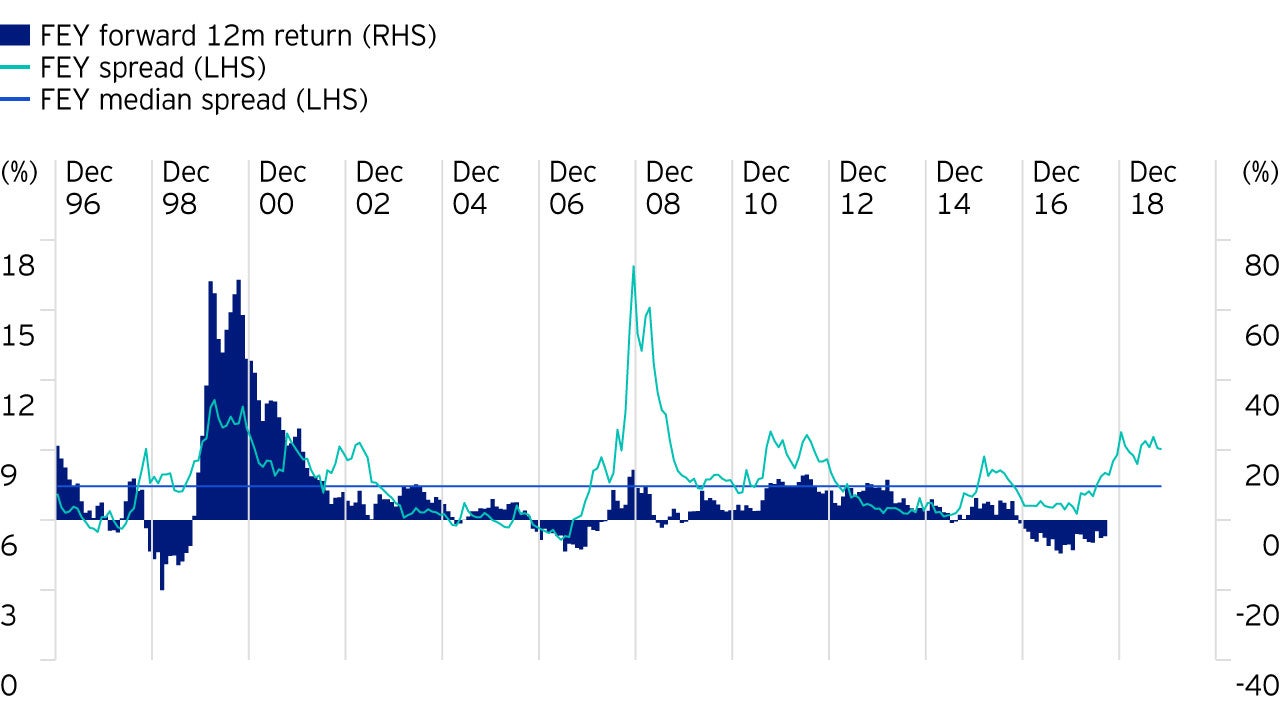
Furthermore, the lightly shaded blue bars in the same chart represent the returns of a forward earnings yield factor over the following 12 months. We can see that value has historically performed best when it was particularly cheap.
Apart from value spreads, economic developments remain an important consideration. In particular, cyclical value signals favour a healthy economic environment. If trade uncertainties and recession fears continue to alleviate, investors’ preference for value stocks may continue further.
Still, whether this will become the start of more significant change of factor dynamic is impossible to predict and remains to be seen. We therefore believe that a cautious stance with balanced exposure to key factors, momentum, quality and value will remain crucial in these volatile periods.

Equities provide a return for bearing investment risk over the long term. The question for an investor is, how to identify stocks with the best return potential given their inherent investment risks.

Starting in 1983, Invesco Quantitative Strategies (IQS) has been successfully implementing diversified multi-factor strategies seeking to capture factor premia irrespective of the prevailing market environment and timing considerations.

Whether you’re looking for a specific outcome, long-term returns, or a way to express a market view, factors can help investors achieve their goals.