Chinese onshore bonds: A market too important to ignore?

Invesco's Fixed Income team examines the key features of China’s onshore bond market, the impact of recent index inclusion and the main drivers of its performance.
Chinese policy makers have made tremendous efforts in recent years to provide accessible investment channels to overseas investors. This market opening has led to the inclusion of Chinese onshore bonds in the Bloomberg Barclays Global Aggregate Bond Index, and could lead to inclusion in other major indices in the coming years.
One of the most intriguing findings from Invesco’s 2019 Global Fixed Income Study is global investors’ strong interest in China’s fixed income market, with the majority of investors surveyed showing interest in making a strategic or thematic allocation to Chinese onshore bonds in the next three years (Fig. 1 and 2). Notably, 58% of North American investors reported intending to increase their exposure in the next three years.1
Invesco Fixed Income shares the view that China’s onshore bond market has become too important to ignore.2 China’s economy already represents one of the most significant growth engines in the world. The further opening of China’s financial markets offers investors access to a fixed income asset class that is important, not only due to its size (China’s onshore bond market is the second largest in the world), but also its unique characteristics; compared to other major bond markets, Chinese onshore bonds have offered higher yields, lower currency volatility and greater diversification benefits (Figure 3, Figures 8-11).


How important is China’s onshore bond market?
Market scale
China’s onshore bond market totaled RMB89 trillion (USD13 trillion) in bonds outstanding as of April 2019 (Figure 3). It is the second largest bond market in the world, behind the US, but ahead of Japan, the UK and other European countries (Figure 3). It has grown at an annual rate of over 20% per year for the past five years.3

Index inclusion
Although China has been long recognized by its economic significance among global investors, its bond market has been underrepresented in major indices and global investment portfolios. Following China’s efforts to ease and simplify foreign participation in the onshore bond market, Bloomberg announced in March 2018 that it would include renminbi-denominated Chinese government and policy bank bonds in its flagship Bloomberg Barclays Global Aggregate Index (Global Aggregate Index).
Beginning in April 2019, Chinese fixed income securities have been included in the Global Aggregate Index, with a planned phase-in period of 20 months ending in November 2020. According to Bloomberg’s projection, using data as of Jan. 31, 2019, China is expected to represent 6.1% of the Global Aggregate Index upon completion of the phase-in period.4 This served as a “wake-up” call for many investors in developed markets, as China’s ultimate weight in the index could be higher than that of France, the UK, Germany and several other developed markets with the exception of the US and Japan (Figure 4). After the phase-in period, Chinese bonds could become the fourth largest bond category by currency and the third largest by country in the Global Aggregate Index, based on Bloomberg’s projection.5 It is important to remember that a constituent’s weight in the index is constantly changing based on its market size and value in US dollar terms.

The three broad issuer types in China’s onshore bond market include governments, banks and non-bank companies. Bonds issued by governments and policy banks are referred to as “rates bonds” by local investors, while bonds issued by commercial banks and corporates are called “credit bonds.” The main difference is that rates bonds are considered to have minimal credit risk and thus typically enjoy a significantly lower risk weight for bank investors.
As shown in Figure 5, central government bonds, local government bonds and policy bank bonds accounted for 55% of bonds outstanding in China, followed by certificates of deposit and financial bonds, which represent around 11% and 7%, respectively, of total market size. The rest of the market comprises bonds issued by companies in the form of medium-term notes, commercial paper, enterprise bonds and corporate bonds issued in the exchange market.6

International investment flows
Following the inclusion of China’s onshore bonds in the Global Aggregate Index, the market has focused on potential bond inflows into China. If other major index providers follow suit, we estimate that inflows could reach USD200-300 billion in the near-to-medium term and over USD1 trillion in the longer term. Foreign ownership of local currency government bonds across developed and emerging markets currently ranges between 10-60% of total government bonds outstanding. (Figure 6). Assuming that foreign ownership of Chinese rates bonds (government and policy bank bonds) reaches 10-20% of total bonds outstanding in the next three-to-five years, we estimate international flows into rates bonds alone would reach some USD700 billion-USD1.5 trillion.7

Given that the size of China’s bond market has already surpassed Japan’s, we would expect China to ultimately have a similar weight as Japan in major bond indices. Currently Japan’s weight is 15-16% in the Bloomberg Global Aggregate Index and 19% in the FTSE World Government Bond Index.8 A weight of 15-20% in these two major bond indices could imply USD700 billion-USD1.2 trillion in potential inflows into China’s bond market, according to our estimates.
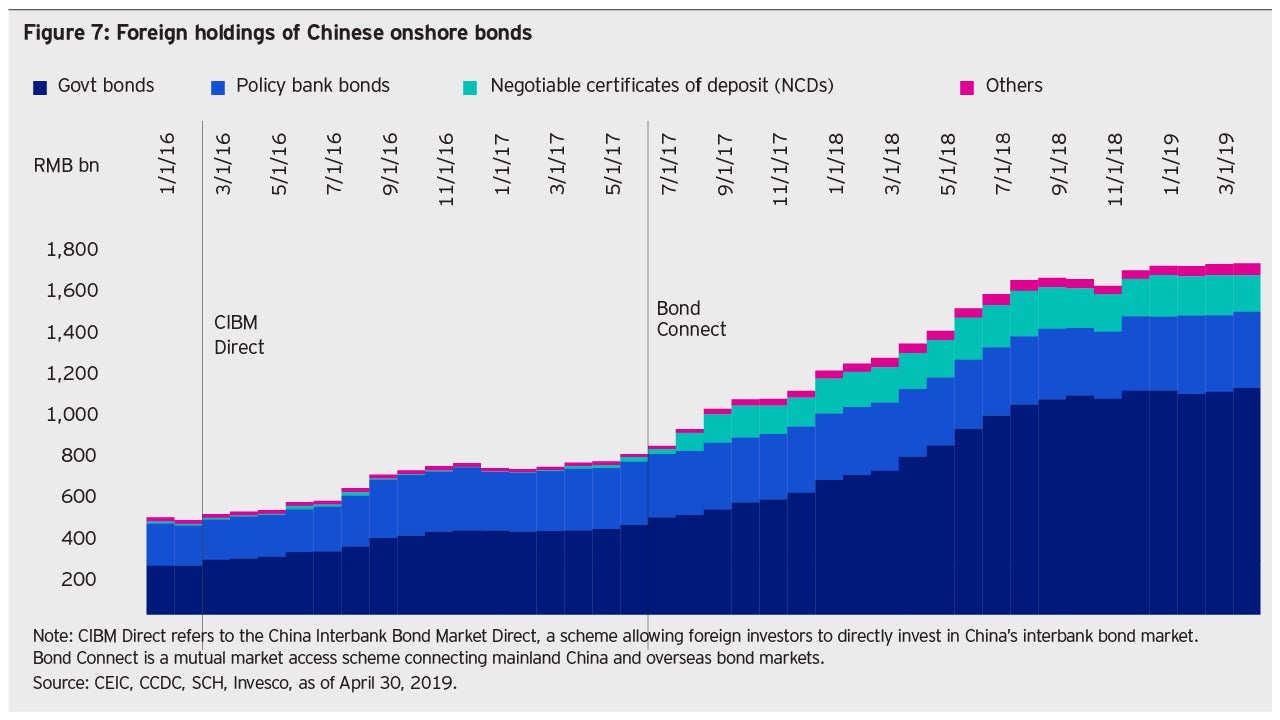
Foreign inflows have already demonstrated a notable surge since late 2017. Although foreign ownership of the overall bond market remained relatively low at 2.2%, as of the first quarter of 2019, foreign ownership of Chinese government bonds nearly doubled in 2018, reaching 8% of government bonds outstanding.9 In 2018, foreign investors purchased 34% of the net supply of Chinese government bonds and also actively participated in policy bank bonds and negotiable certificates of deposit (NCD) issued by commercial banks (Figure 7).10
Attractive features of China’s onshore bond market
In addition to index inclusion and rising foreign ownership, we think several features of Chinese onshore bonds could provide global investors with a potentially attractive option to help diversify portfolio risk and improve returns on a risk-adjusted basis.
Attractive yields relative to major markets
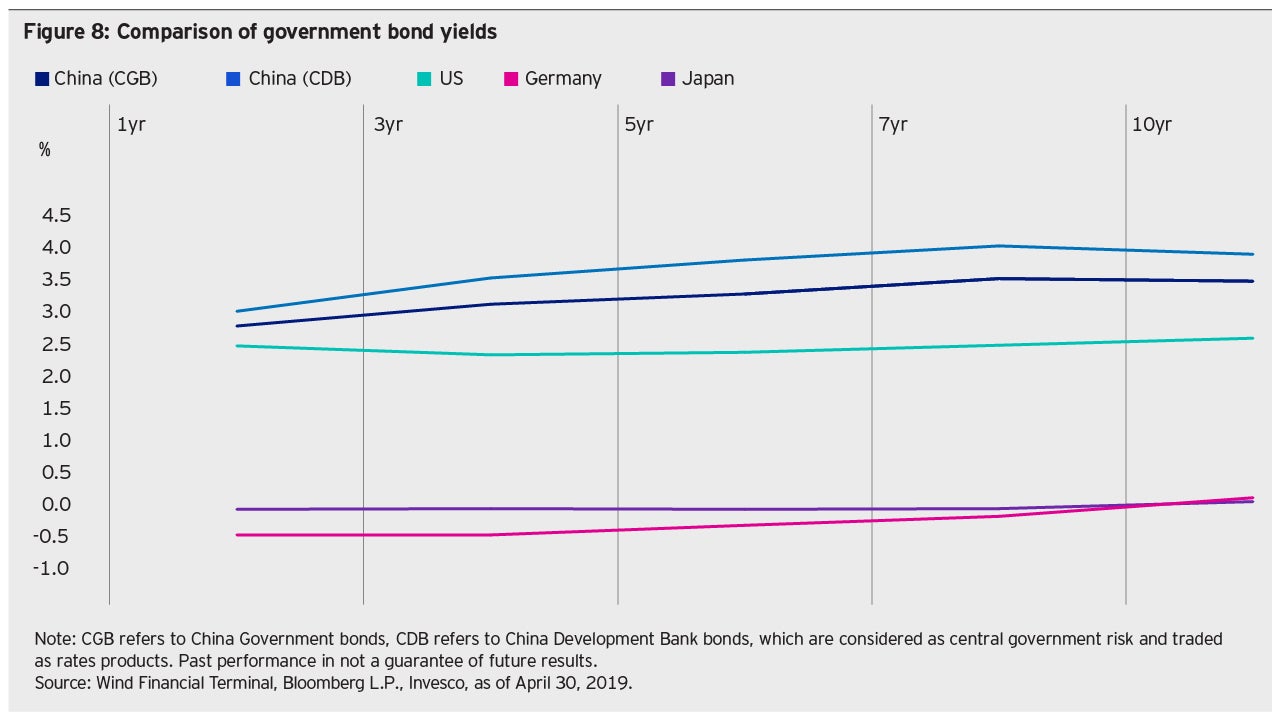
Compared to its peers in the Global Aggregate Index, Chinese onshore bonds tend to offer a higher yield. A key factor driving foreign investor demand for Chinese rates bonds for example, has been their more attractive yield relative to government bonds in other major markets. As shown in Fig. 8, the yield pick-up is anywhere from 50 to 150 basis points versus duration-equivalent US bonds to as high as 300 basis points or more versus European bonds, many of which still trade with negative yields.11
Lower correlation with global bonds provides potential diversification benefits
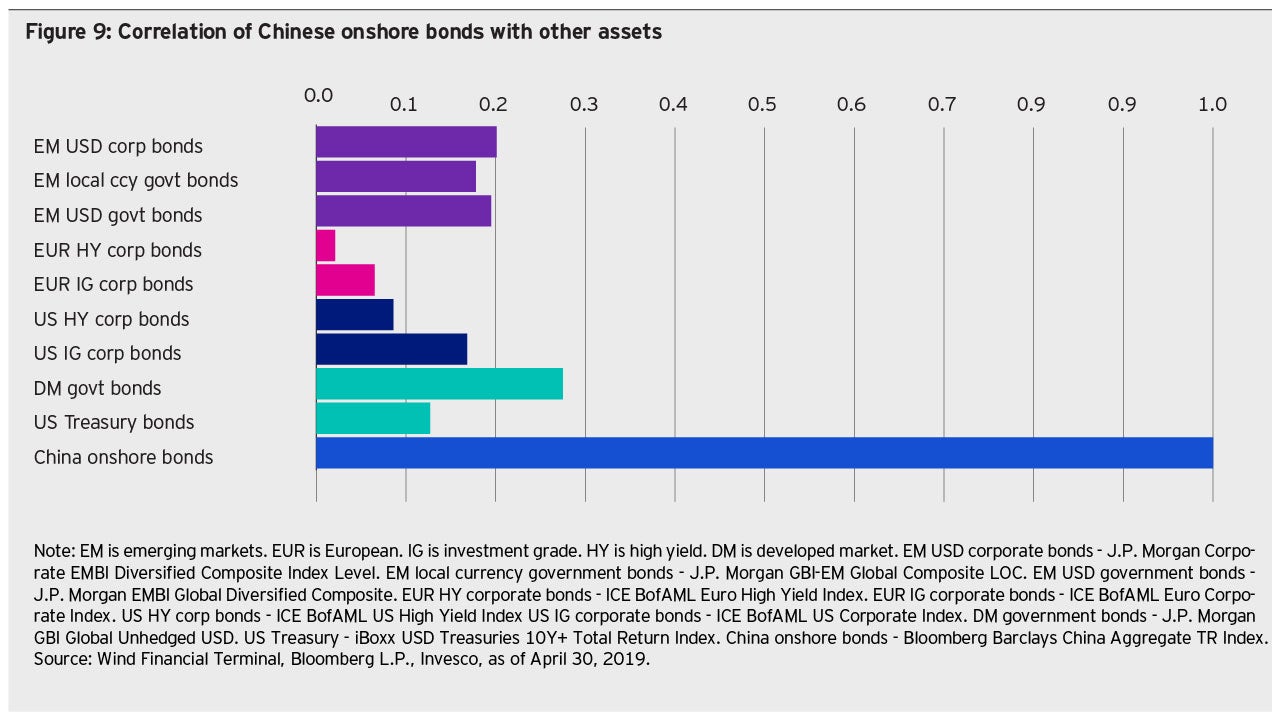
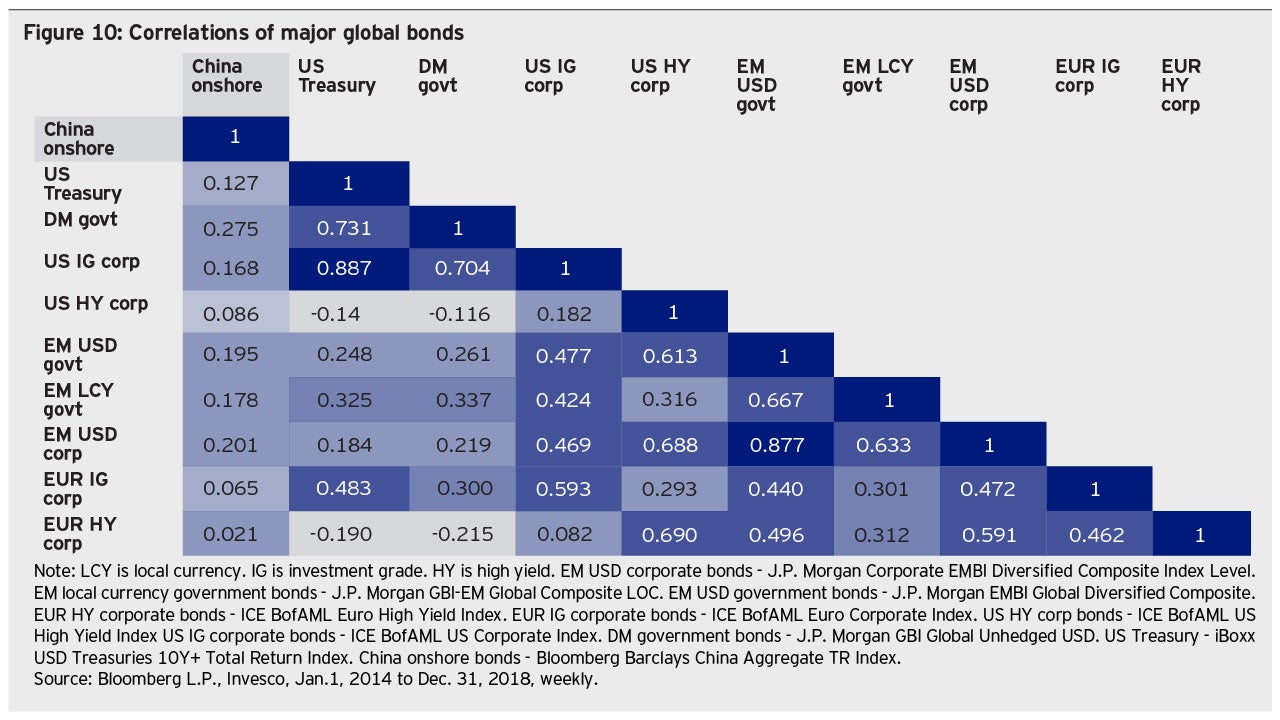
Along with higher yields, renminbi denominated bonds have tended to have a low correlation to other markets, providing potential diversification benefits to investors seeking to reduce portfolio volatility and enhance risk-adjusted return potential. This is especially important in market environments in which global assets have tended to move in line with broader risk sentiment.
As shown in Figures 9 and 10, the correlation of renminbi bonds is around 0.1-0.2 with US corporate bonds and less than 0.1 with European corporate bonds, for both investment grade and high yield. We think this is likely driven by the fact that China has relatively independent monetary policy, including proactive macro prudential oversight of the economy and markets.
Lower exchange rate volatility
For investors whose base currency is not the renminbi, investing in Chinese onshore bonds introduces currency risk. Together with the absolute bond yield, currency volatility plays a key role in total returns.
While many international investors have expressed concern in the past about currency risk related to renminbi denominated assets, the renminbi has historically posted significantly lower volatility than other major developed and emerging markets currencies (Figure 11).
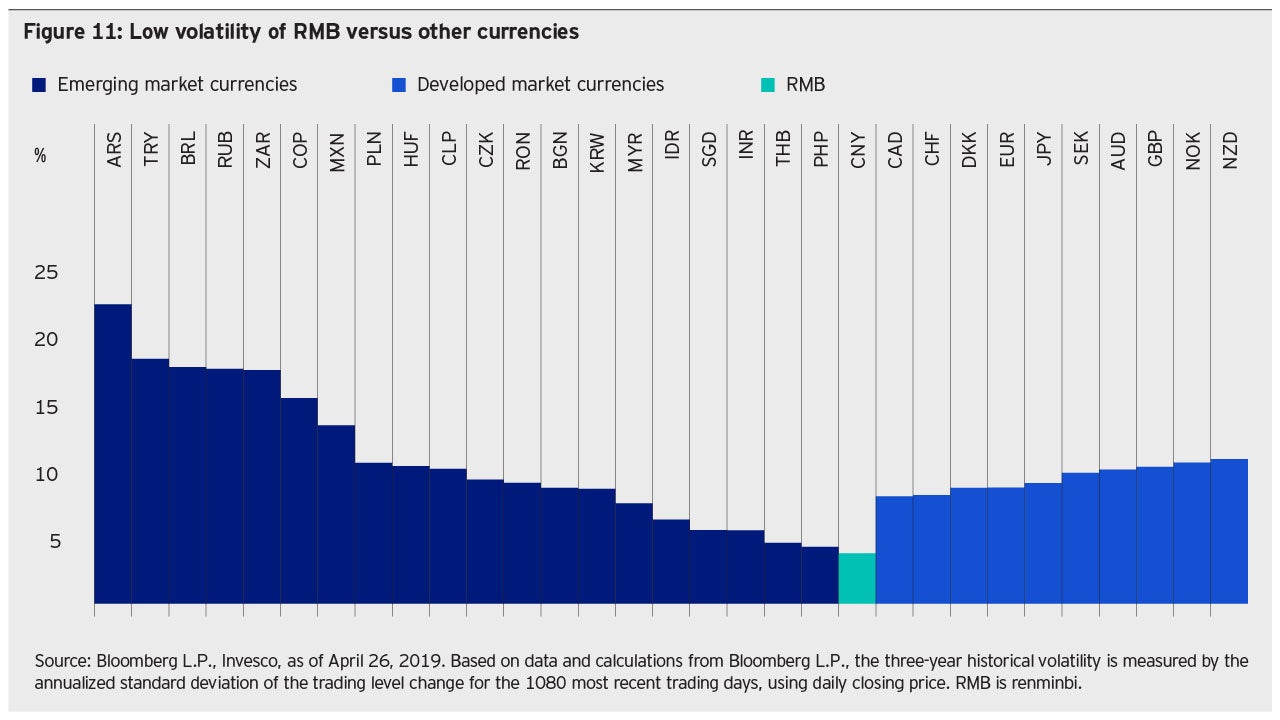
While renminbi volatility may increase as China further opens its financial markets and moves toward a less managed currency regime, we expect it to remain relatively low in the near future compared to other developed and emerging markets currencies. Our outlook is based on our expectation that (1) a relatively stable renminbi exchange rate remains a policy priority in the next few years and (2) China’s policy makers can maintain currency stability due to their independent monetary policy and a relatively closed capital account. In our view, these two features differentiate China from many other markets from a currency risk management perspective.
Deep liquidity comparable to global peers
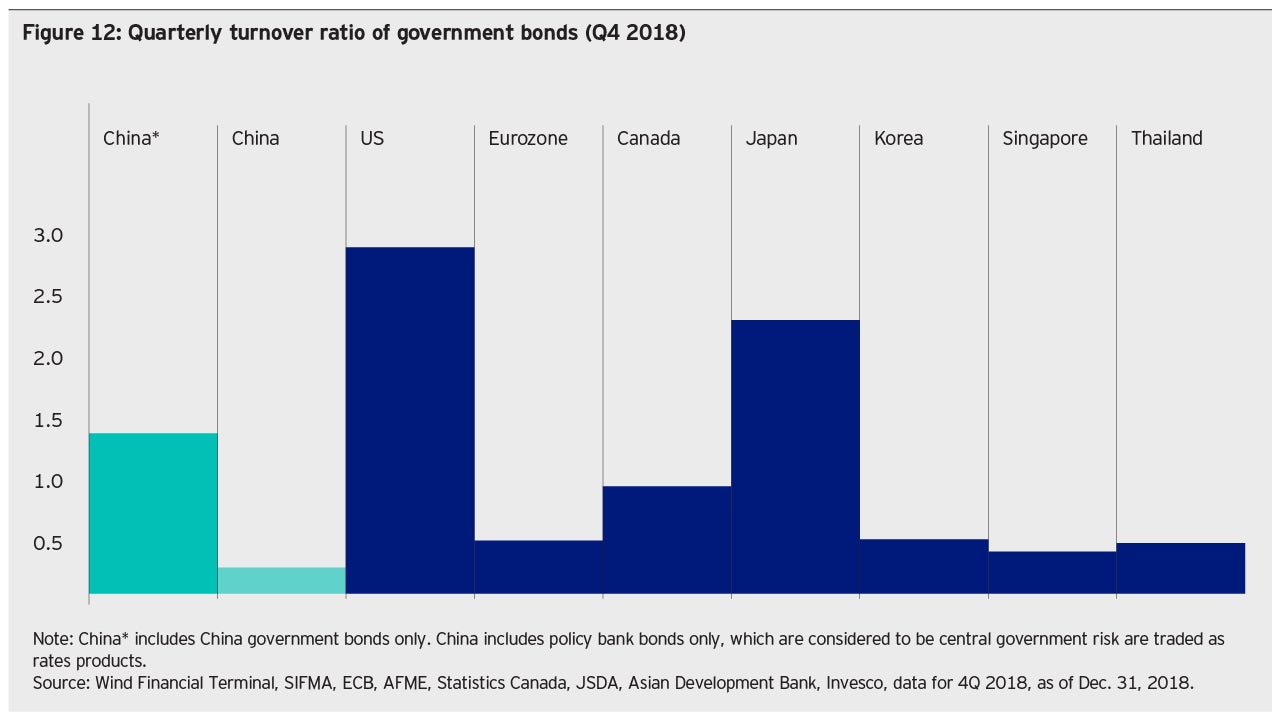
We believe it is essential for investors to assess trading liquidity before tapping a new market. Deep liquidity is especially important for investors with large ticket sizes, such as reserve managers and larger asset management companies. For active asset managers, low trading costs are key, as portfolios tend to have relatively high turnover ratios. Contrary to many investors’ perceptions, the market liquidity of Chinese onshore rates bonds is comparable to, if not better than, that of many major developed and emerging markets bonds (Figure 12). In China, bonds issued by policy banks (such as the China Development Bank, Export Import Bank of China and Agricultural Development Bank of China) are considered “rates bonds” along with government bonds. This is due to their full government backing and 0% risk weight assigned by bank regulators (i.e. no capital charge), for banks holding their bonds.
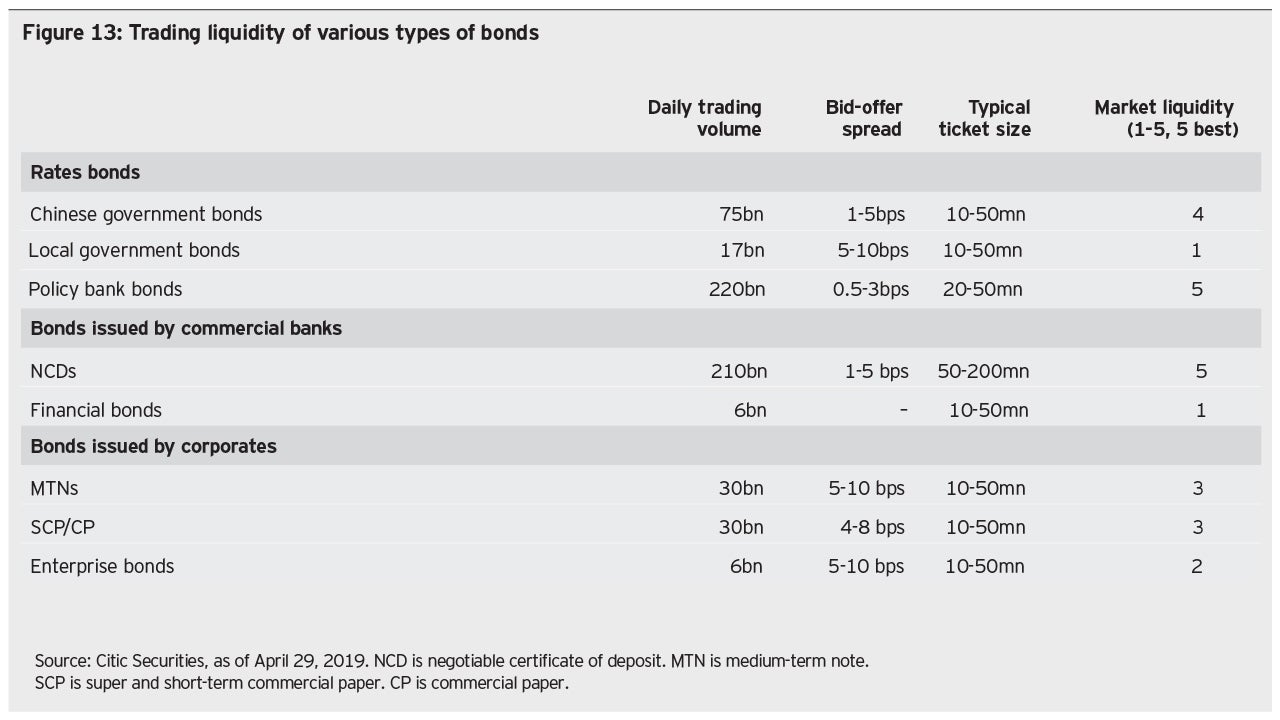
As shown in Figure 13, the liquidity of policy bank bonds and bank negotiable certificates of deposit (NCDs) is especially strong, with daily trading volume over RMB200 billion (USD30 billion); bid-offer spreads range from 1-5 basis points for CDs, central government and policy bank bonds to around 5-10 basis points for bonds issued by local governments and companies. Typical trading ticket size is between RMB10-200 million (USD1.5-30 million), although individual ticket sizes can be customized to as small as RMB100,000 (USD15,000) for foreign investors.12
Credit bonds are generally less liquid than rates bonds, with a daily trading volume of RMB30-60 billion (USD4.5-9 billion) and average ticket size of RMB10-50 million (USD1.5-8 million).12 Liquidity varies across the credit curve, with top central state-owned enterprise (SOE) bonds enjoying better trading liquidity and lower yields than lower-rated local SOEs and privately-owned companies.
What drives China’s onshore bond market performance?
Key market drivers and indicators to watch
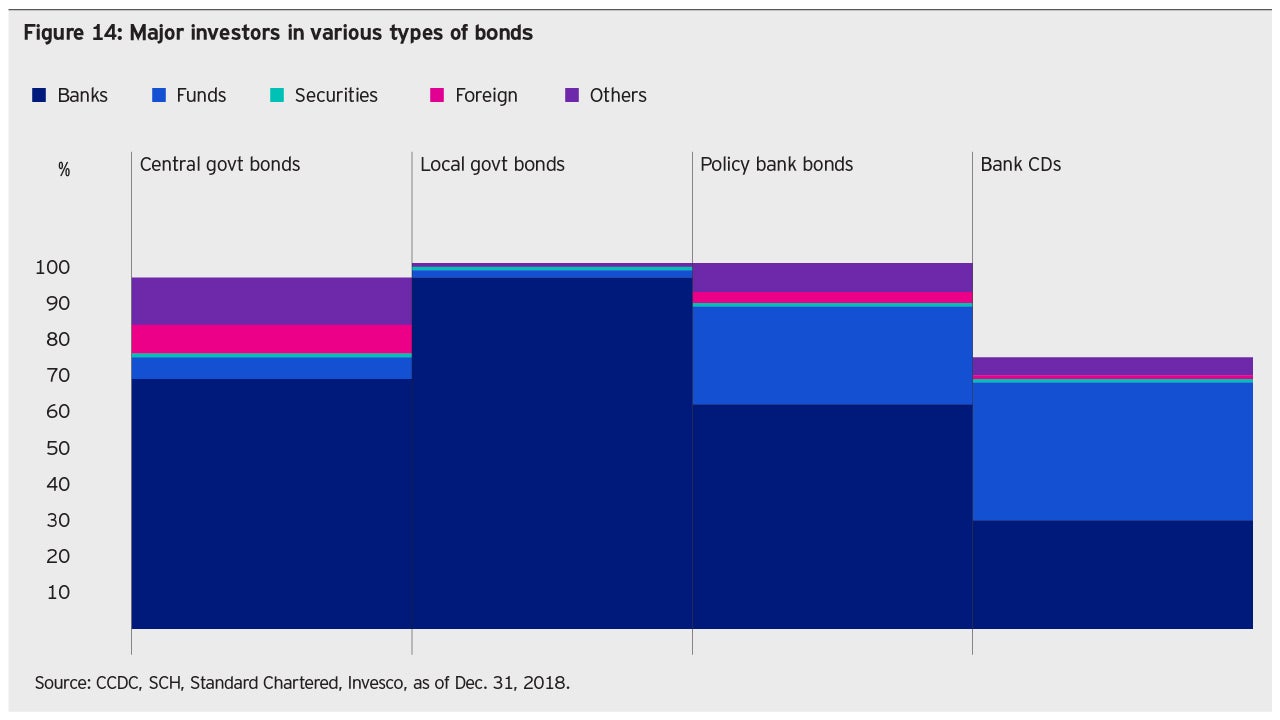
Like most bond markets in the world, growth, inflation, monetary and fiscal policy all play important roles in China’s bond market performance. In China’s case, central bank open market operations and bank regulatory measures also impact bond market supply-demand dynamics. This is because banks are the major investors in China’s bond market, accounting for over 60% of rates bond investment (Figure 14).13 Major changes in interbank liquidity or banking sector regulation could impact banks’ investment appetite and thus the bond market’s overall performance.
Investors also pay close attention to economic data, especially monthly credit data, to gauge economic momentum. Bond auction results, market liquidity levels and overall risk appetite (as reflected in equity market performance), for example, also influence sentiment in China’s onshore bond market.
Strategic and thematic approaches
Investors with different mandates and investment strategies may target different parts of the interest rate curve. As reflected in our Global Fixed Income Study, the majority ofinvestors surveyed seek strategic exposures, while one third of investors reported taking a thematic approach.
For strategic investors, long-term, high quality bonds with ample liquidity may be attractive when yields reach targeted levels. For investors looking for thematic exposure, changes in the regulatory or macro environment could bring opportunities.
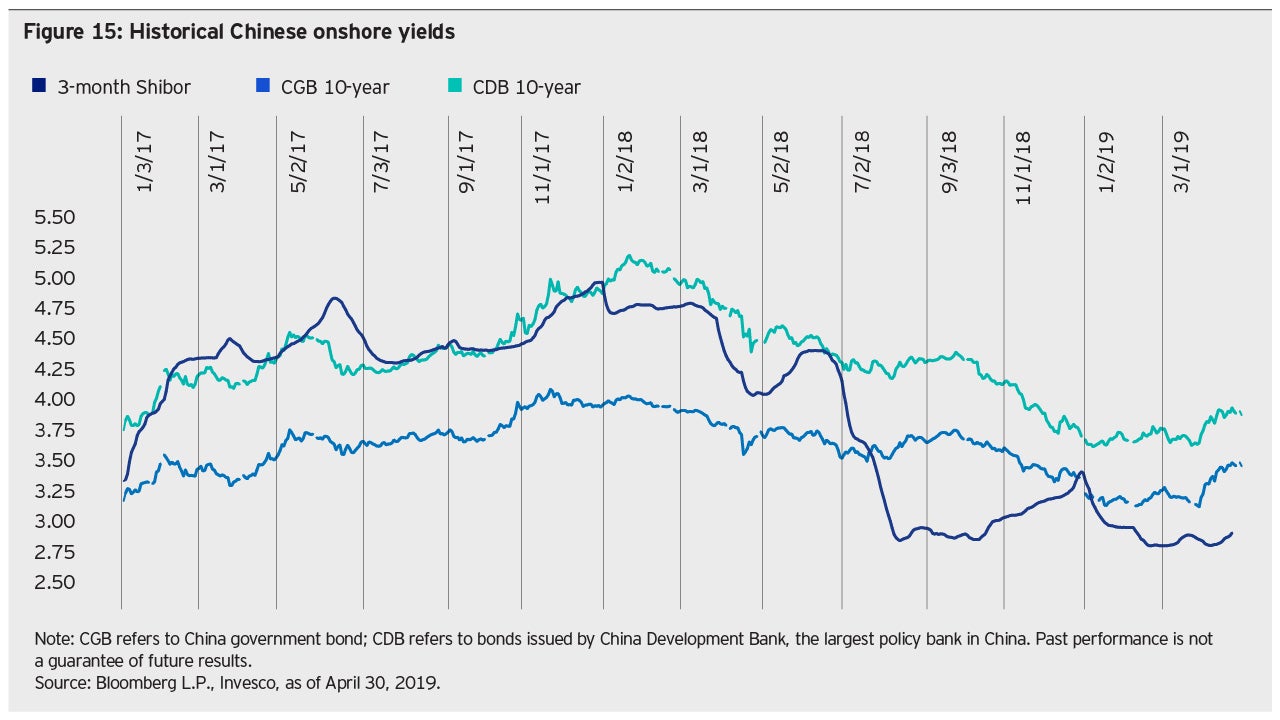
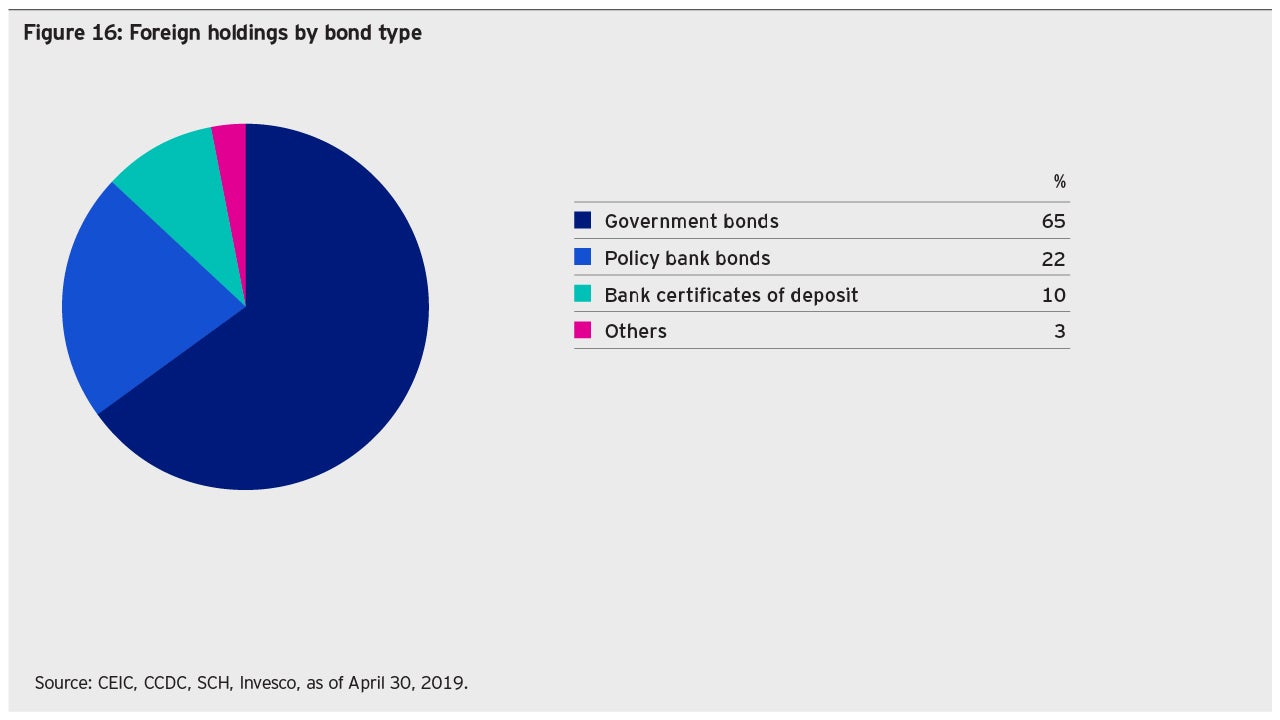
Based on our observations of foreign investor activity, demand for bank CDs was particularly strong when 3-month bank CDs traded at 4%-5% in late 2017 and early 2018 on the back of tighter regulation. Allocation to government bonds increased significantly around mid- 2018, when monetary policy began to tilt toward a more dovish stance and led to a sharp rally in government bonds. In 2019, as the credit transmission mechanism has improved, the rates market has become less rewarding, in our view, while the credit market has recently become more attractive (Figures 15 and 16).
Credit risk assessment
China’s local credit ratings start with AAA for top central state-owned enterprises (SOEs), although international ratings are A1 according to Moody’s and A+ by Standard and Poor’s, in line with China’s sovereign ratings since international corporate ratings are usually capped by the sovereign rating. In most cases, the sovereign rating is lower than a country’s local ratings, usually AAA, since central governments are considered to have the highest ability to pay in their own local currency.9
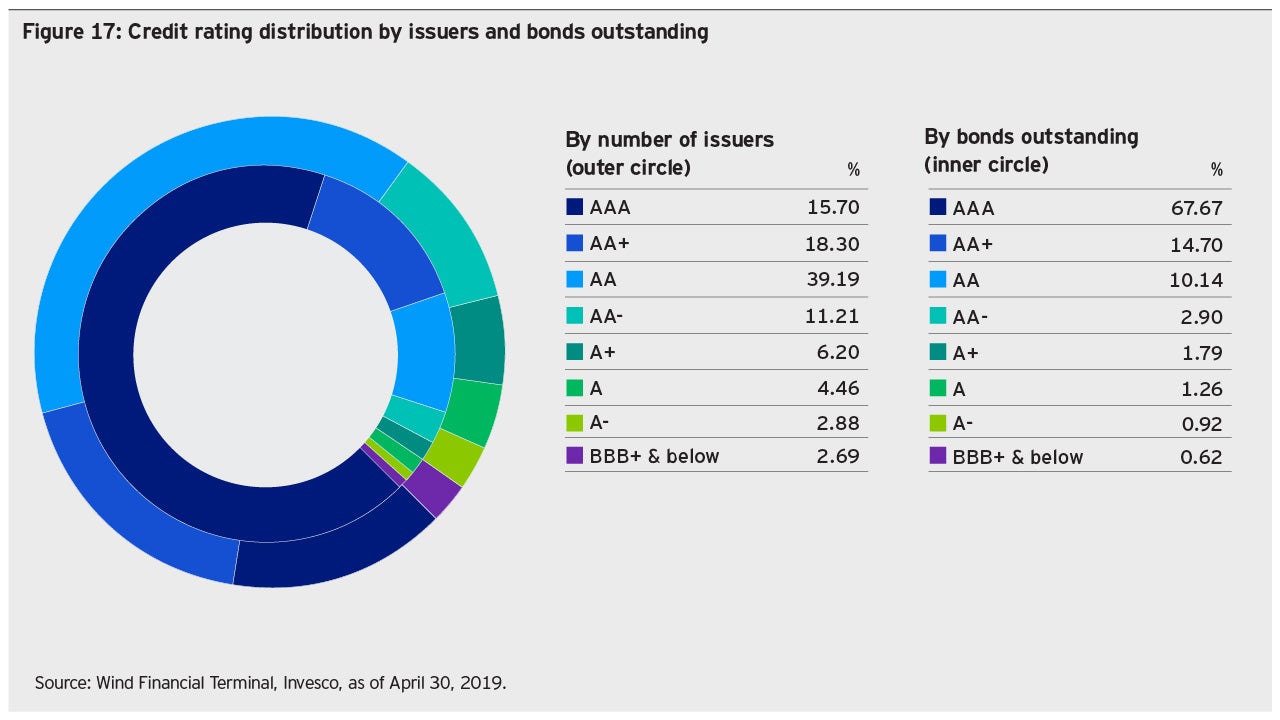
In China’s case, we concur with a commonly held view that the distribution of local ratings is skewed toward the high side. As shown in Figure 17, 15% of issuers are rated AAA, with AA+ and AA rated issuers accounting for 18% and 39%, respectively. In addition, 68% of bonds outstanding have been assigned a AAA rating. We think current differences in bond prices partly reflect investors’ differing opinions on underlying issuer credit quality, despite their similar local ratings.
Fortunately, top corporate onshore bond issuers are also active issuers in the offshore US dollar bond market whose ratings are often assigned by international rating agencies. This applies to both top central SOE issuers and lower-rated property developers, thus, investors can often utilize international ratings to assess credit risk.
For issuers who are less well-known by the offshore market, Invesco Fixed Income conducts detailed research on issuers’ industry cycles, systemic importance and standalone credit quality. Given less differentiation in local ratings and various levels of credit quality and market pricing, we believe investors with a deep understanding of the local market and strong credit research capabilities enjoy a competitive advantage.
Currency risk management
In general, investors can use either renminbi or foreign currency to invest in China’s onshore market. In addition, investors can utilize their own renminbi or convert foreign currency to onshore renminbi (CNY) or offshore renminbi (CNH) at their discretion. Under Bond Connect (a cross border bond trading and settlement system that allows overseas investors to invest in mainland China’s onshore bond market), investors can choose to hedge currency risk with settlement banks using either onshore or offshore renminbi quotes. Currency forwards, swaps, and options are actively quoted by settlement banks.
Investors can decide whether to actively or passively hedge their currency exposure and how to hedge. For reserve managers and insurance companies with natural balance sheet currency matches, there may be minimal need to consider currency hedging. For active asset managers, however, the decision to hedge depends on the manager’s view on the renminbi versus his or her base currency and related hedging costs. Investors and issuers often consider all-in yields that take into account currency hedging when comparing investment and funding opportunities between the onshore renminbi and offshore US dollar bond markets.
Relative value comparison between onshore and offshore markets
Many international investors and Chinese issuers are actively involved in the offshore US dollar bond market, which has been an important investment and funding resource in the past few years. Mainland Chinese issuers accounted for around 55% of outstanding US dollar bonds in Asia and over 70% of net supply in this market as of the end of 2018.14 Thus, Chinese onshore market funding costs can be a key factor impacting the US dollar bond market. When onshore funding costs significantly exceed offshore funding costs, for example, issuers may shift bond issuance offshore to tap the market with the lowest all-in yield.
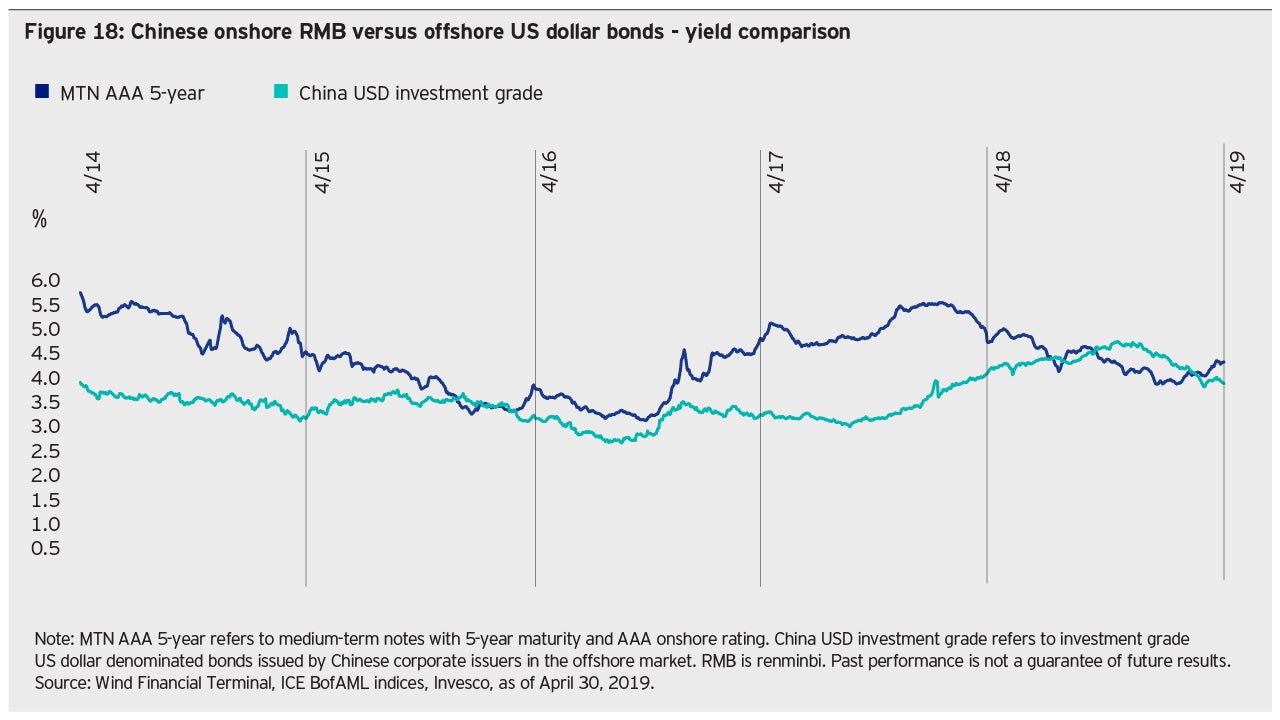
For investors, shifting supply-demand dynamics and differences in onshore and offshore market drivers may provide attractive cross-market opportunities. For example, yields on the onshore and offshore bonds of the same issuer could differ by several hundred basis points, as has been the case in the last two years (Figure 18).
The opening of China’s onshore bond market provides investors with a platform to potentially arbitrage these onshore-offshore discrepancies. We believe this arbitrage could lead to the potential convergence of yields across the two markets.
Conclusion
The process of China’s opening of its financial markets could present attractive opportunities for Chinese and foreign investors. China has made efforts to align its domestic market practices with international standards and rising foreign investment inflows could help broaden and deepen China’s engagement with global markets. China is already deeply integrated into the global economy and trade and we think it is only a matter of time before China assumes a commensurate role in global financial markets. For international investors, especially those with highly developed and competitive home markets, we believe China’s onshore fixed income market provides an opportunity to achieve more attractive yields and greater diversification. As the number of index providers that include Chinese onshore bonds in their global indices rises, we think it is crucial for global investors to understand and evaluate this vibrant and expanding market.
Investment risks
The value of investments and any income will fluctuate (this may partly be the result of exchange rate fluctuations) and investors may not get back the full amount invested.
Yi Hu is Senior Analyst with Invesco Fixed Income.
^1 Source: Invesco Global Fixed Income Study 2019, as of March 2019.
^2 Source: SIFMA, Wind Financial Terminal Financial Terminal, JSDA, BIS, HSBC, Bloomberg L.P., Banque de France, Bundesbank, Invesco, as of Dec. 31, 2018.
^3 Source: Wind Financial Terminal, Invesco calculation, as of Dec. 31, 2018.
^4 Source: Bloomberg L.P. index announcement, “Details on the Upcoming China Inclusion to Bloomberg Barclays Indices”, Feb. 11, 2019.
^5 Source: Bloomberg L.P. index data, Jan. 31, 2019.
^6 The exchange market is one of two bond markets in China, the other being the interbank market. Listed companies can issue corporate bonds in the exchange market, which accounts for less than 10% of issuance and trading.
^7 Assuming an annual growth rate of 20% for the next three years, 10-20% ownership of central government and policy bank bonds leads to an estimated USD700 billion–USD1.5 trillion. Opinions are those of the author and are subject to change at any time due to change in market or economic conditions and may not necessarily come to pass.
^8 Source: Bloomberg index announcement, “Details on the Upcoming China Inclusion to Bloomberg Barclays Indices”, Feb. 2019. FTSE Russell Factsheet, March 31, 2019.
^9 Source: CEIC, Wind Financial Terminal, Invesco, as of Dec. 31, 2018.
^10 As illustrated in Fig. 7. Source: CEIC, CCDC, SCH, Invesco, as of April 30, 2019.
^11 As illustrated in Fig. 8. Source: Wind Financial Terminal, Bloomberg, Invesco, as of April 30, 2019
^12 Source: Citic Securities, as of April 29, 2019; China Interbank Bond Market Handbook by China Foreign Exchange Trade System, as of January 2019.
^13 As illustrated in Fig.14. Source: CCDC, SCH, Standard Chartered, Invesco, as of Dec. 31, 2018.


