Distorted market valuations mask compelling opportunities

It is worth remembering that valuations tend to be distorted in a post-recession world, but while economies recover from the COVID-19-related ‘sudden stop’, there are opportunities to be found.
Valuations tend to be distorted in recessionary periods as earnings contract. However, it is useful to remember that equity prices tend to behave as a leading indicator of economic activity, as market participants are constantly looking to tease out the future direction of stocks and discount their prices to today. While relative valuations can point to cheaper (or less expensive) opportunities, this does not necessarily conclude their future potential.
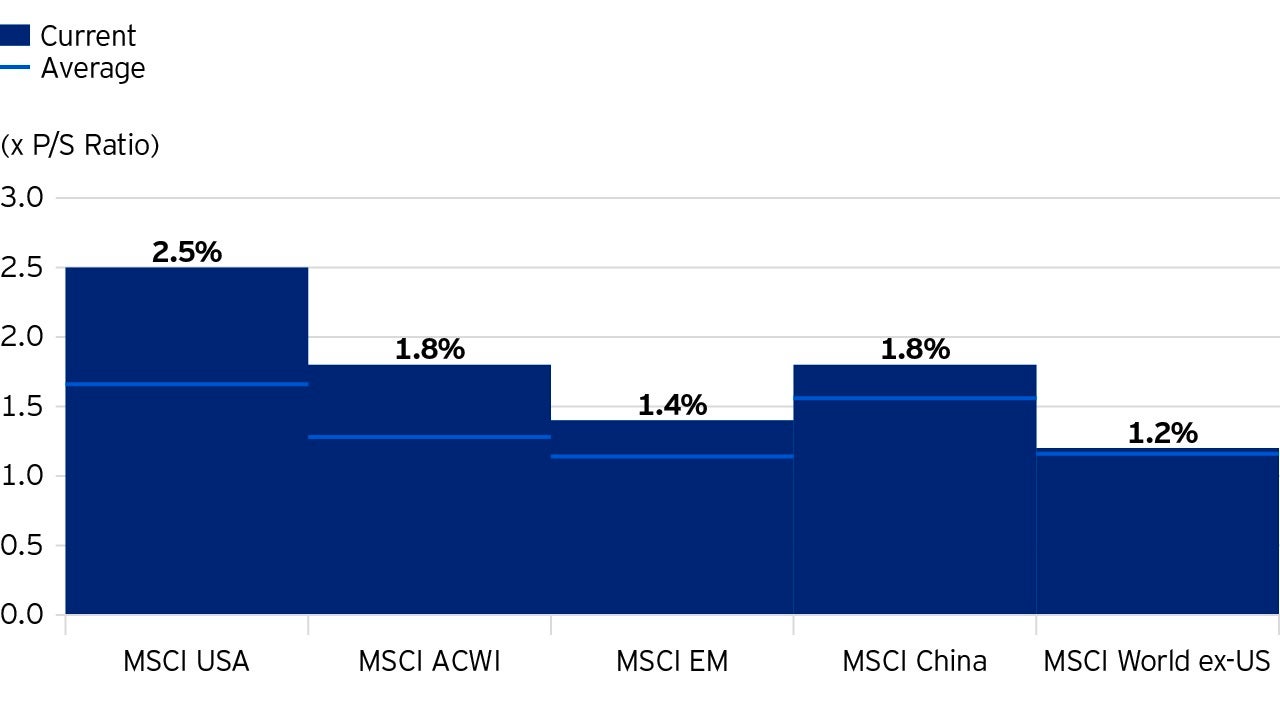
Following a high-velocity selloff and subsequent v-shaped rebound, US stocks have surprisingly clung to their status as one of – if not the most – overvalued market segments of the developed world. Indeed, US and developed market price-to-sales (P/S) ratios are trading at notable premia relative to the global benchmark and history. In our view, unprecedented policy support has encouraged extreme risk-taking by investors, a consequence of which has been frothy valuations in US stocks.
With the fight against the pandemic raging, the world has gone through a cycle’s end-and-rebirth in fast-forward. What would normally happen over the course of several quarters or years has been condensed into just a few months.
Accelerated economic contraction resulting from government-imposed lockdowns brought with it the commensurate see-saw in asset prices as businesses faced – and continue to grapple with – loss of revenues. In financial markets, massive amounts of money churned out of ‘risky’ assets and into sovereign bonds and money market funds.
Popular sovereign bond trades have risen steeply in price – the US 10-year yield quickly fell from 1.63% on February 12 to 0.67% at the end of March, where it remains. German bunds dove deeper into the negative, registering a low of -0.86% on 9 March before recovering to today’s level around -0.50%. Option-adjusted spreads, a measure of credit risk and distress, blew out.¹
In the US, corporate high yield credit spreads climbed from their 10-year average of 542 basis points to 1100 basis points in late March. Equities across the globe fell markedly, with the MSCI World down -31.7% at its nadir and most major market indices posting similar lows.¹
It was not until the US Federal Reserve and other major central banks intervened that asset prices began to slow their freefall. Prices finally began to recover only after the CARES Act in the US was passed, along with fiscal programs across a variety of economies.
Government action staid markets and rejuvenated prices. However, earnings have yet to make a similar recovery, sending valuation metrics such as the price-to-earnings and price-to-sales ratios soaring.
Investors that remained on the sidelines throughout this period missed numerous buying opportunities. Sovereign bonds remain expensive and corporate credit has been buoyed by government guarantees. Equities and real estate, which at first suffered dramatically, have also recovered in a V-shape.
When viewed on a basis relative to longer-term averages, valuations across major asset classes seem stretched, and yields are largely below their long-term averages.
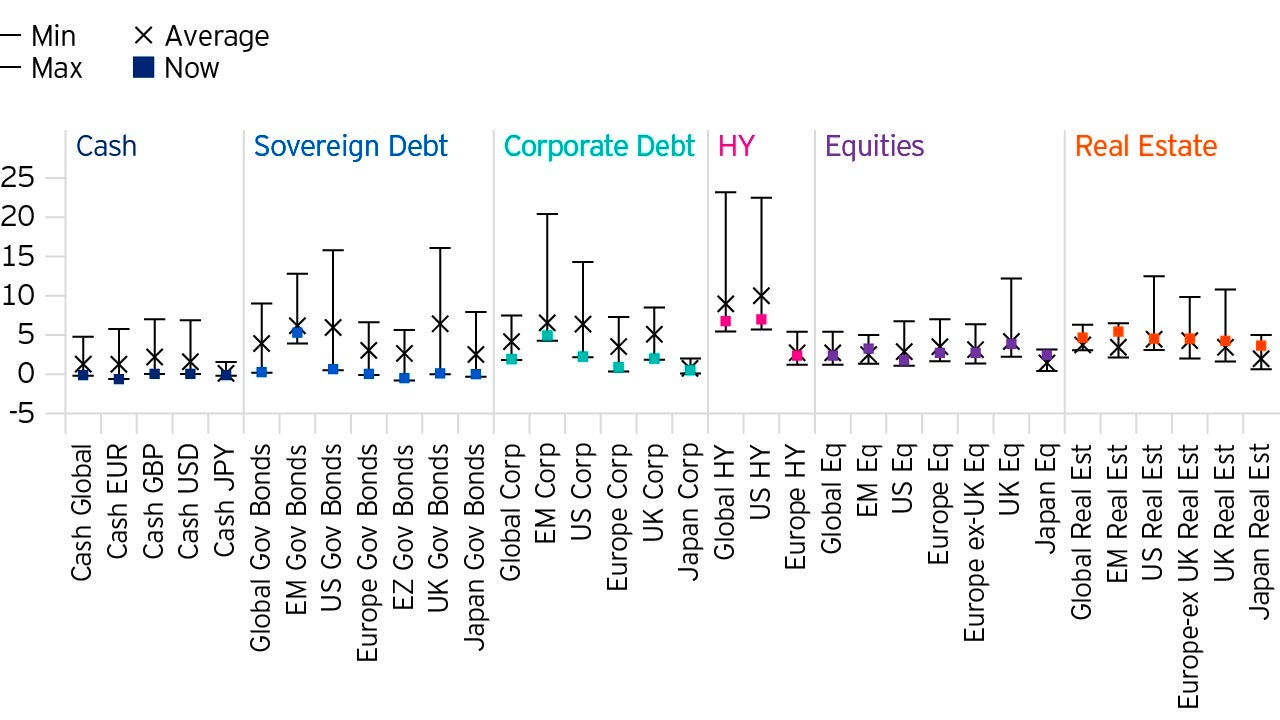
However, while valuations may appear stretched and yields low, it is important to view assets not just in comparison to their longer-term behavior, but also against their post-recession performance. For example, higher stock valuations following a recession are reflective of a higher risk premium, emphasized by the fact that sovereign bonds appear expensive.
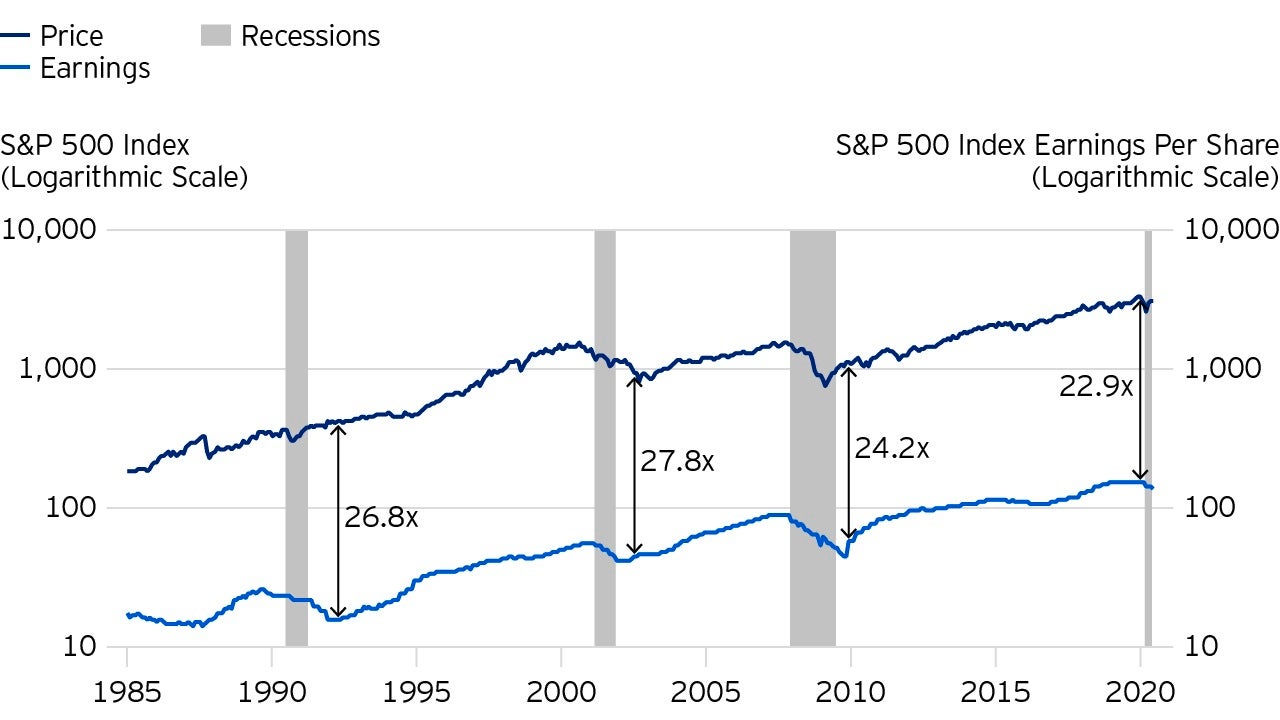
Indeed, earnings yields have fallen substantially, as is typical in recessionary periods, while equity markets have priced in a recovery on the backs of government support and improving macro data. This effect raises the numerator, prices, while earnings and sales, the denominators, fall, leaving stretched valuations.
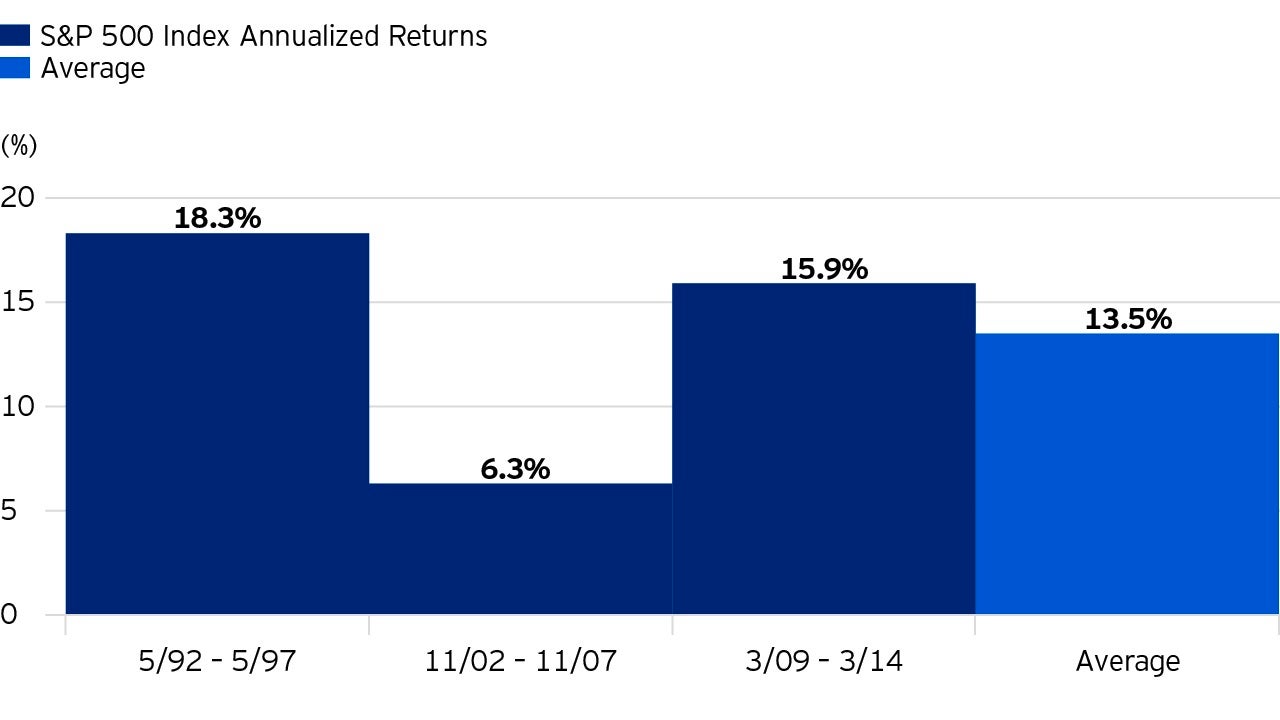
In the US, for example, buying the composition of the S&P 500 at the peak readings of the price-to-earnings ratio after recent recessions would return, on average, an annualized 13.5% over the following five years.¹
Further opportunities exist outside the US. Today, companies headquartered outside of the US are trading at lower premiums on a price-to-sales basis than are companies domiciled in the US. Developed market companies, excluding the US, are trading at valuations that are near average. In addition, when developed market equities are viewed relative to emerging market stocks, emerging markets appear persistently undervalued.
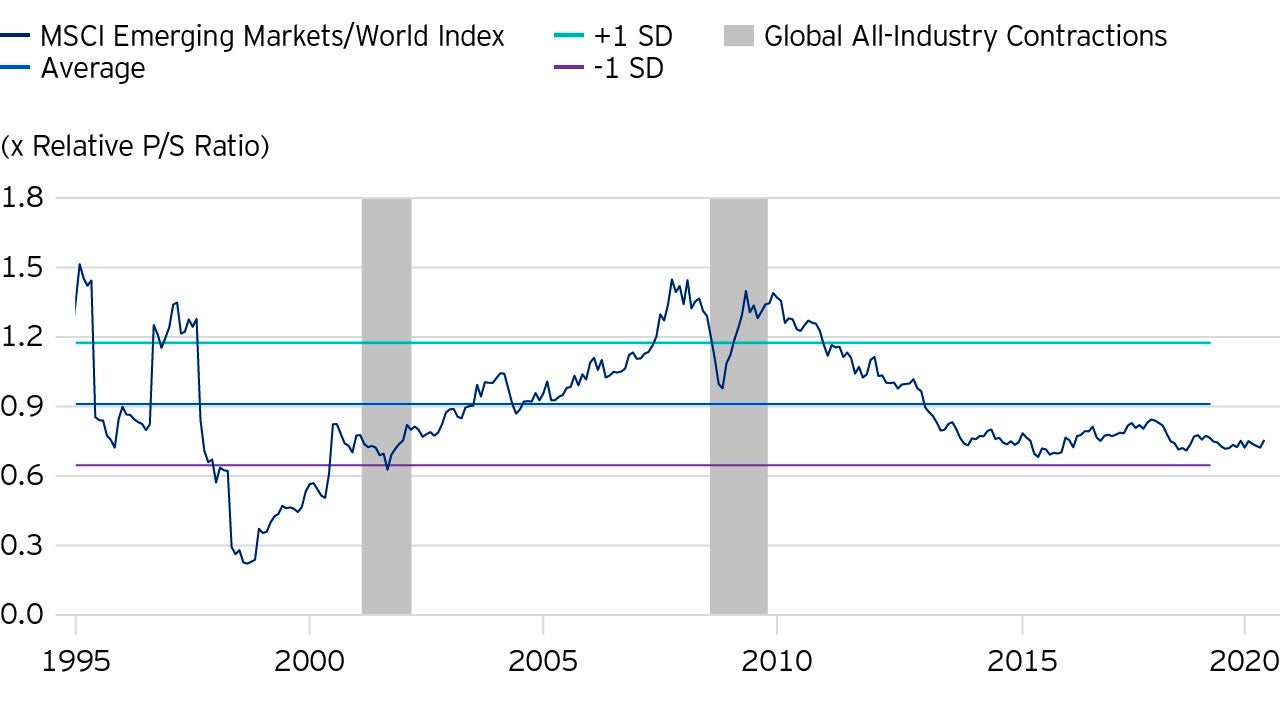
While valuation is a good starting point for an investment thesis, it isn’t enough on its own. Indeed, cheap valuations require catalysts to unleash the potential opportunities embedded in share prices. On that score, leading indicators of business activity across the emerging world – China and South Korea in particular – have been proving more resilient than those of the developed world, including the US, Europe, Japan and Canada.
We believe compelling opportunities exist for investors in EM stocks at a time when many emerging economies – especially Asia excluding Japan – are recovering from the virus-related “sudden stop” in activity. Attractive valuations and improving economic growth could be a powerful combination for unlocking the potential rewards presented by EM stocks and, so far, they appear to be working.
As we have discussed, valuations tend to be distorted in recessionary periods as earnings contract. It is useful to remember that equity prices tend to behave as a leading indicator of economic activity, as market participants are constantly looking to tease out the future direction of stocks and discount their prices to today. While relative valuations can point to cheaper (or less expensive) opportunities, this does not necessarily conclude their future potential.
Related articles
Find out more about the valuation opportunities we see
Investment risks
-
The value of investments and any income will fluctuate (this may partly be the result of exchange rate fluctuations) and investors.
Important information
-
¹Source: Bloomberg, 30 June.
Where individuals or the business have expressed opinions, they are based on current market conditions, they may differ from those of other investment professionals and are subject to change without notice.

