
Three scenarios for the Covid-19 outlook
John Greenwood. Chief Economist, Invesco Ltd and Adam Burton. Assistant Economist
Key takeaways
1. When the coronavirus is finally contained, there is likely to be a relatively strong recovery back towards previous levels of activity – base case scenario.
2. However, the upturn in unemployment is likely to continue until restrictions on businesses and the overall population are eased, and eventually lifted.
The outlook for financial markets and the global economy are inextricably linked to the ongoing battle to contain and eventually find a vaccine for Covid-19.
Three crises
We have highlighted previously that there are really three crises that need a response to ensure more normally functioning financial markets and an exit for the economy that is as smooth as feasible from the current pandemic:
1. There is a public health crisis that needs to be addressed
The vast majority of countries have adopted social distancing policies and other restrictions on mass gatherings, including the closure of most businesses, in order to “flatten the curve” of infection and restrict the virus from spreading.
Tentatively we can say that this approach has helped to some degree, as most countries now are seeing daily numbers of new cases stabilising, and in some cases falling.
However, if like other highly contagious diseases throughout history, this is merely the first wave of many, the current public health crisis will only be resolved by the development of a proven, reliable, and effective vaccine that is mass-produced.
Until such a vaccine is available, we are likely to see continuing restrictions affecting specific activities in most countries with a corresponding impact on economic growth.
2. Disruptions to the economy
Brought about by the widespread lockdowns in response to Covid-19 needed a response from the fiscal authorities to support firms and households during the period while the real economy was shut down.
Examples of actions that have been undertaken include loans and cash grants for businesses, tax deferrals, interest holidays, wage subsidies, increased unemployment benefits for workers who have lost their jobs, and increased spending on healthcare.
These measures were essential as corporate cash flows have come under significant pressure from the coronavirus pandemic, leaving businesses and employees starved of cash.
More work needs to be done in this area, however, as some of these programmes are not yet online, while others still require refinements to ensure smoother delivery.
3. Financial markets began to break down as a result of a flight to cash and serious episodes of illiquidity
This happened across the full range of risk markets during late February and early March and was characterised by wider spreads, heightened volatility, and erratic price movements driven by margin calls or fund redemptions.
There were many reasons for the breakdown in financial markets, but one of the clearest statements came from James Sweeney and Zoltan Pozsar at Credit Suisse.
As they put it: “The supply chain is a payment chain in reverse…”
Economic activity has collapsed as a result of Covid-19, placing substantial strain on money markets, and especially on US dollar money markets.
This is because the dollar is the currency used most frequently to finance trade, global supply chains, and capital movements.
In turn this meant that the Federal Reserve (Fed) had more to do in stabilising money markets as the ultimate provider of dollars to the global economy.
To achieve this stability, the Fed re-established several facilities from the crisis of 2008-09 - and created some new ones - to supply credit to the economy and help alleviate dollar funding stresses.
In addition, the Fed increased its balance sheet substantially, purchasing primarily US treasury securities, increasing its offerings of repo facilities to US$1,500 billion each day, and re-established and expanded US dollar swap lines with fourteen central banks across the global economy.
These measures have calmed markets by increasing liquidity, as evidenced by interest rate spreads returning to slightly more normal levels (although many spreads are still at elevated levels).
Bringing all of this together, we outline three possible scenarios (base, optimistic and pessimistic) for the medium-term growth of the US economy, and we comment on the trajectory for inflation.
To do this, we have constructed three plausible cases, which are fundamentally based upon the success or otherwise of efforts to contain Covid-19 and then develop a vaccine for it.
It is also true that the responses of the fiscal and monetary authorities are important, but we see the public health response as primary, and the economic and financial response as secondary.
The analysis here is focused on the US economy, as economic data in the US is timelier than other developed economies, but can be applied more generally.
Base case
In the base case, fiscal and monetary authorities continue to support the global economy, and the time taken to develop a vaccine for Covid-19 is around 12-18 months.
This is in line with consensus expert opinion and will mean that restrictions of some sort will remain in place throughout this time period.
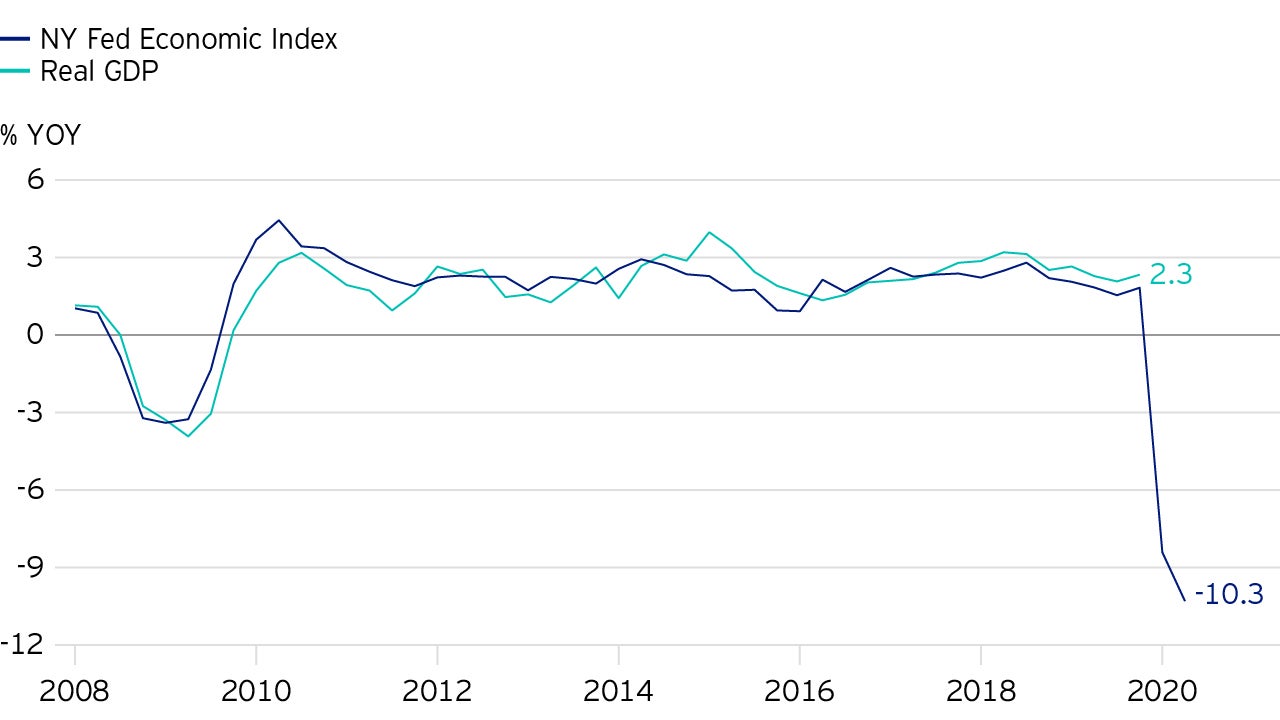
After a sharp decline in real GDP growth in the first half of 2020 (current indicators from the New York Fed put real GDP growth at around -8½% year-on-year in 2020 Q1, (see Figure 1), real GDP growth is likely to remain subdued until the public health crisis is resolved.
The contraction in economic activity is likely to be even worse in 2020 Q2.
However, when the coronavirus is finally contained there is likely to be a relatively strong recovery back towards previous levels of activity, supported by loose monetary conditions and a variety of interim government programmes.
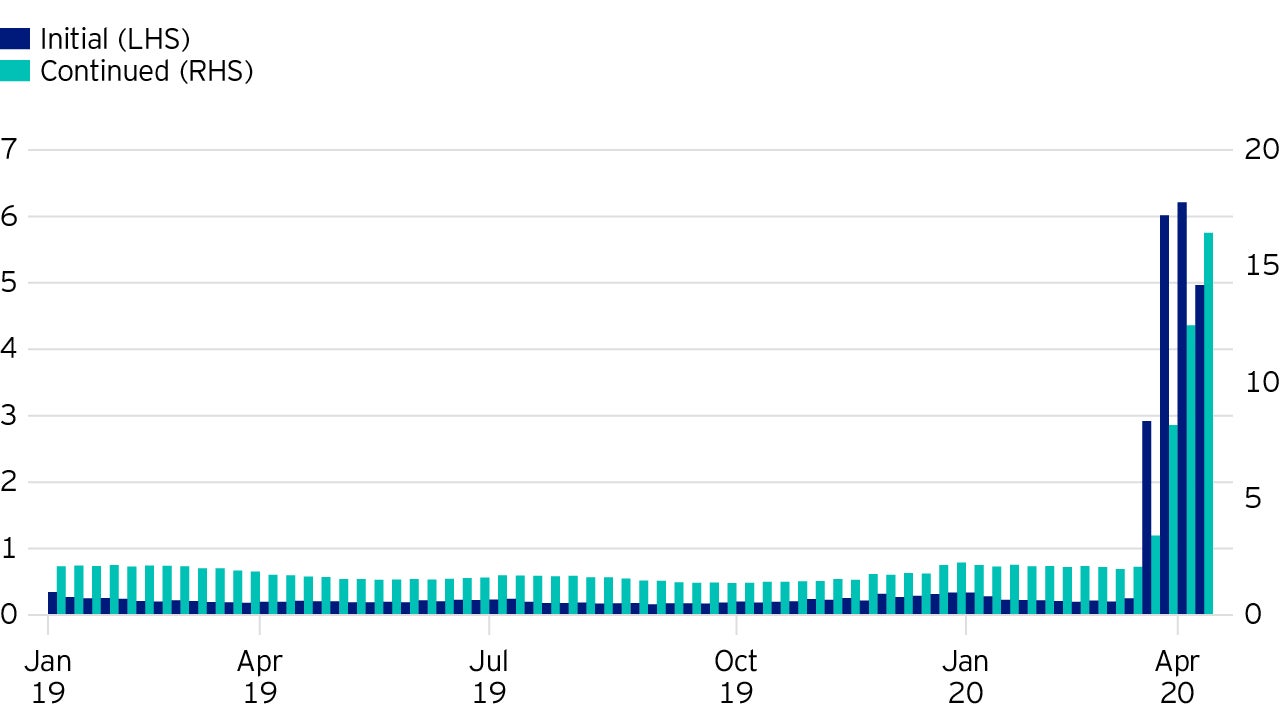
Similarly, unemployment is likely to spike dramatically in 2020, as already evidenced by the extraordinary number of weekly initial jobless claims.
Since late March, around 22 million people have filed for unemployment insurance in the US (see Figure 2), effectively the same amount of jobs that were created during the entire business cycle expansion between 2009 and 2019.
The upturn in unemployment is likely to continue until restrictions on businesses and the overall population are eased, and eventually lifted.
It is not unreasonable to believe that the headline unemployment rate could reach significantly over 10% in 2020, with the Federal Reserve Bank of St Louis forecasting a potential unemployment rate of 32%. (Find out more).
It should be noted that due to the nature of Covid-19, and the possibility of second and third waves of infection, there is a high degree of uncertainty about the medium-term outlook.
Reflecting this, there is inevitably a large margin of error in any forecast.
All we really know is that indicators of real economic activity are likely to be extremely depressed in the short-term.
Aside from the base case scenario, we outline both optimistic and pessimistic scenarios for real GDP growth.
Whether a case is relatively optimistic or pessimistic compared to the base case depends on the restrictions in place, which ultimately depends on daily new cases of Covid-19 and development of a vaccine.
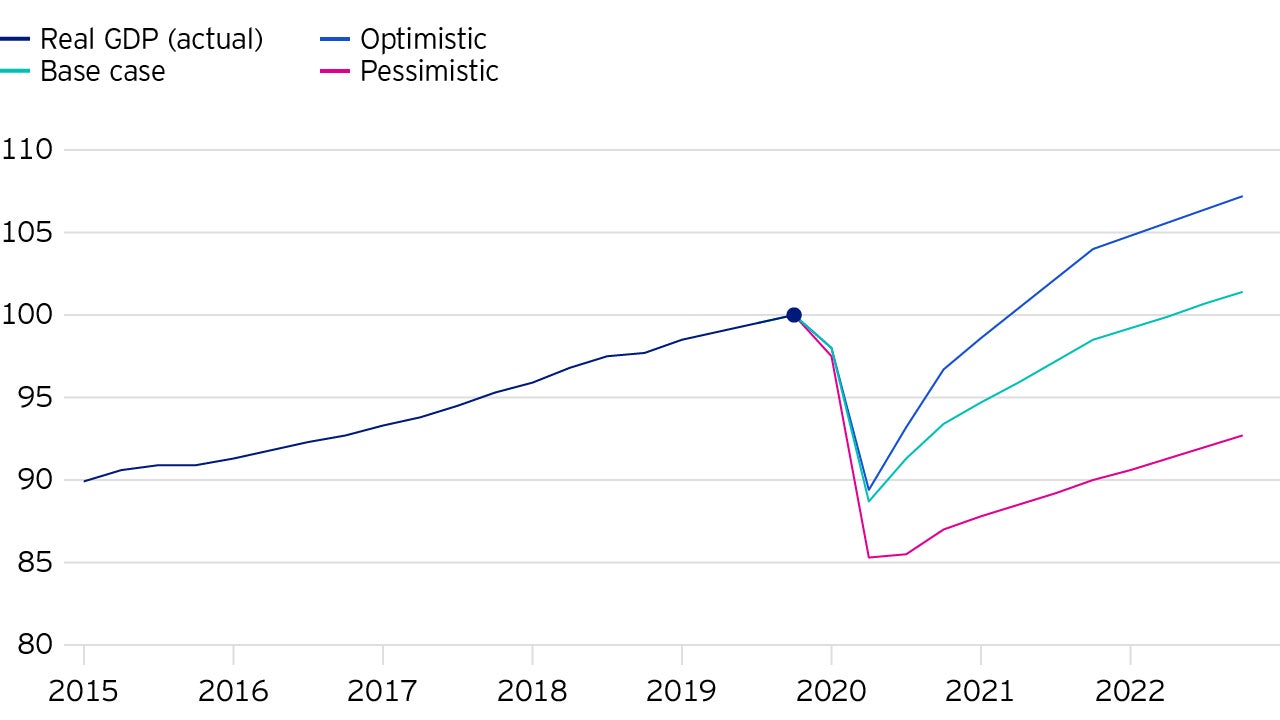
In Figure 3 we highlight all three cases.
In the base case, real GDP growth bottoms in 2020 Q2 at around -35% (measured quarter-on-quarter at a seasonally adjusted annualised rate), before gradually returning to its pre-Covid-19 growth trend in late 2021, although its level will be lower than its previous trajectory.
The subsequent rebound in economic growth is spread over ten quarters.
As we pass through 2020 and into 2021, social restrictions and restraints on different sectors are forecast to be gradually reduced, progressing from the halting of all non-essential activity (a state where, for example, the UK currently finds itself) to sectoral restrictions and social distancing of more vulnerable persons.
Restrictions of some kind are likely to persist until a vaccine is developed.
In the optimistic case, the Covid-19 pandemic lasts for a shorter period, with a correspondingly shallower recession.
In a very optimistic scenario, the current (first) wave of the virus will be the only wave, and social restrictions will be loosened sometime in 2020 Q2.
This leads to a quarter-on-quarter annualised contraction of perhaps 35% in 2020 Q2, before a relatively robust recovery, with economic activity returning to its pre-crisis level in 2021 Q2.
The pessimistic case
This is the most difficult to forecast, the Covid-19 pandemic lasts for significantly over a year, and the recovery to trend growth once the public health crisis is resolved and restrictions are eventually lifted is slow and staggered.
Real GDP growth could easily fall in excess of 50% quarter-on-quarter (at a seasonally adjusted annualised rate), and for multiple quarters as the real economy continues to be locked down.
Finally, it must be restated that due to the nature of the Covid-19 pandemic, we are in a period of what former Bank of England Governor Mervyn King calls “radical uncertainty”.
This means there is complete lack of knowledge about the level of uncertainty in the medium-term.
It is for this reason that what is really important is not the estimated numbers for recovery quarter by quarter, but rather the overall “shape” of the recovery.
Why are we assuming a relatively strong recovery back to trend growth once the public health situation has been resolved?
This is where the other two pillars of the response to Covid-19 are important.
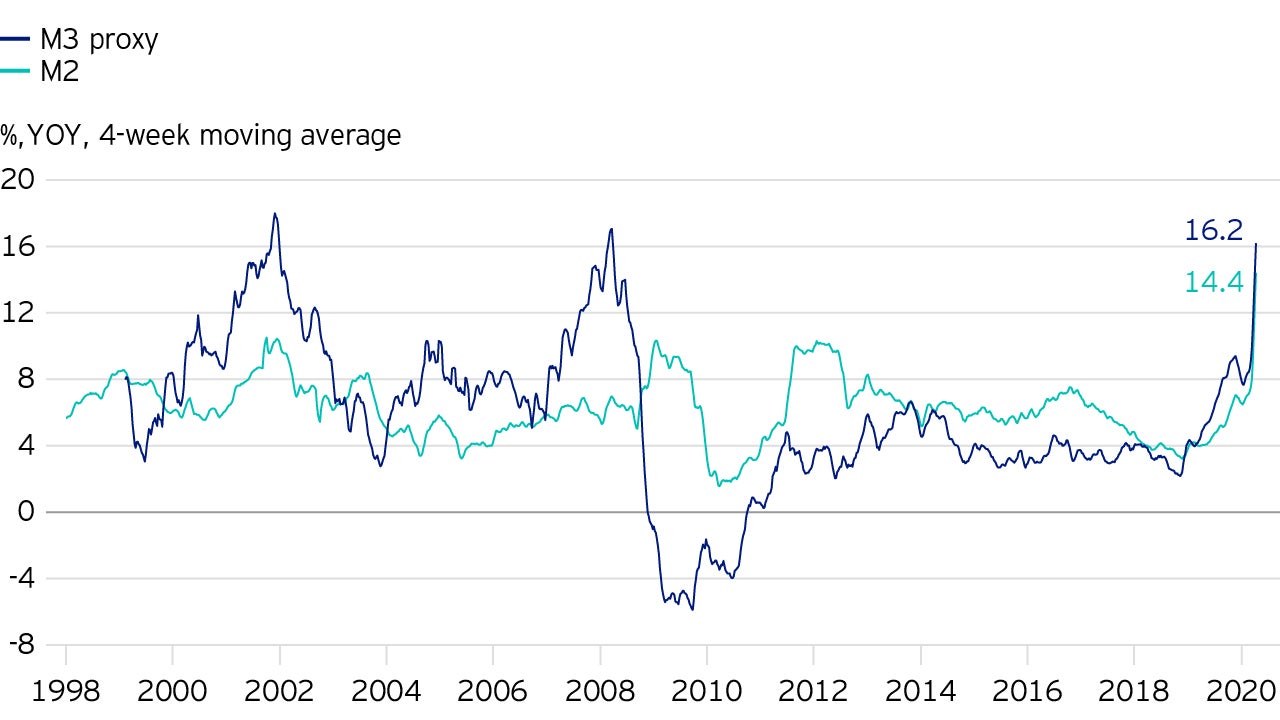
There has been an impressive coordinated effort between central banks and governments (especially the Fed and the US Treasury), with central banks boosting liquidity and broad money growth while governments have been helping to reduce adverse effects on the real economy.
This has led to dramatic increases in official measures of money such as US M2, as well as in our measure of US broad money (M3) as shown in Figure 4.
Together these surges in potential purchasing power, combined with the easing of restrictions on personal activity, should provide ample support for a vigorous recovery in economic growth - assuming the defeat of Covid-19.
Moving on the future trajectory of inflation, the key question to be answered is how the federal deficit is to be financed.
Funding a budget deficit
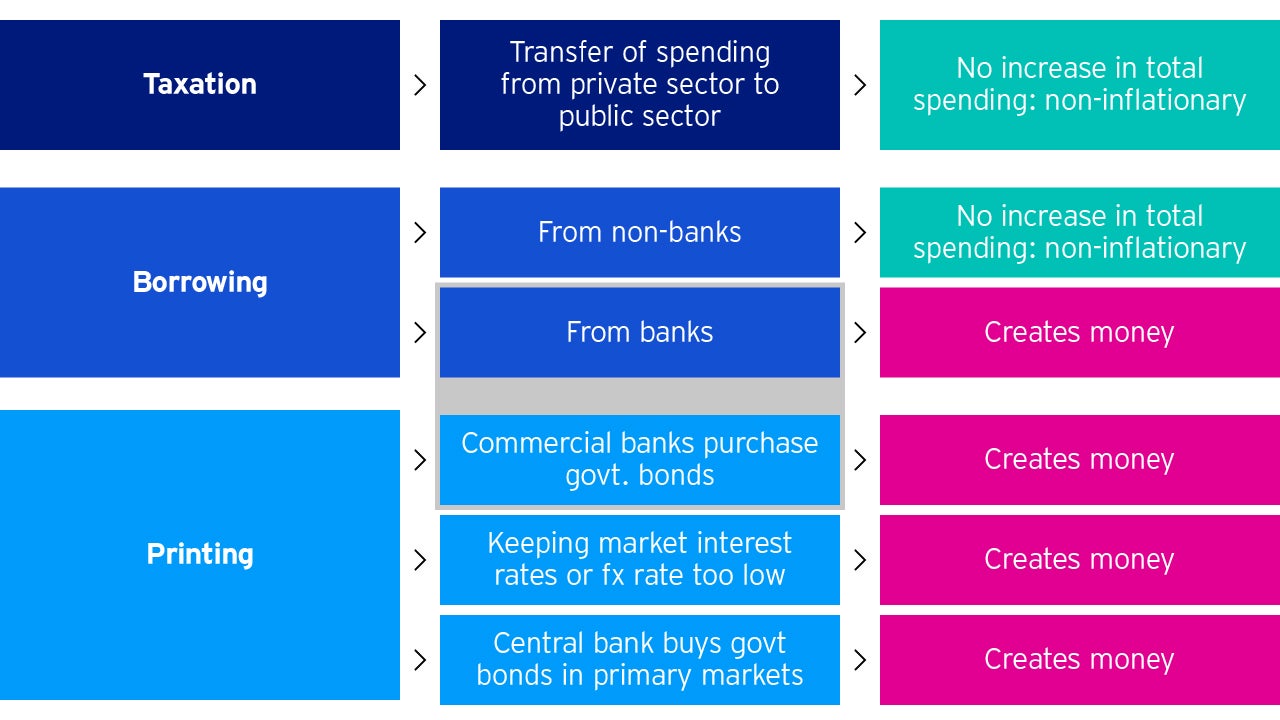
In principle, there are only three ways to fund a budget deficit: taxation, borrowing or printing.
The three options and their implications are set out in Figure 5.
Taxation
A direct transfer from private sector to public sector with no gain in overall spending, so it is non-inflationary.
In current circumstances, with Donald Trump as President and the Republican Party holding a majority in the Senate, it is highly unlikely that significant new taxes will be introduced to finance budget deficits.
We therefore set aside taxation as a meaningful avenue for funding the imminent federal budget deficits and debt.
Borrowing
A non-inflationary only if the funds are borrowed from real savings or asset pools at home and abroad.
In principle this means selling new Treasury bill and bond issues to “real money” investors, but not to banks (see Figure 5).
In the domestic sphere “real money” investors include insurance companies, pension funds, mutual funds, US corporates and individual savers.
Foreign “real money” buyers would include a diverse range of non-US savings institutions including but not limited to Asian insurance companies, European pension funds, sovereign wealth funds, and foreign central banks.
However, if the increased deficit is financed largely by selling the new debt to banks in the US, this will be potentially inflationary since it creates money.
(Remember, it is money that creates inflation, not debt - look at Japan over the past 30 years.)
The reason is that, fundamentally, when a bank makes a loan it writes up the loan as an asset and simultaneously credits the deposit account of the borrower.
Deposits are money so this creates new money.
Similarly, when a bank purchases a security, it acquires a new asset, and simultaneously credits the deposit account of the seller (in this case the federal government).
This process was in operation in the US in 2019.
With the doubling of the federal deficit to roughly US$1 trillion (as a result of the tax cuts of 2018), and the Treasury switching funding tactics to issue many more Treasury bills, US banks bought significant amounts of US government securities, creating money, and in the process doubling the rate of M2 money growth from 4% to 8% p.a.
This was the primary driver of the strong bull market in equities from September 2019 until February 2020. If the boost to money and spending had continued and Covid-19 had not occurred, it was our forecast that nominal GDP and inflation would have been rising by late 2020 or early 2021.
It follows that in 2020-21 and beyond, the US authorities will need to manage carefully the amount of bank purchases of government debt if they are to limit broad money growth, and hence avoid any inflationary consequences from the greatly enlarged Covid-19 deficits.
“Printing money”
A crude expression that has three possible interpretations.
First, as explained above for the US last year, substantial purchases of government securities by the banks can amount to money creation.
Second, “printing money” can result from a policy of either keeping market interest rates too low so that banks are encouraged to lend more than they otherwise would.
Alternatively, in a fixed exchange rate regime (which does not apply for the US), keeping the exchange rate too low (i.e. undervalued), can generate a surplus on the overall balance of payments that produces an influx of funds from abroad.
Both more lending and an inflow of funds from abroad create additional deposits (equals money) on the liability side of bank balance sheets.
In current circumstances we judge these possible outcomes as unlikely - at least for a year or two.
Third, “printing money” can mean central bank purchases of government securities in the primary market (buying bonds directly from the government) which is what we typically see in countries like Venezuela and Zimbabwe.
However, in modern economies such practices are either specifically prohibited by law or prevented by means of independent central banks which are assigned mandates to keep inflation low.
In summary, such crude “printing” of money is therefore unlikely, but the possibility cannot be completely ruled out.
[Note that Quantitative Easing or QE in the US and the UK after the 2008-09 crisis was not a purchase of bonds directly from the government. Rather it comprised purchases of securities already held by the private sector – i.e. by “real money” investors.]
Evaluation of the inflation outlook
Although US bank lending, deposits, money supply (M2) and broad money (M3) have all grown rapidly since early March, we view this as primarily a once-for-all consequence of the drawdown of credit lines by US corporations.
Out of a total increase in “Loans & Leases” of US$600 billion in the same period, we estimate that approximately US$400 billion was due to credit lines being activated.
There is clearly huge uncertainty about the growth of lending or bank deposits over the next few months, but if after the liquidity squeeze of the current emergency personal and corporate behaviour is able to return to more normal patterns, the temporary monetary surge need not translate into inflation.
In the past it has always required an extended acceleration of money and credit growth to generate a significant shift in the pattern of inflation.
For the present the huge increases in unemployment, the collapse in commodity prices such as oil and gas, and the widespread uncertainty about the future will likely translate into a deflationary environment in the short term.
Only after the economy and employment have recovered and been on a recovery path for at least a year would inflation start to become an issue.
If, by then, the growth rates of money and credit had slowed to more normal trajectories, then the impact on inflation could well be quite subdued.
All that we can confidently say at present is that the inflation outlook will depend heavily on the degree and duration of monetary acceleration over the next couple of years, which in turn will depend significantly on how the unavoidable, big budget deficits are financed.
Investment risks
-
The value of investments and any income will fluctuate (this may partly be the result of exchange rate fluctuations) and investors may not get back the full amount invested.
Important information
-
Where John Greenwood and Adam Burton have expressed opinions, they are based on current market conditions, may differ from those of other investment professionals and are subject to change without notice.

