Weekly market performance update
Michael Joynson, Head of Market Insights, Invesco
The economic news flow continued to highlight that the macro backdrop remains an extremely challenging one and is only likely to get worse before it gets better. Weak Q1 GDP numbers from both the EZ and US (see chart of the week) and a sixth week of elevated Initial Jobless Claims in the US, potentially taking unemployment to north of 20%, were all symptomatic of that. Set against that was the improving trend in new Covid cases globally (although there remain wide divergences between individual countries) and tentative moves in a number of countries to start easing back on lockdown restrictions.
It ended up being a week of two halves for investors, albeit one that saw small gains for most asset classes. It was very much strength at the start, but weak towards the end. The S&P 500, for example, rose 3.6% between Monday and Wednesday before giving all that back on Thursday and Friday (-3.7%), as Trump ratcheted up rhetoric towards China and a number of key large caps, such as Amazon and Apple, disappointed on the earnings front. Despite that it still left April as the strongest month for the S&P 500 (+12.6%) since January 1987. Risk assets have generally rallied strongly since late March and there is no doubt that rally fatigue may be setting in against a still very uncertain macro backdrop. They may have gone up too far already.

Key observations on last week’s performance:
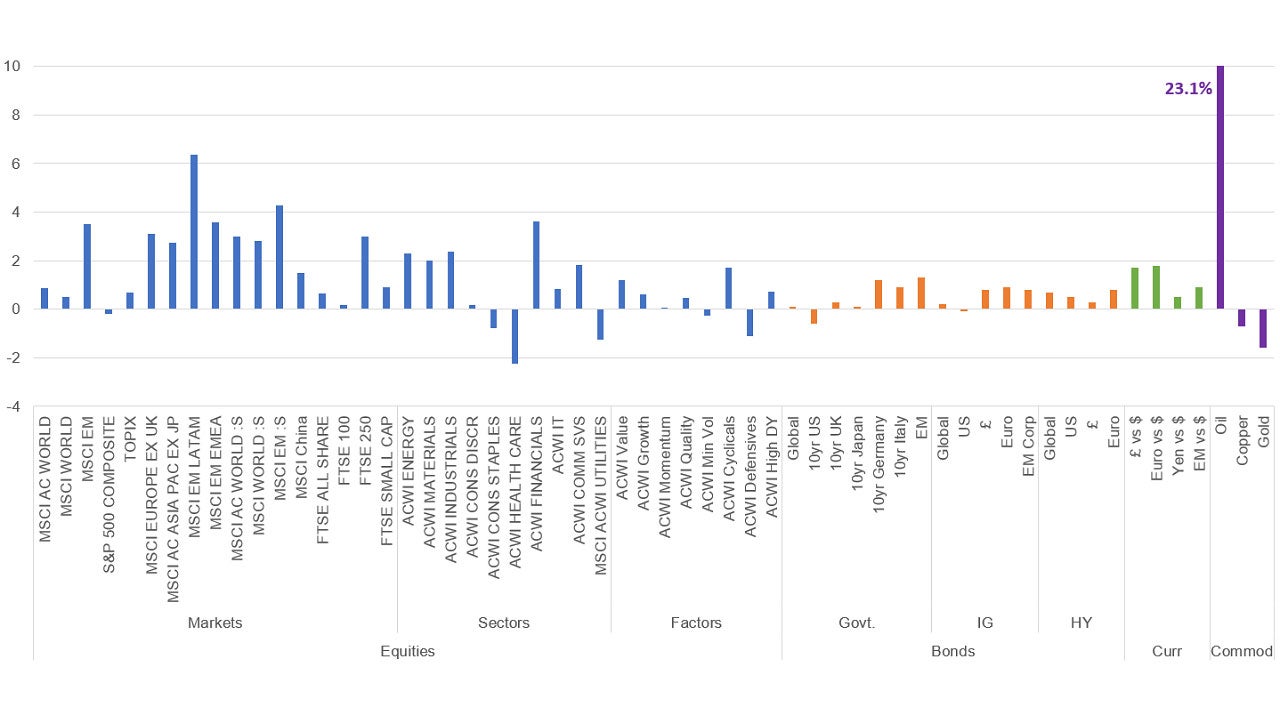
- Global equities returns were positive last week (0.9%), with EM (3.5%) well ahead of DM (0.5%), where returns would have been lower if most European markets hadn’t been closed on Friday, when the S&P 500 fell -2.8%. So Europe ex UK ended the week as the strongest DM (3.1%) with the US (-0.2%) the main laggard. Both Japan and the UK were marginally higher. Latin America recovered strongly (6.4%) to lead EM. Small caps outperformed, with both EM and DM strong. Mid caps (FTSE 250) led in the UK. Volatility, as measured by the VIX, remained elevated at 37, having hit its lowest level since late February earlier in the week (31).
- It was very much a reversal of fortunes last week at the sector level. The three worst sectors YTD outperformed. Financials (3.6%) led the way followed by Industrials (2.4%) and Energy (2.3%). Of the more defensive areas of the market, only Commercial Services managed to deliver a positive return (1.3%), with HealthCare, the best sector YTD, taking up the rear (-2.2%). IT performed in-line.
- At a factor level Value had a rare week of outperformance relative to Growth, albeit only marginally so (1.6% vs 0.6%), while Cyclicals were well ahead of Defensives.
- Developed Market government bonds returns were mixed, with global returns up slightly. Led by the 10yr Bund (-12bp), yields fell in most major markets. The US was the exception, where the 10yr UST rose 4bp. EM sovereign bonds had a good week (1.3%), with yields 65bp lower.
- Global credit markets saw positive returns in both IG and HY, with the latter outperforming. Moves in yields and spreads were greater in HY (IG -15bp and -16bp respectively and -31bp and -32bp for HY). BBBs were the best performing credit rating for IG and Bs for HY.
- The US$ was weak across the board with both £ and the Euro up just under 2%. EM currencies also rallied by nearly 1%.
- Oil had a much stronger week with Brent regaining all its recent losses (23.1%) and at $26 is now well above its recent low ($16.5). Copper fell marginally, while Gold, having hit its highest level since late 2012 last week, succumbed to some profit taking.

Key observations on YTD performance:
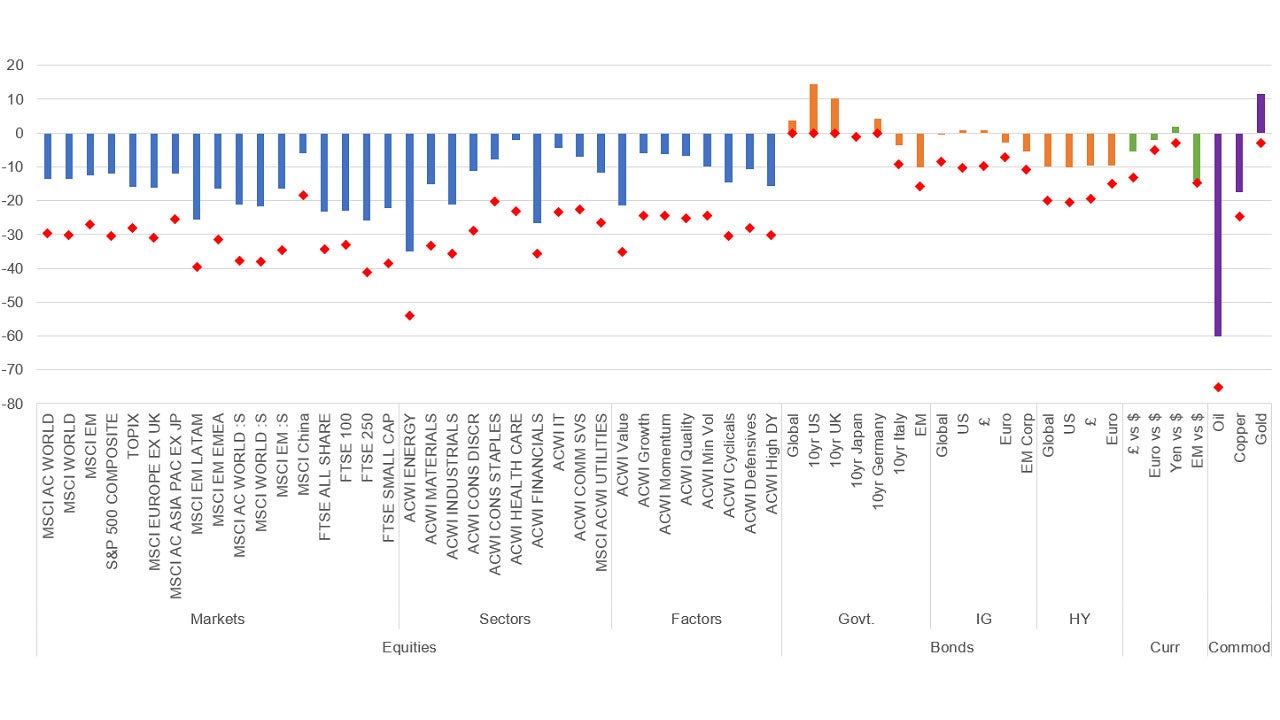
- As the chart highlights, it’s been a tough start to the year for risk assets, such as equities, HY and selected commodities. However, almost all, while still comfortably in negative territory, are well above their lows.
- In equities DM are marginally ahead (1.2%) of EM YTD. The US is comfortably the best DM region, 4% ahead of Japan and Europe and 11% ahead of the UK. Large caps are 8% ahead of small caps. Sector divergences have been material. Energy (-34.9%) and Financials (-26.4%) are the worst performing sectors, far behind the leaders HealthCare (-1.9%) and IT (-4.2%). On a factor basis, Value is the standout laggard, down -21.2% and trailing Growth by 15%. Value is now trading at its lowest TR relative to Growth since 2000.
- In government bond markets USTs have been the star performer, with the 10yr UST YTM falling 127bp and returning 14.4%. Gilts have also been strong, with the 10yr YTM down 58pts and returning 10%. EZ performance has been mixed. The 10yr Bund (4.1%) has performed much better than EZ peripheral bonds, where, for example, the 10yr Italian BTP is down -3.4% YTD. EM external sovereign debt has had a poor year, down -10%, and now yielding 5.46%.
- All credit markets are well off their YTD lows as Global yields and spreads have tightened considerably from their late March highs (Yields: IG -136bp, HY -307bp, Spreads: IG -132bp, HY -306bp). However, they remain above YTD starting levels (Yields: IG +10bp, HY +253bp, Spreads: IG +107bp, HY +413bp). IG, as one would expect in a risk-off environment, has outperformed HY comfortably. US and £ credit are both just in positive territory YTD, with Euro IG the laggard. Little separates the major markets in HY. The weaker the credit rating the weaker the relative performance in both IG and HY.
- £ (-5.3%) and EM currencies (-14%) have been the main losers against the US$, although the former has rebounded 9.2% off its March lows. The Yen is up just under 2%, while the Euro has weakened -2%.
- The Brent oil price has fallen -60% from $66 to $26 but is well off the lows of $16.5. Copper has fared somewhat better at -17.4% YTD. It is not just economically sensitive commodities that have struggled. There has been weakness too in many agricultural commodities, such as grains and livestock. Gold (+11.3%) has performed strongly and fulfilled its role as a safe haven in times of strife.

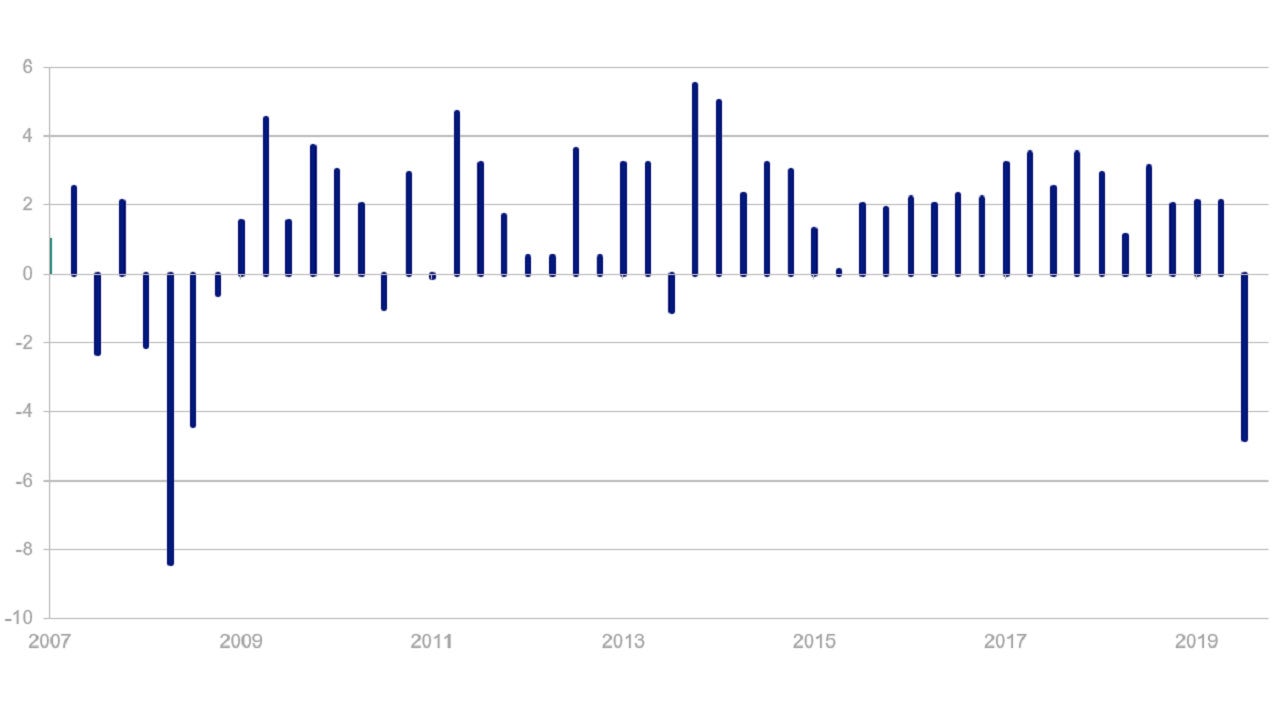
- Last week saw a number of major economies announce their first take on Q1 GDP, including the world’s largest economy, the United States.
- The economy shrank at a 4.8% annualized pace, the biggest slide since 2008 and the first contraction since 2014, as the need to fight the coronavirus forced businesses to close and consumers to stay at home. And this in a quarter when the economy was running pretty much on a normal footing for over 80% of the time.
- The weakness was led by the steepest drop in consumer spending since 1980 and the fastest decline in business investment in almost 11 years.
- Of course, Q1 is just a foretaste of what is to come. Q2 is expected to be many times worse. Our own composite consensus number calculated from Bloomberg contributors has the economy contracting at an incredible -37% annualised pace. The most bearish estimate is -65% from Unicredito.
- The longest expansion in US history that started in mid-2009 and lasted over 10 years is well and truly over.
- But on current consensus expectations it will just be a short and very sharp downturn. Growth of 20% and 16% annualised is forecast for the third and fourth quarters. An expectation that has undoubtedly been a key factor in the recovery in risk assets that we have seen in recent weeks.
Key economic data in the week ahead:
- A quieter week on the data front ahead.
- Final PMIs for all the major economies will be published during the week with the greatest attention likely to be on the EZ, where we’ll see first readings on Wednesday for Italy and Spain, where the lockdowns have been the most severe. With all the regional/country PMIs out we’ll see the Global Composite PMI on Wednesday too.
- After a flurry of Central Bank meetings last week there is only the Bank of England to look forward to this week (Thursday). While no change in policy is expected, close attention will be paid to the Inflation Report that is published at the same time, providing insight into the Bank’s outlook for growth and inflation, which will have undoubtedly have changed dramatically to the downside since the last report at the end of January.
- Also, in the UK we’ll have the final GfK consumer confidence reading for April on Thursday. Expect it to confirm the collapse in confidence seen in the preliminary survey in late April.
- In the US, focus this week will be on the employment market. Not only do we have the regular Initial Jobless Claims and Continuing Claims numbers on Thursday, but on Friday there is the monthly Non-Farm Payrolls number (for April). The 20 million plus net layoffs the consensus anticipates will unwind 20 years of job creation in a single month, putting the number of employed workers back to a level first achieved around 1999.
- As well as the PMIs in the EZ we also have March’s Retail Sales on Wednesday. Consensus is for a record -10.9%mom decline.
- Finally, in China we have trade data for April on Thursday, which is expected to show a sharp yoy fall in both imports and exports, the former reflecting the slow return to normal following the lockdown, the latter the collapse in demand as major exports markets’ economies fell into recession.
Investment risks
-
The value of investments and any income will fluctuate (this may partly be the result of exchange rate fluctuations) and investors may not get back the full amount invested.
Important information
-
Performance indices used: equity markets: as shown, equity sectors/factors: MSCI ACWI, global government bonds: ICE BofAML Global Government, 10yr government bonds: All Datastream 10yr Benchmark, EM government bonds: ICE BofAML Emerging Markets External Sovereign, IG/HY bonds: all indices are ICE BofAML, EM currencies: JP Morgan Emerging Markets FX, oil: Crude Oil BFO M1 Europe FOB $/BBl, copper: LME-Copper Grade A Cash U$/MT, gold: Gold Bullion LBM $/t oz DELAY. Equity/bond performance is in local currency, total return. Commodities are local currency, price only.
Where individuals or the business have expressed opinions, they are based on current market conditions, they may differ from those of other investment professionals and are subject to change without notice.

