Tactical Asset Allocation - September 2024

Synopsis
Despite a roundtrip price action, we believe August was a pivotal month for markets going forward, marking a shift from inflation and artificial intelligence to growth and employment as primary drivers of market performance.
Global risk appetite continues to decelerate, signaling a potential downshift in growth expectations. We maintain a defensive asset allocation relative to the benchmark, overweighting fixed income relative to equities, favoring US equities and defensive sectors with quality and low volatility characteristics. In fixed income, we remain overweight duration and underweight credit risk.
Maintain defensive portfolio positioning. Overweight fixed income vs. equities, favoring defensive equity factors and quality credit.
Our macro process drives tactical asset allocation decisions over a time horizon between six months and three years, on average, seeking to harvest relative value and return opportunities between asset classes (e.g., equity, credit, government bonds, and alternatives), regions, factors, and risk premia.
Macro update
The month of August was a rollercoaster, to say the least, with global equity markets selling off by 6% and underperforming US Treasuries by 8% over the first five days, and later recovering all the underperformance by the end of the month. Despite the apparent conclusion of an “uneventful” month in terms of final price action, we believe August was far more pivotal for markets going forward, delivering the long-waited catalysts to shift markets' attention to growth and employment, after two years where inflation and artificial intelligence took center stage as primary drivers of performance. We believe these two catalysts were the July employment report, released on August 2, and Chair Powell's speech at Jackson Hole on August 23. The employment report confronted markets with the real possibility of a weakening labor market. Despite a still solid pace of hiring, the steady rise in the unemployment rate (from a low of 3.4% to 4.2%) is indicative of a market not strong enough to absorb the rising labor force participation rate. The Federal Reserve’s (Fed) Chair Powell confirmed this assessment in his Jackson Hole speech, stating that even though “so far rising unemployment is not the result of elevated layoffs, …the cooling in labor market conditions is unmistakable". The subsequent August payroll report, released on September 6, confirmed the softening of the labor market, with weaker employment growth and negative revisions to prior months. This development, coupled with the Fed's increased confidence that inflation is on a sustainable path back to 2%, has officially opened the door to the easing cycle, with markets already pricing in approximately 100 basis points (bps) cuts by the end of 2024 and another 100bps over the course of 2025. This policy pricing is broadly consistent with a soft landing, delivering an equilibrium or terminal fed funds rate of approximately 3.5%, assuming trend growth at 1.5%-2.0% and a 2% inflation target.
However, cognizant of the long and variable lags of monetary policy and the significant uncertainty introduced by the unique post-pandemic dynamics, Chair Powell also indicated, “We do not seek or welcome further cooling in labor market conditions." Put differently, the outlook has shifted from upside risks to inflation to downside risks to growth. This outlook is broadly consistent with the output of our macro indicators. Global leading economic indicators are still indicating a soft landing, with growth below trend but stable (Figure 1a, 1b, and 1c ), inflationary pressures falling (Figure 3), and global risk appetite decelerating for the past couple of months, pointing to downside risks to growth over the remainder of the year (Figure 2). In our recent updates (see February 2024), we discussed how 2024 could be characterized by the manifestation of these long and variable lags in monetary policy, with the labor market representing the best barometer for this assessment. As illustrated in Figure 4, monetary policy cycles, visualized here with the slope of the yield curve, can take up to two years to influence economic activity and, consequently, market risk. Since early July, our active asset allocation positions have been tilted to reflect these downside risks to growth, as our macro indicators flagged weakening market sentiment and declining growth expectations.

Sources: Bloomberg L.P., Macrobond. Invesco Solutions research and calculations. Proprietary leading economic indicators of Invesco Solutions. Macro regime data as of Aug. 31, 2024. The Leading Economic Indicators (LEIs) are proprietary, forward-looking measures of the level of economic growth. The Global Risk Appetite Cycle Indicator (GRACI) is a proprietary measure of the markets’ risk sentiment. Developed markets ex-USA include the eurozone, UK, Japan, Switzerland, Canada, Sweden, Australia. Emerging markets include Brazil, Mexico, Russia, South Africa, Taiwan, China, South Korea, India.

Source: Invesco Solutions as of Aug. 31, 2024.

Sources: Bloomberg L.P., Macrobond. Invesco Solutions research and calculations. Proprietary leading economic indicators of Invesco Solutions. Macro regime data as of Aug. 31, 2024. The Leading Economic Indicators (LEIs) are proprietary, forward-looking measures of the level of economic growth. The Global Risk Appetite Cycle Indicator (GRACI) is a proprietary measure of the markets’ risk sentiment.

Sources: Bloomberg L.P., MSCI, FTSE, Barclays, JPMorgan, Invesco Solutions research and calculations, from Jan. 1, 1992 to Aug. 31, 2024. The Global Leading Economic Indicator (LEI) is a proprietary, forward-looking measure of the growth level in the economy. A reading above (below) 100 on the Global LEI signals growth above (below) a long-term average. The Global Risk Appetite Cycle Indicator (GRACI) is a proprietary measure of the markets’ risk sentiment. A reading above (below) zero signals a positive (negative) compensation for risk-taking in global capital markets in the recent past. Past performance does not guarantee future results.
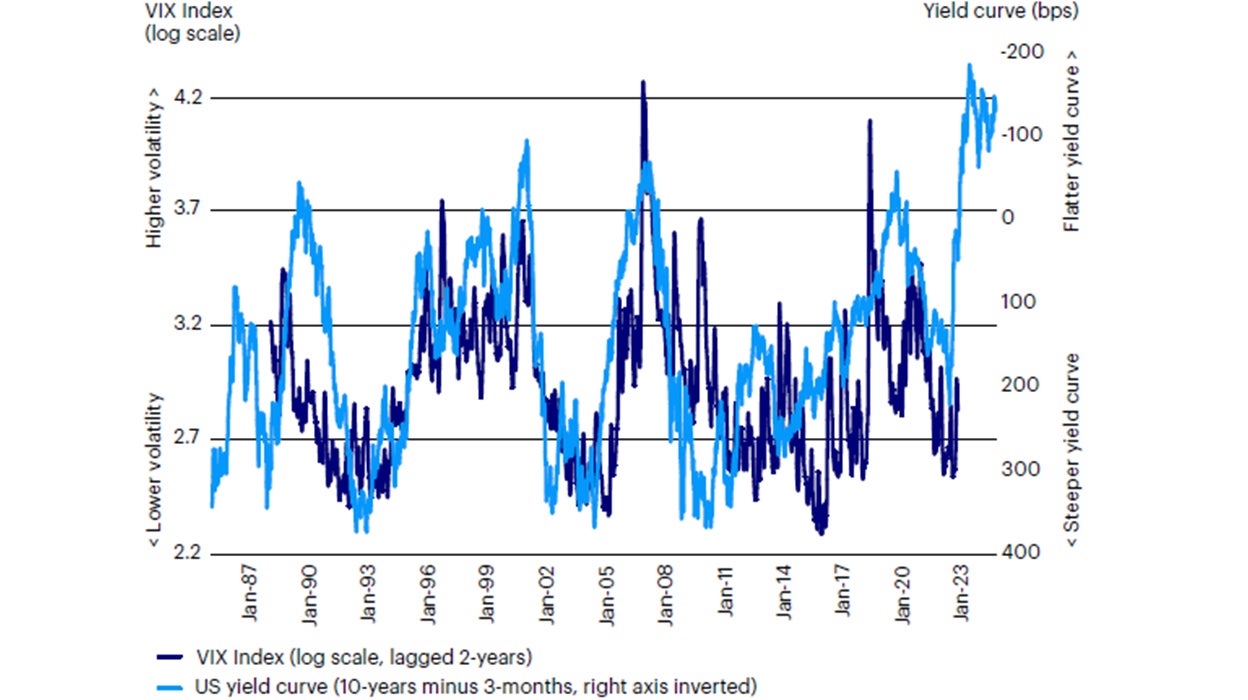
Sources: Bloomberg L.P., Invesco Investment Solutions research and calculations, from January 1985 to January 2024. Past performance does not guarantee future results.
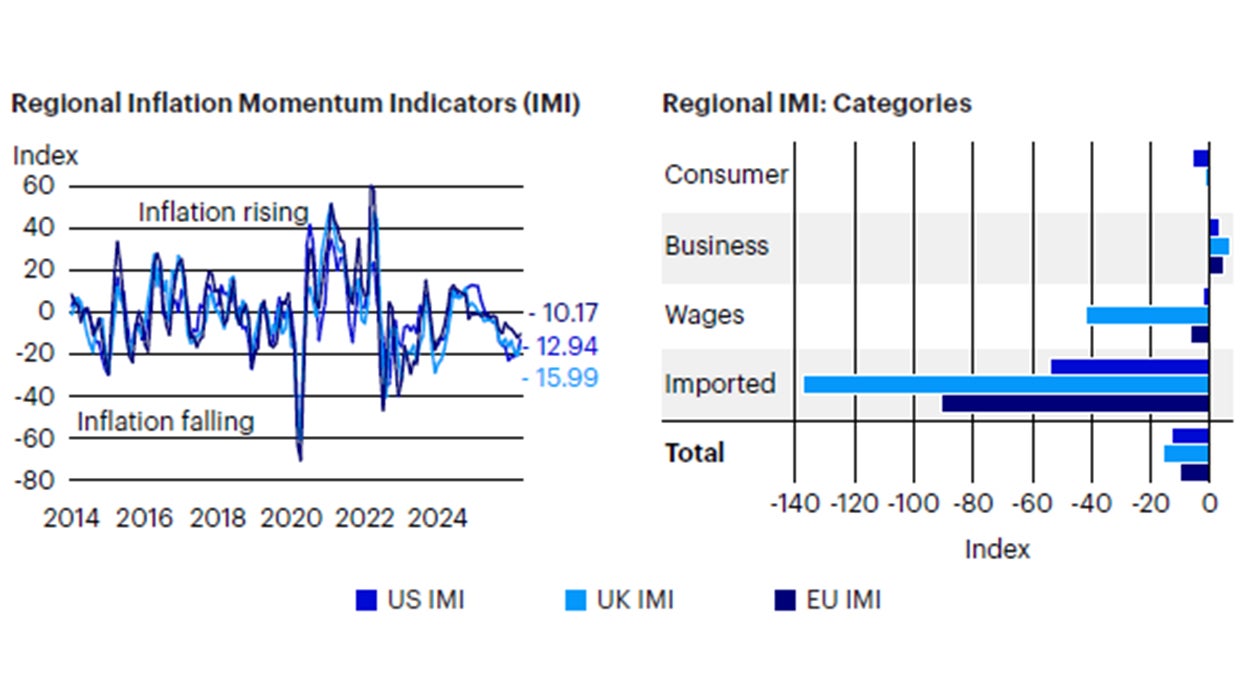
Sources: Bloomberg L.P. data as of Aug. 31, 2024, Invesco Solutions calculations. The US Inflation Momentum Indicator (IMI) measures the change in inflation statistics on a trailing three-month basis, covering indicators across consumer and producer prices, inflation expectation surveys, import prices, wages, and energy prices. A positive (negative) reading indicates inflation has been rising (falling) on average over the past three months.
Investment positioning
There are no changes in portfolio positioning this month. We underweight risk relative to the benchmark in the Global Tactical Allocation Model,1 underweighting equities relative to fixed income, favoring US equities and defensive sectors with quality and low volatility characteristics. In fixed income, we underweight credit risk2 relative to the benchmark and overweight duration via investment grade credit and sovereign fixed income at the expense of lower quality credit sectors. (Figures 5 to 8). In particular:
- In equities, we overweight defensive sectors with quality and low volatility characteristics, tilting towards larger capitalizations at the expense of value, mid and small caps. Despite the extended positioning in mega-cap quality names, we expect a combination of quality and low volatility characteristics to outperform and provide downside risk mitigation in a scenario of falling growth expectations, falling bond yields, and weaker equity markets. Hence, we favor exposures to defensive sectors such as health care, staples, utilities, and technology at the expense of cyclical sectors such as financials, industrials, materials, and energy. From a regional perspective, we overweight US equities relative to other developed markets and emerging markets (EM), driven by declining global risk appetite, stronger US earnings revisions vs. the rest of the world, and a still favorable outlook for the US dollar due to negative surprises in global growth and tighter monetary policy relative to the rest of the world.
- In fixed income, we underweight credit risk and overweight duration, favoring investment grade and sovereign fixed income relative to high yield. While the current backdrop does not suggest a major risk for credit spreads, downward revisions to growth expectations are likely to be accompanied by marginally wider spreads from cycle lows and lower bond yields, favoring higher quality and higher duration assets. In sovereigns, we favor nominal bonds over inflation-protected securities as inflationary pressures continue to decline (Figure 4).
- In currency markets, we reduce the overweight in the US dollar, as yield differentials with major foreign currencies are narrowing. However, overall higher yields and negative surprises in global growth still inform our position in favor of the greenback. Within developed markets, we favor the euro, the British pound, Norwegian kroner, Swedish krona, and Singapore dollar relative to the Swiss Franc, Japanese yen, Australian and Canadian dollars. In EM, we favor high yielders with attractive valuations as the Colombian peso, Brazilian real, Indian rupee, Indonesian rupiah and Mexican peso, relative to low yielding and more expensive currencies as the Korean won, Taiwan dollar, Philippines peso, and Chinese renminbi.
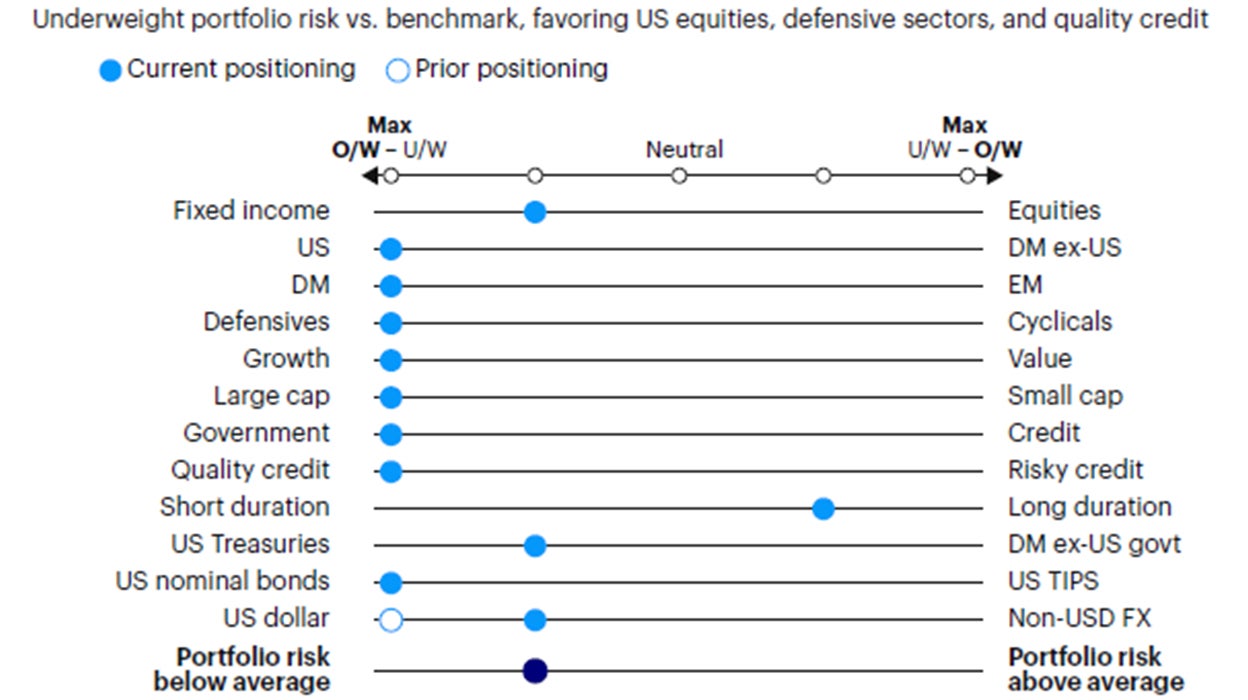
Source: Invesco Solutions, Sept. 1, 2024. DM = developed markets. EM = emerging markets. Non-USD FX refers to foreign exchange exposure as represented by the currency composition of the MSCI ACWI Index. For illustrative purposes only.
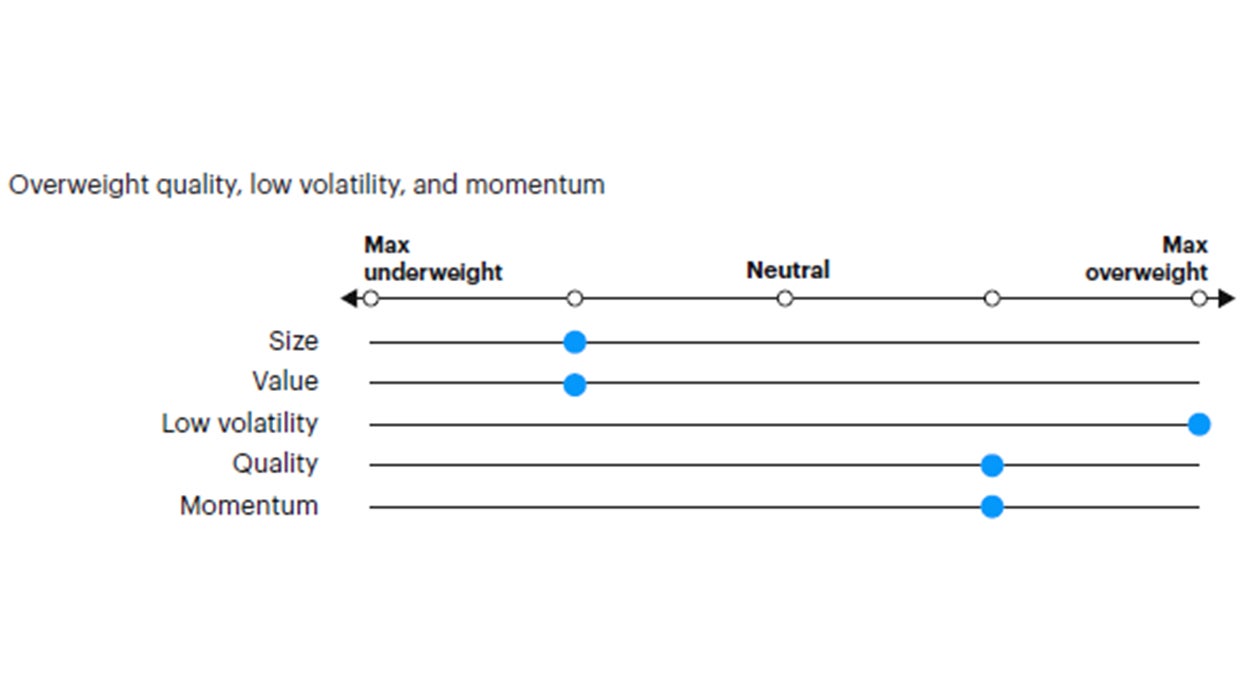
Source: Invesco Solutions, Sept. 1, 2024. For illustrative purposes only. Neutral refers to an equally weighted factor portfolio.
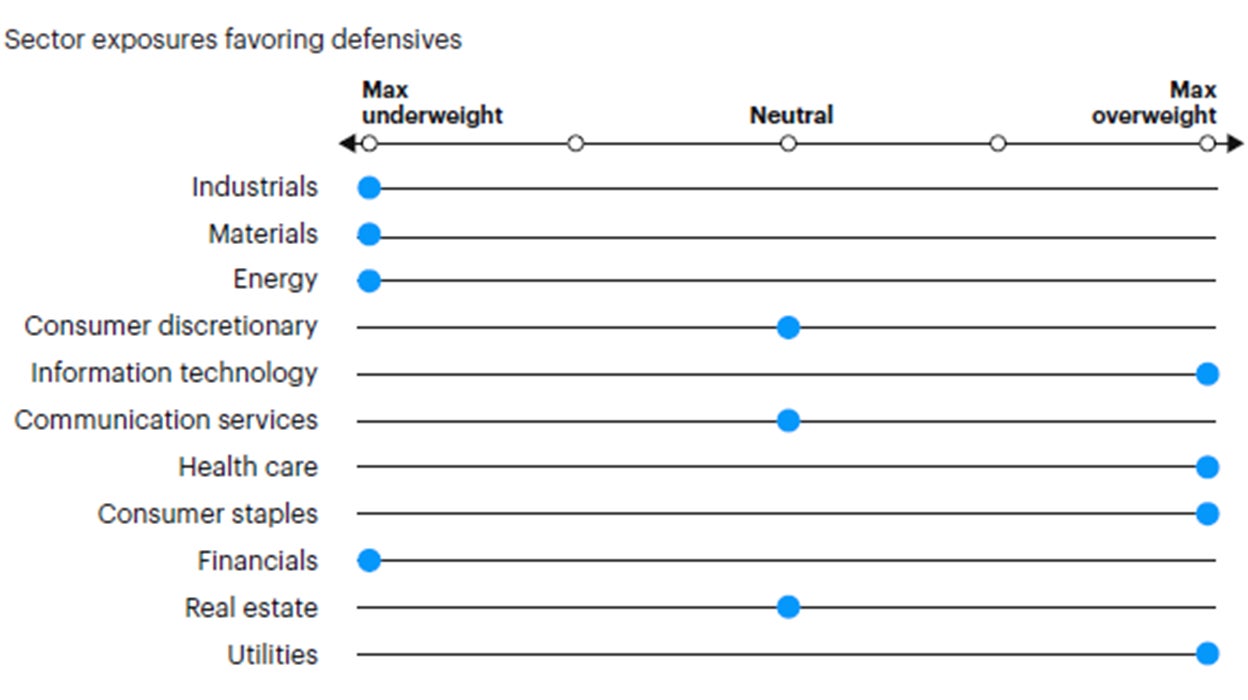
Source: Invesco Solutions, Sept. 1, 2024. For illustrative purposes only. Sector allocations derived from factor and style allocations based on proprietary sector classification methodology. As of December 2023, Cyclicals: energy, financials, industrials, materials; Defensives: consumer staples, health care, information technology, real estate, utilities; Neutral: consumer discretionary and communication services.
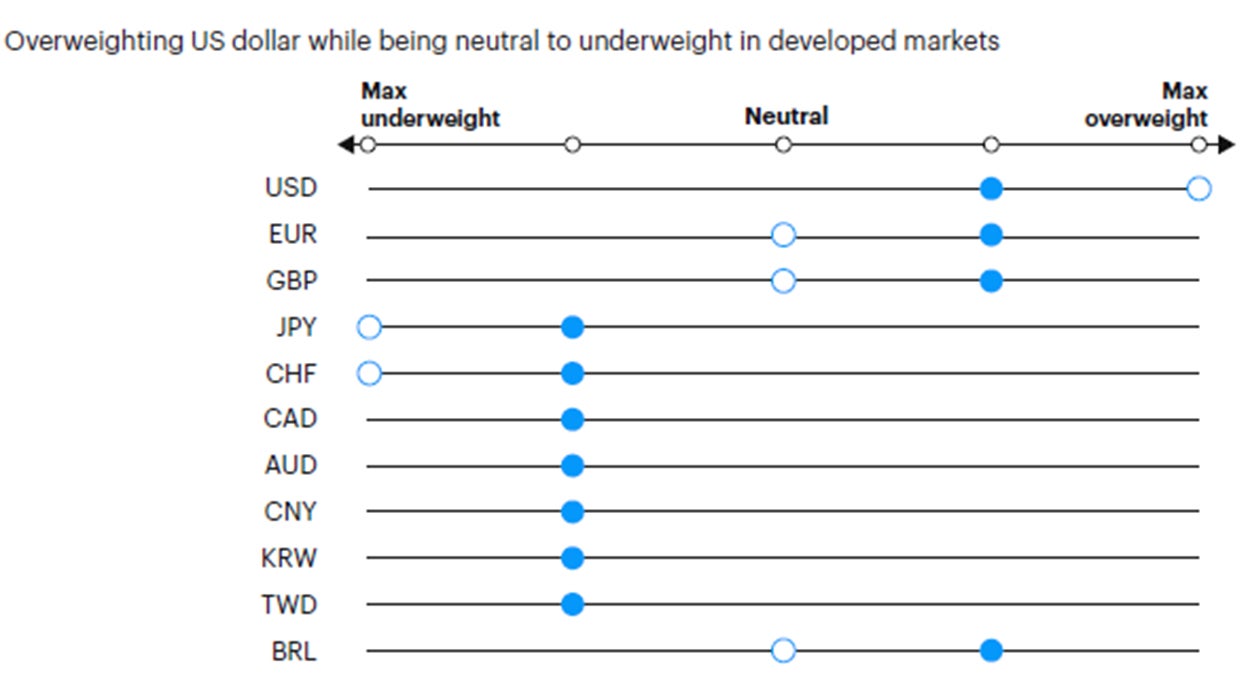
Source: Invesco Solutions, Sept. 1, 2024. For illustrative purposes only. Currency allocation process considers four drivers of foreign exchange markets: 1) US monetary policy relative to the rest of the world, 2) global growth relative to consensus expectations, 3) currency yields (i.e., carry), 4) currency long-term valuations.
Investment risks:
The value of investments and any income will fluctuate (this may partly be the result of exchange rate fluctuations), and investors may not get back the full amount invested.
Footnotes
-
1
Reference benchmark 60% MSCI ACWI, 40% Bloomberg Global Aggregate Hedged Index.
-
2
Credit risk defined as duration times spread (DTS).


