Tactical Asset Allocation - February 2025

Synopsis
Two themes are likely to drive markets over the coming months, influencing the direction of growth and inflation expectations: US trade policy and the evolving competitive landscape in the AI race. As seen in 2018, the risk of escalation in retaliatory trade policy could provide material headwinds to global equity and currency markets. On the other hand, increased competition and innovation in the tech sector bodes well for productivity and growth but could lead to some de-rating in US growth equity valuations, favoring sector and style rotation.
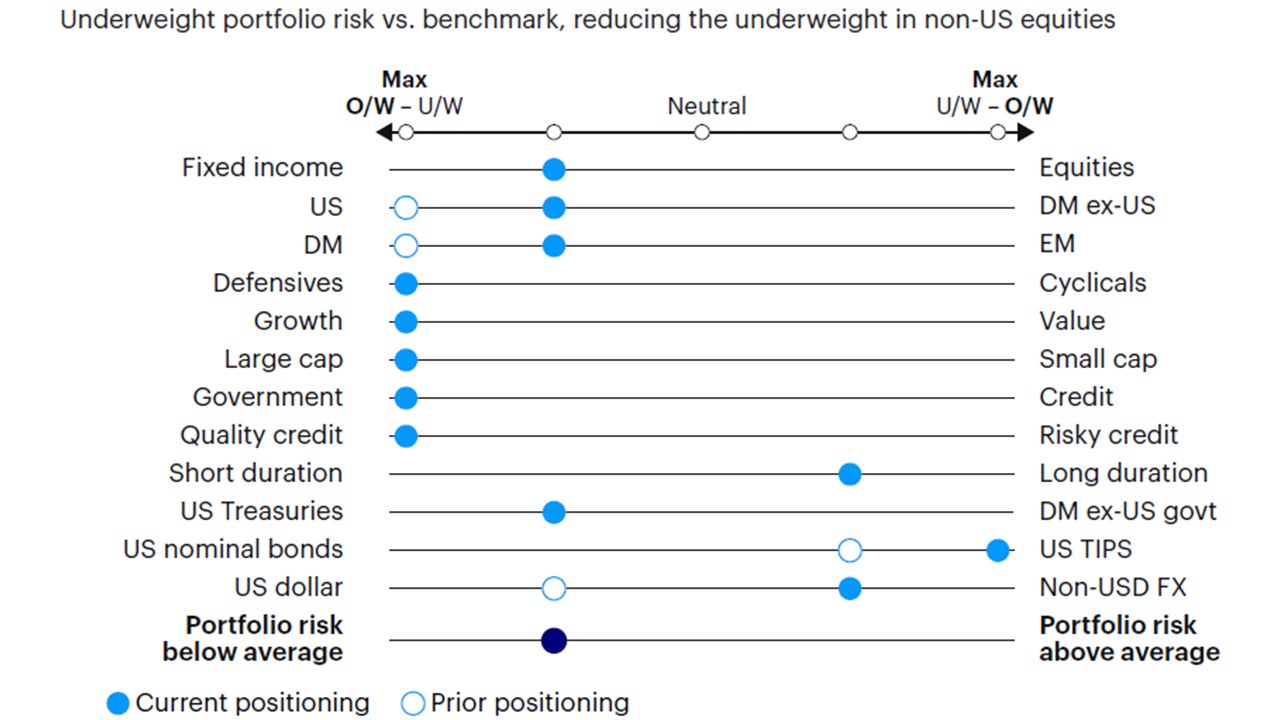
Our framework remains in a contraction regime. We maintain a cautious asset allocation versus benchmark, overweighting fixed income relative to equities. We reduce the overweight in US equities relative to developed ex-US and emerging markets and increase exposure to inflation-linked bonds vs. nominal Treasuries on rising inflation momentum.
Maintaining defensive portfolio positioning while reducing the underweight in developed ex-US and emerging market equities. Increased exposure to inflation-linked bonds at the expense of nominal Treasuries on rising inflation momentum.
Our macro process drives tactical asset allocation decisions over a time horizon between six months and three years, on average, seeking to harvest relative value and return opportunities between asset classes (e.g., equity, credit, government bonds, and alternatives), regions, factors, and risk premia.
Macro update
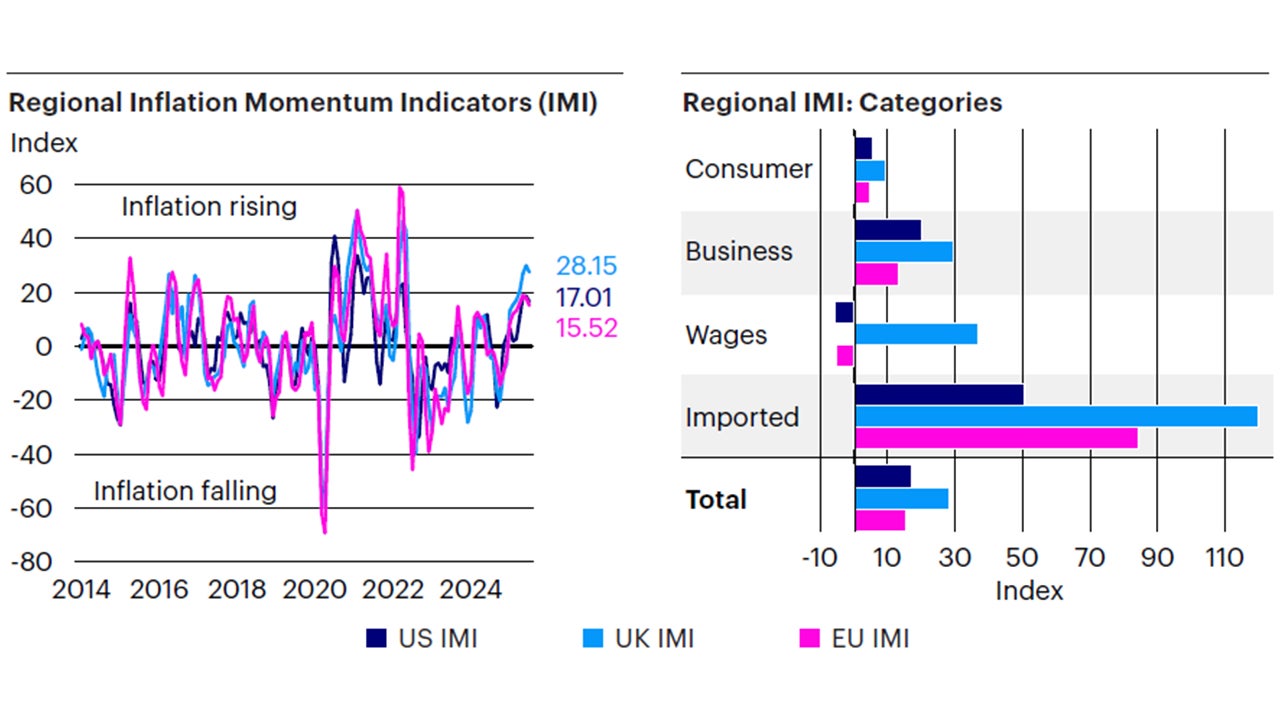
The new year started with positive momentum across risky assets, riding the tailwinds of 2024 while navigating the recent news flow regarding US trade tariffs and the changing competitive landscape in the global AI race. All major asset classes posted positive returns in January, with global equities outperforming fixed income, credit spreads tightening across sectors, and US Treasury bond yields marginally declining after the severe sell-off of Q4 2024. As a result, our global risk appetite indicator improved for the third consecutive month but, based on our models, is yet to signal a cyclical inflection point of rising growth expectations. Improvements are also evident in leading economic indicators across regions, particularly the US, eurozone, UK, and China, which are gradually returning towards their long-term trend. Overall, our systematic macro framework remains in a contraction regime at this stage, with rising probabilities of a transition to recovery in the near future (Figures 1 and 2). Short-term inflationary pressures continue to rise across markets, led by rising commodity prices and rising input costs in manufacturing surveys. Our inflation momentum indicators are rising across the US, Eurozone and UK, validating the recent widening in breakeven inflation rates, which remain, however, well below the highs recorded in mid-2022 (Figure 3). Two themes are likely to drive markets over the coming months, influencing the direction of our growth and inflation frameworks:
- US trade policy under President Trump is likely to increase risk premia and volatility in currency, rates, and equity markets, albeit to a different extent. The introductions of 25% tariffs on imports from Canada and Mexico and 10% tariffs on imports from China are likely the first steps in a series of policy actions toward other trading partners, adding uncertainty to the path of monetary policy and testing the resilience of market sentiment and the global economy. As experienced in 2018, trade policy uncertainty and supply chain disruptions can cause meaningful headwinds to equity and currency markets, given unpredictability in the timing, scope and magnitude of these policies, and the likely escalation of retaliatory actions from other countries.
- The competitive landscape in Artificial Intelligence (“AI”) just experienced what could be described as the “Aha moment.” China’s DeepSeek open-source large language model stunned the AI community, delivering strong performance versus alternative benchmarks, reportedly spending only $6mln to train its latest AI model. While there are questions regarding the disclosure of total costs, likely closer to a couple of billions rather than $6mln, qualified voices and industry leaders such as OpenAI and Nvidia CEOs have described the results and efficiency gains as material.1 From a macro perspective, these developments may challenge the expensive valuations in US tech equities, held under the premise of a near monopolistic advantage and high barriers to entry. Rapid innovation and rising competition are likely to increase uncertainty around long-term forward earning projections and the return on investment for large US tech firms that have led the AI race, committing large capital expenditures. While these developments should be positive for productivity and overall equity market performance, they represent a potential catalyst for derating valuations in the Magnificent 7, leading to broader market participation and rotation in style sector leadership.
Through our systematic macro framework, we monitor the evolution of these themes and the resulting impact on global market sentiment, inflation expectations and relative growth performance across regions, repositioning our asset allocation accordingly.

Sources: Bloomberg L.P., Macrobond. Invesco Solutions research and calculations. Proprietary leading economic indicators of Invesco Solutions. Macro regime data as of Jan. 31, 2025. The Leading Economic Indicators (LEIs) are proprietary, forward-looking measures of the level of economic growth. The Global Risk Appetite Cycle Indicator (GRACI) is a proprietary measure of the markets’ risk sentiment. Developed markets ex-USA include the eurozone, UK, Japan, Switzerland, Canada, Sweden, Australia. Emerging markets include Brazil, Mexico, Russia, South Africa, Taiwan, China, South Korea, India.

Source: Invesco Solutions, as of Jan. 31, 2025.

Sources: Bloomberg L.P., Macrobond. Invesco Solutions research and calculations. Proprietary leading economic indicators of Invesco Solutions. Macro regime data as of Jan. 31, 2025. The Leading Economic Indicators (LEIs) are proprietary, forward-looking measures of the level of economic growth. The Global Risk Appetite Cycle Indicator (GRACI) is a proprietary measure of the markets’ risk sentiment.

Sources: Bloomberg L.P., MSCI, FTSE, Barclays, JPMorgan, Invesco Solutions research and calculations, from Jan. 1, 1992 to Jan. 31, 2025. The Global Leading Economic Indicator (LEI) is a proprietary, forward-looking measure of the growth level in the economy. A reading above (below) 100 on the Global LEI signals growth above (below) a long-term average. The Global Risk Appetite Cycle Indicator (GRACI) is a proprietary measure of the markets’ risk sentiment. A reading above (below) zero signals a positive (negative) compensation for risk-taking in global capital markets in the recent past. Past performance does not guarantee future results.
Investment positioning
We implemented some minor changes to our asset allocation this month. We remain underweight risk relative to benchmark in the Global Tactical Allocation Model,2 underweighting equities relative to fixed income, favoring US equities and defensive sectors with quality and low volatility characteristics. However, we have reduced the underweight in developed ex-US and emerging market equities relative to US equities. In fixed income, we remain underweight credit risk3 relative to benchmark and overweight duration but increasing the exposure in inflation-linked bonds at the expense of nominal Treasuries (Figures 4 to 7). In particular:
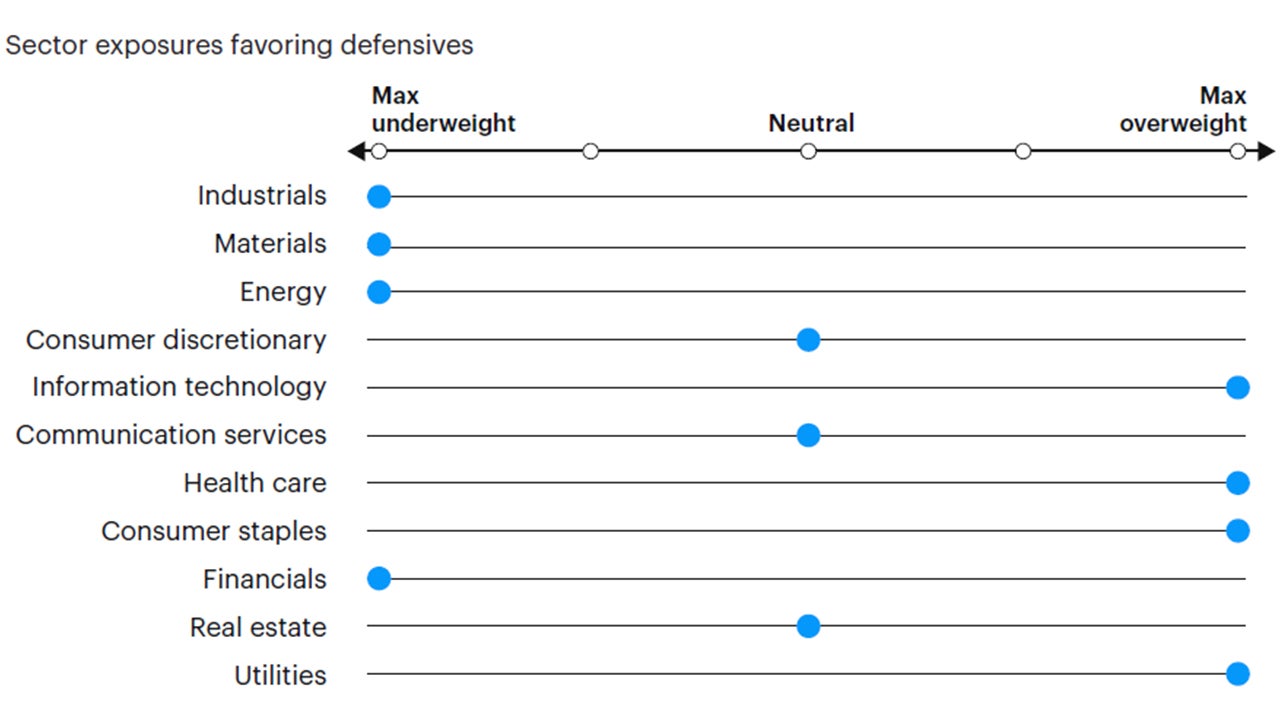
- In equities, we have reduced the overweight exposure to the US relative to other developed markets and emerging markets, as positive growth surprises outside the US lead us to underweight the US dollar and marginally decrease the attractiveness of dollar assets. However, declining global risk appetite and stronger US earnings revisions vs. the rest of the world still lead us to a US overweight stance in aggregate. We remain overweight defensive sectors with quality and low volatility characteristics, tilting towards larger capitalizations at the expense of value, mid and small caps. Despite the extended positioning in mega-cap quality names, we expect a combination of quality and low volatility characteristics to outperform and provide downside risk mitigation in a scenario of falling growth expectations, falling bond yields, and weaker equity markets. In fact, a combination of quality and low volatility characteristics has shown resilience over the past weeks despite the volatility in the tech sector. Hence, we favor exposures to defensive sectors such as health care, staples, utilities, and technology at the expense of cyclical sectors such as financials, industrials, materials, and energy.
- In fixed income, we underweight credit risk and overweight duration, favoring investment grade and sovereign fixed income relative to high yield. In sovereigns, we increased our exposure to inflation-linked bonds to a maximum overweight stance relative to nominal Treasuries, given rising inflation momentum across regions (Figure 3).
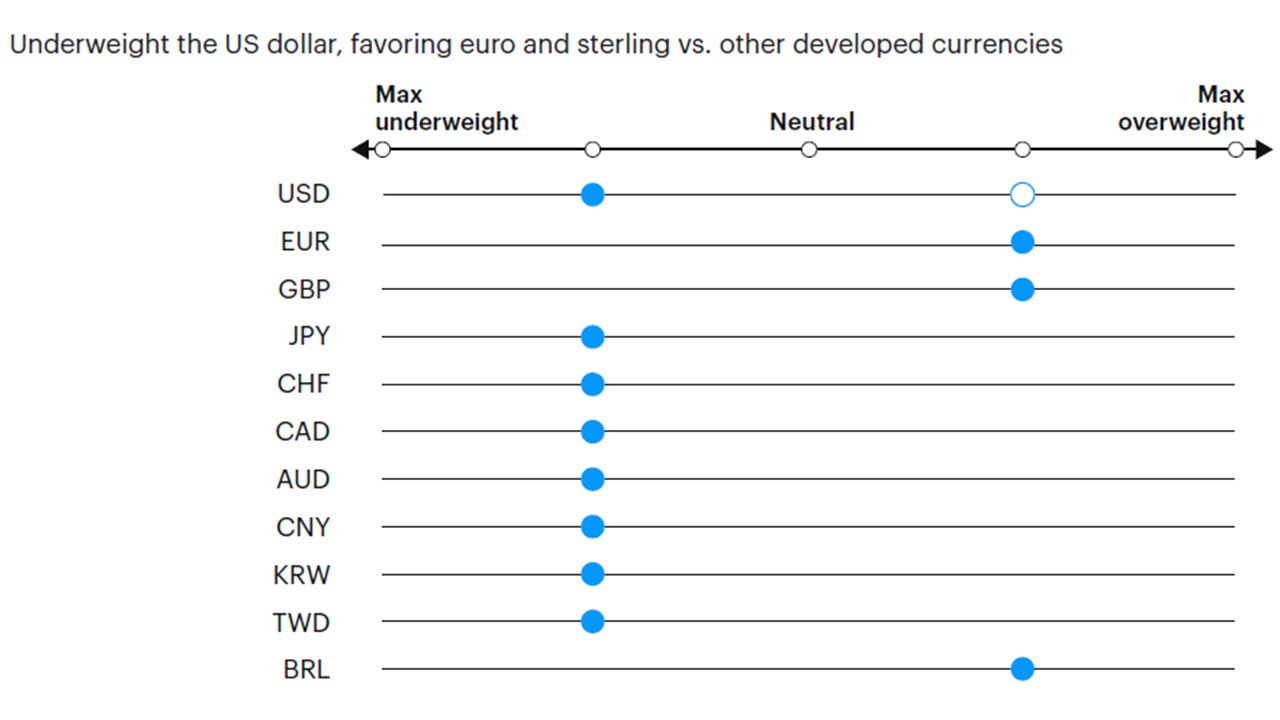
- In currency markets, we move from a moderate overweight to a moderate underweight in the US dollar. While yield spreads still favor the greenback, differentials are narrowing, and the recent string of positive growth surprises outside the US has led our models to a moderate underweight. Within developed markets, we favor the euro, the British pound, Norwegian kroner, Swedish krona, and Singapore dollar relative to the Swiss franc, Japanese yen, Australian and Canadian dollars. In EM, we favor high yielders with attractive valuations, as the Colombian peso, Brazilian real, Indian rupee, Indonesian rupiah and Mexican peso, relative to low yielding and more expensive currencies, such as the Korean won, Taiwan dollar, Philippines peso, and Chinese renminbi. Global trade policy uncertainty is likely to alter valuations and fundamentals across currencies over the coming months, and we expect our models to rebalance exposures accordingly.

Sources: Bloomberg L.P. data as of Jan. 31, 2025, Invesco Solutions calculations. The US Inflation Momentum Indicator (IMI) measures the change in inflation statistics on a trailing three-month basis, covering indicators across consumer and producer prices, inflation expectation surveys, import prices, wages, and energy prices. A positive (negative) reading indicates inflation has been rising (falling) on average over the past three months.

Source: Invesco Solutions, Feb. 1, 2025. DM = developed markets. EM = emerging markets. Non-USD FX refers to foreign exchange exposure as represented by the currency composition of the MSCI ACWI Index. For illustrative purposes only.

Source: Invesco Solutions, Feb. 1, 2025. For illustrative purposes only. Neutral refers to an equally weighted factor portfolio.

Source: Invesco Solutions, Feb. 1, 2025. For illustrative purposes only. Sector allocations derived from factor and style allocations based on proprietary sector classification methodology. As of December 2023, Cyclicals: energy, financials, industrials, materials; Defensives: consumer staples, health care, information technology, real estate, utilities; Neutral: consumer discretionary and communication services.

Source: Invesco Solutions, Feb. 1, 2025. For illustrative purposes only. Currency allocation process considers four drivers of foreign exchange markets: 1) US monetary policy relative to the rest of the world, 2) global growth relative to consensus expectations, 3) currency yields (i.e., carry), 4) currency long-term valuations.
Investment risks
The value of investments and any income will fluctuate (this may partly be the result of exchange rate fluctuations), and investors may not get back the full amount invested.
Footnotes
-
1
Sam Altman says OpenAI needs a new open-source strategy | Fortune, Nvidia calls China’s DeepSeek R1 model ‘an excellent AI advancement’.
-
2
Reference benchmark 60% MSCI ACWI, 40% Bloomberg Global Aggregate Hedged Index.
-
3
Credit risk defined as duration times spread (DTS).


