Tactical Asset Allocation - February 2023

Synopsis
Global capital markets continue to reprice towards a soft-landing scenario, anticipating a recovery in the cycle driven by lower inflation and a rebound in European growth.
We remain overweight portfolio risk in the Global Tactical Asset Allocation model1, favoring emerging and developed ex-US equities, value, smaller capitalizations, and cyclical sectors. Overweight risky credit, neutral duration and underweight the US dollar.
Macro update
In early December our macro indicators flagged a noticeable inflection point in market sentiment, driven by expectations that inflation would soon converge toward long-term policy targets, following the deceleration in monthly US CPI increases in October and November. Consequently, we repositioned our portfolio for a recovery in the market cycle, increasing our risk posture across equity and fixed income markets2. Since then, global capital markets and economic data have provided a strong validation for this optimistic soft-landing scenario, characterized by lower inflation, still-resilient labor markets and anticipation the Federal Reserve would signal a pause in the tightening cycle by mid-2023.
Surveys of consumer-based inflation expectations in the US have declined to 3.9%, from a cycle high of 5.4%, and US breakeven inflation expectations have reverted to 2-2.5% across maturities3. Global manufacturing surveys also indicate strong disinflation trends across input and output costs, with US ISM surveys even pointing to price declines in the near-term. Our barometer of US inflation momentum continues to suggest falling inflationary pressures across economic sectors (Figure 3).
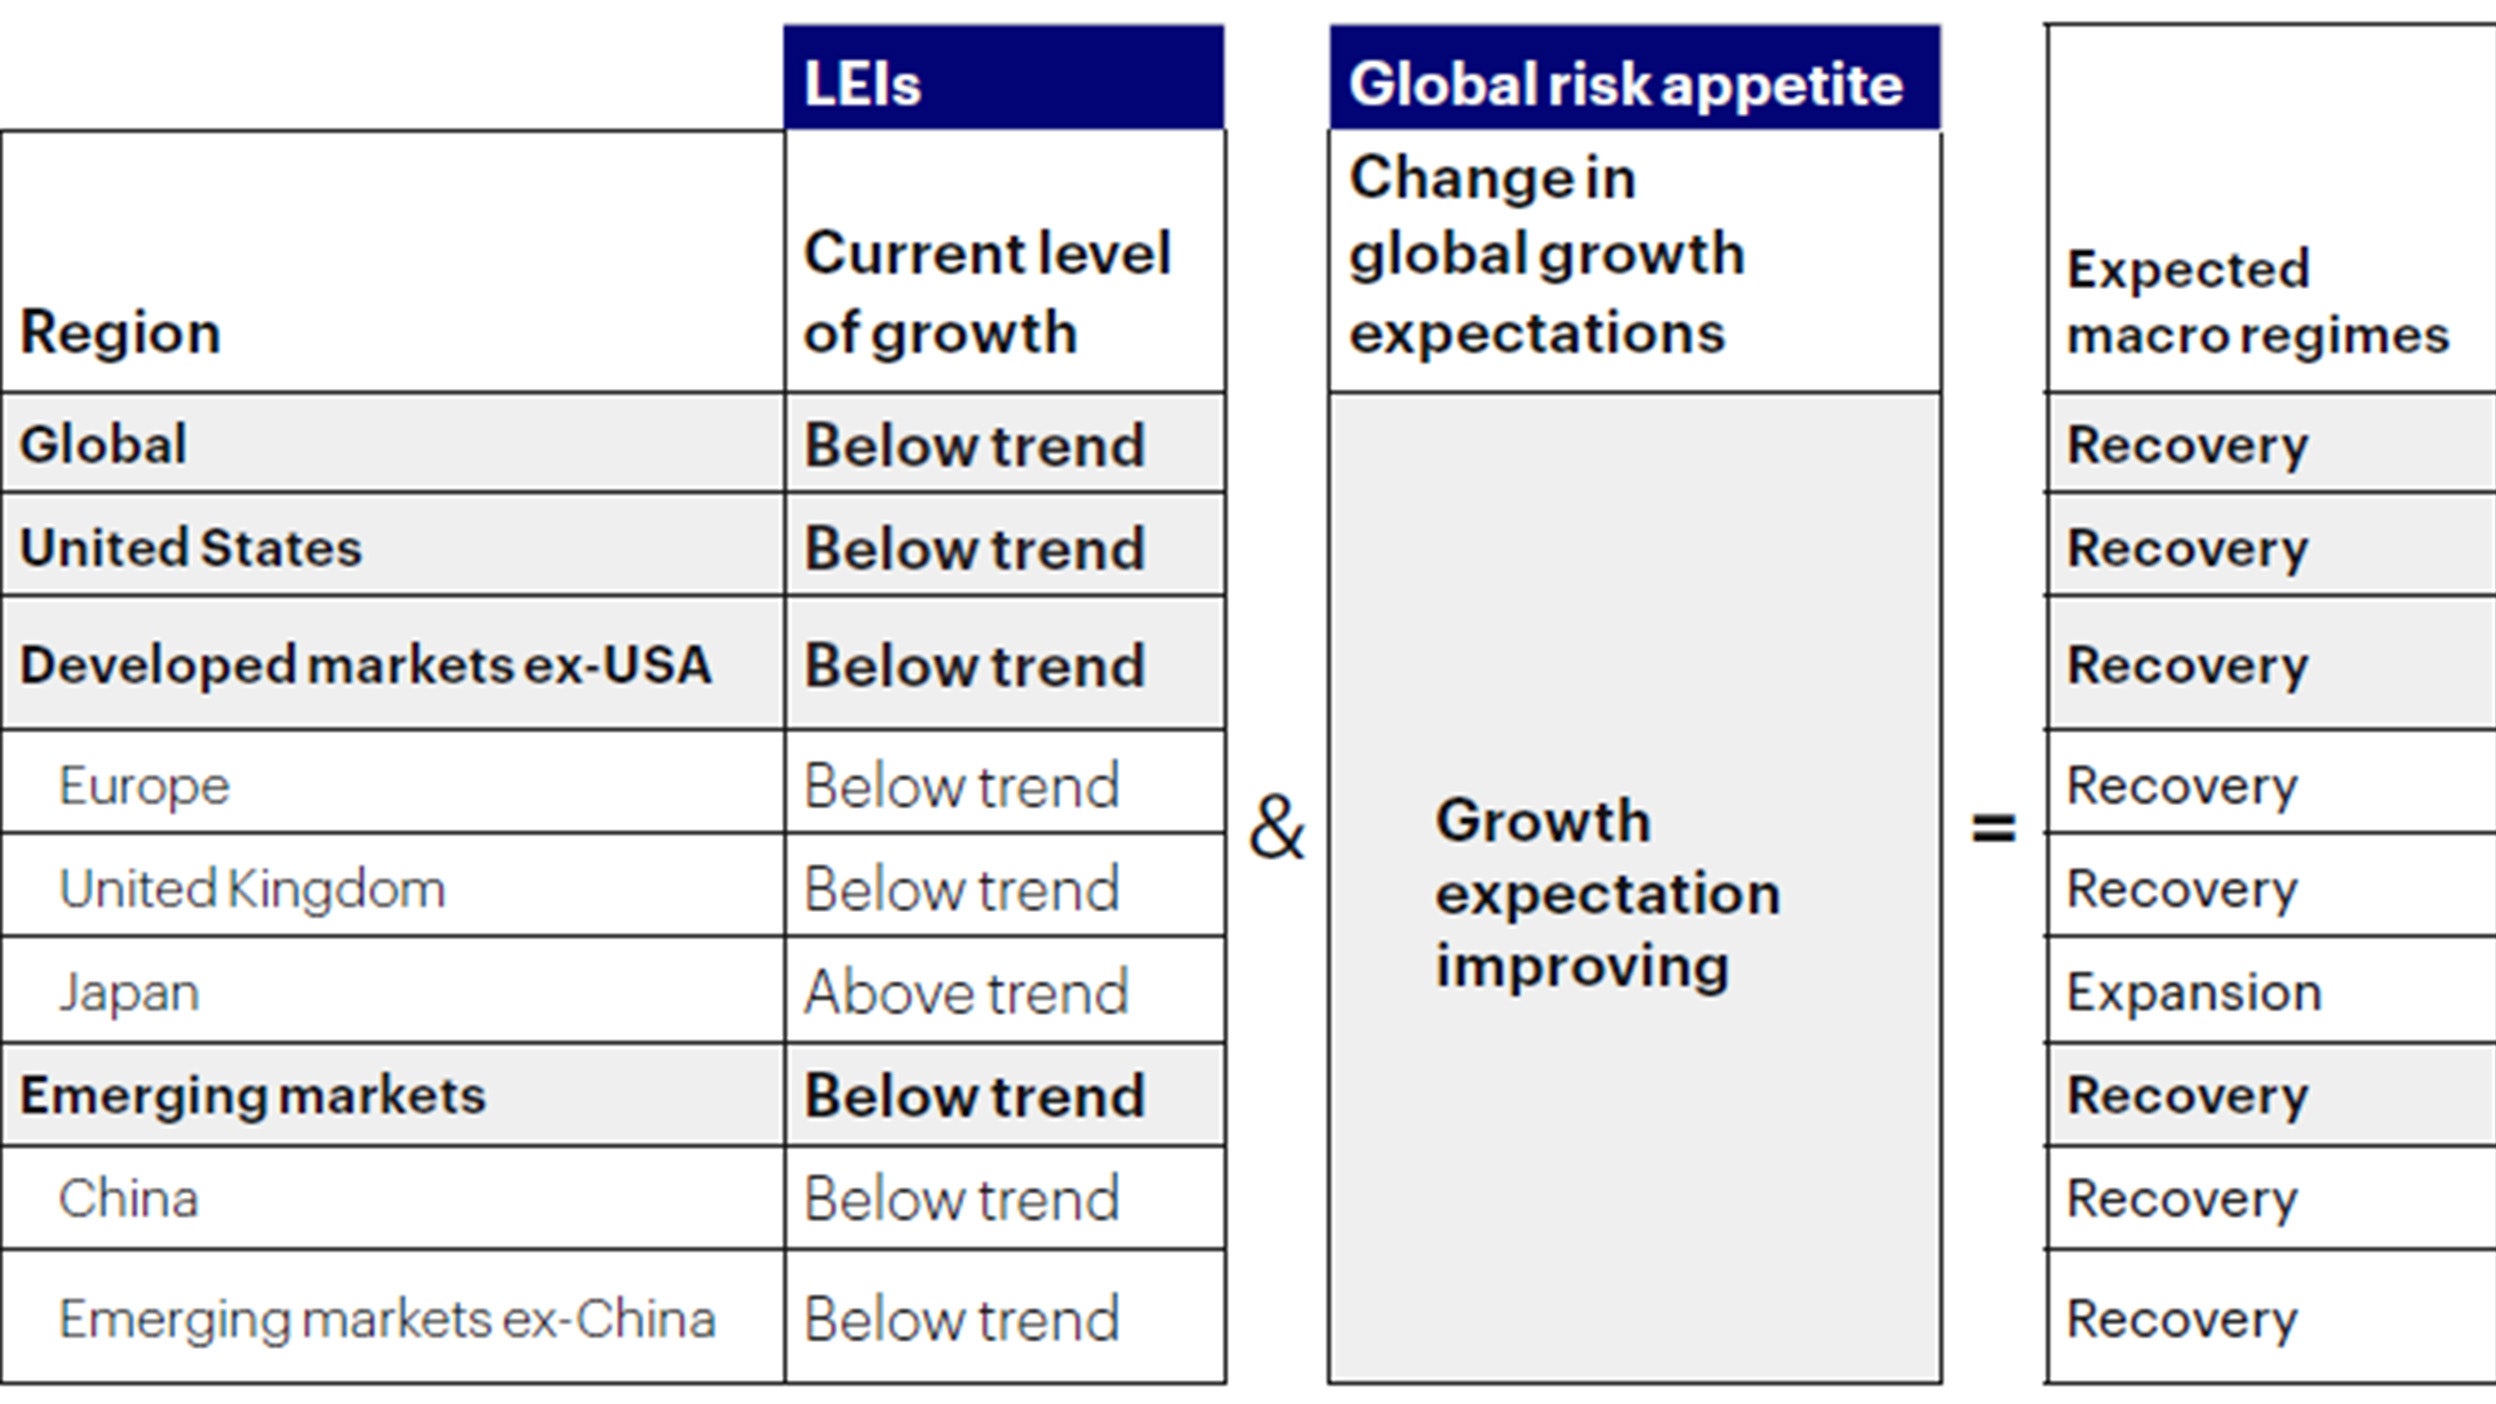
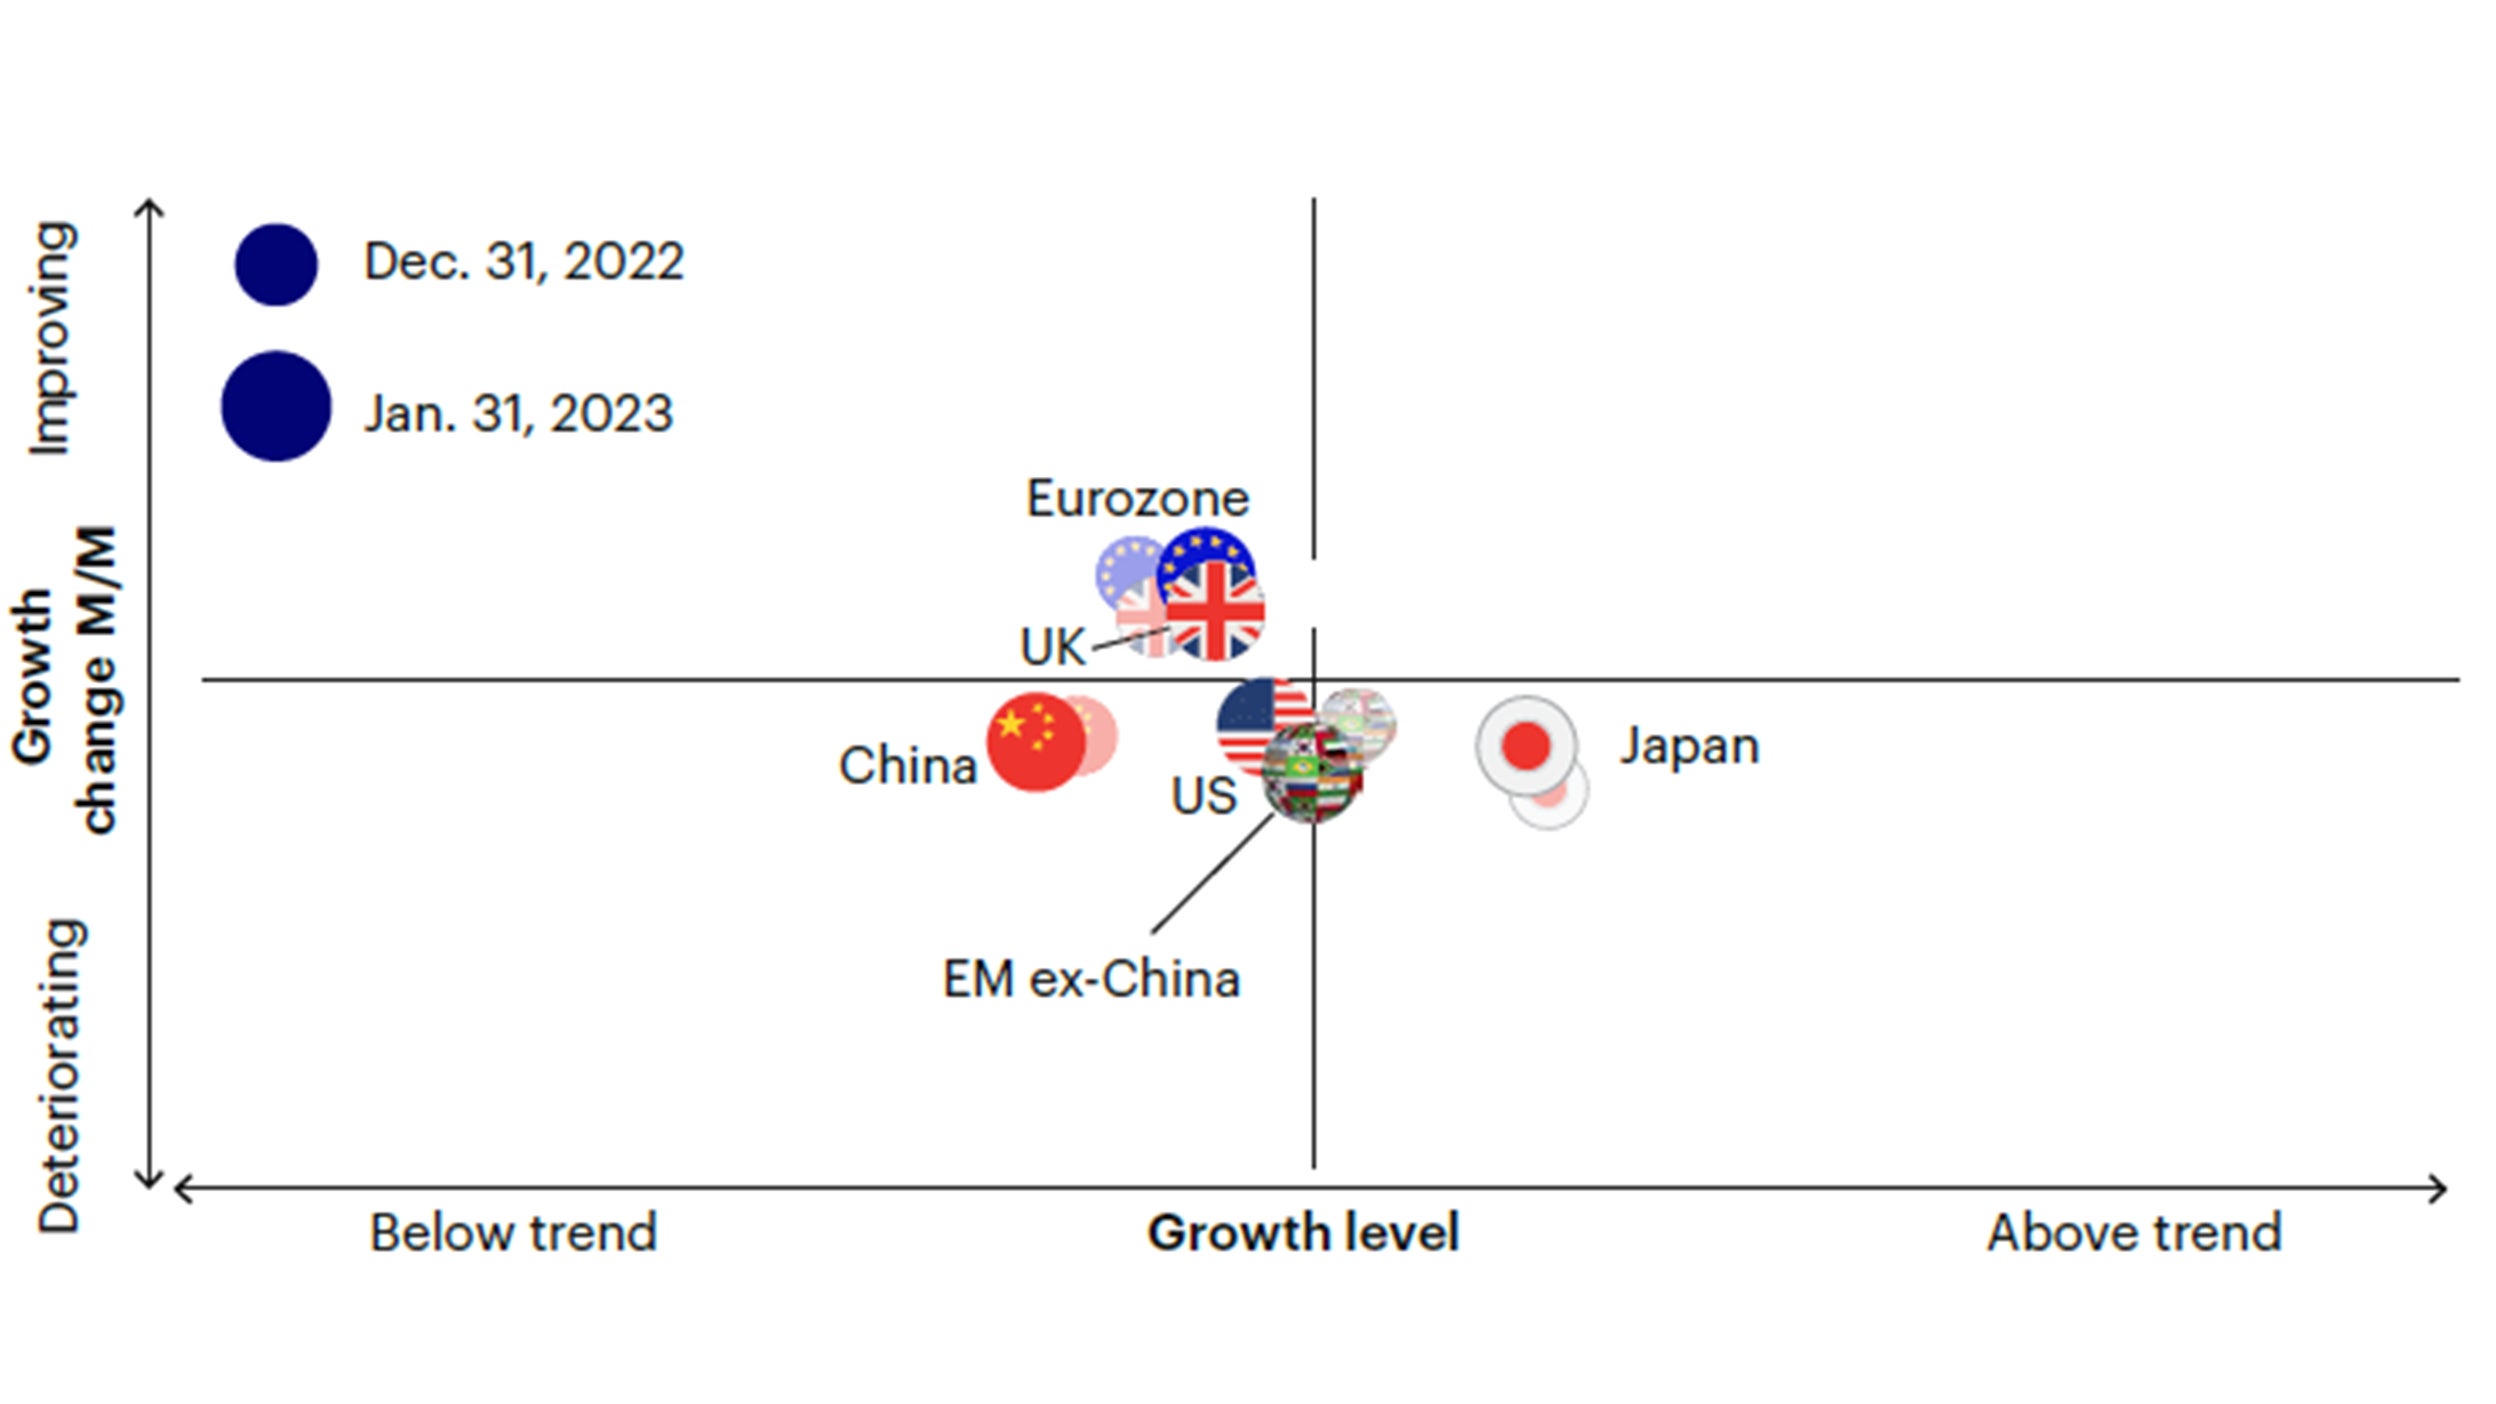
Sources: Bloomberg L.P., Macrobond. Invesco Investment Solutions research and calculations. Proprietary leading economic indicators of Invesco Investment Solutions. Macro regime data as of Jan. 31, 2023. The Leading Economic Indicators (LEIs) are proprietary, forward-looking measures of the level of economic growth. The Global Risk Appetite Cycle Indicator (GRACI) is a proprietary measure of the markets’ risk sentiment.
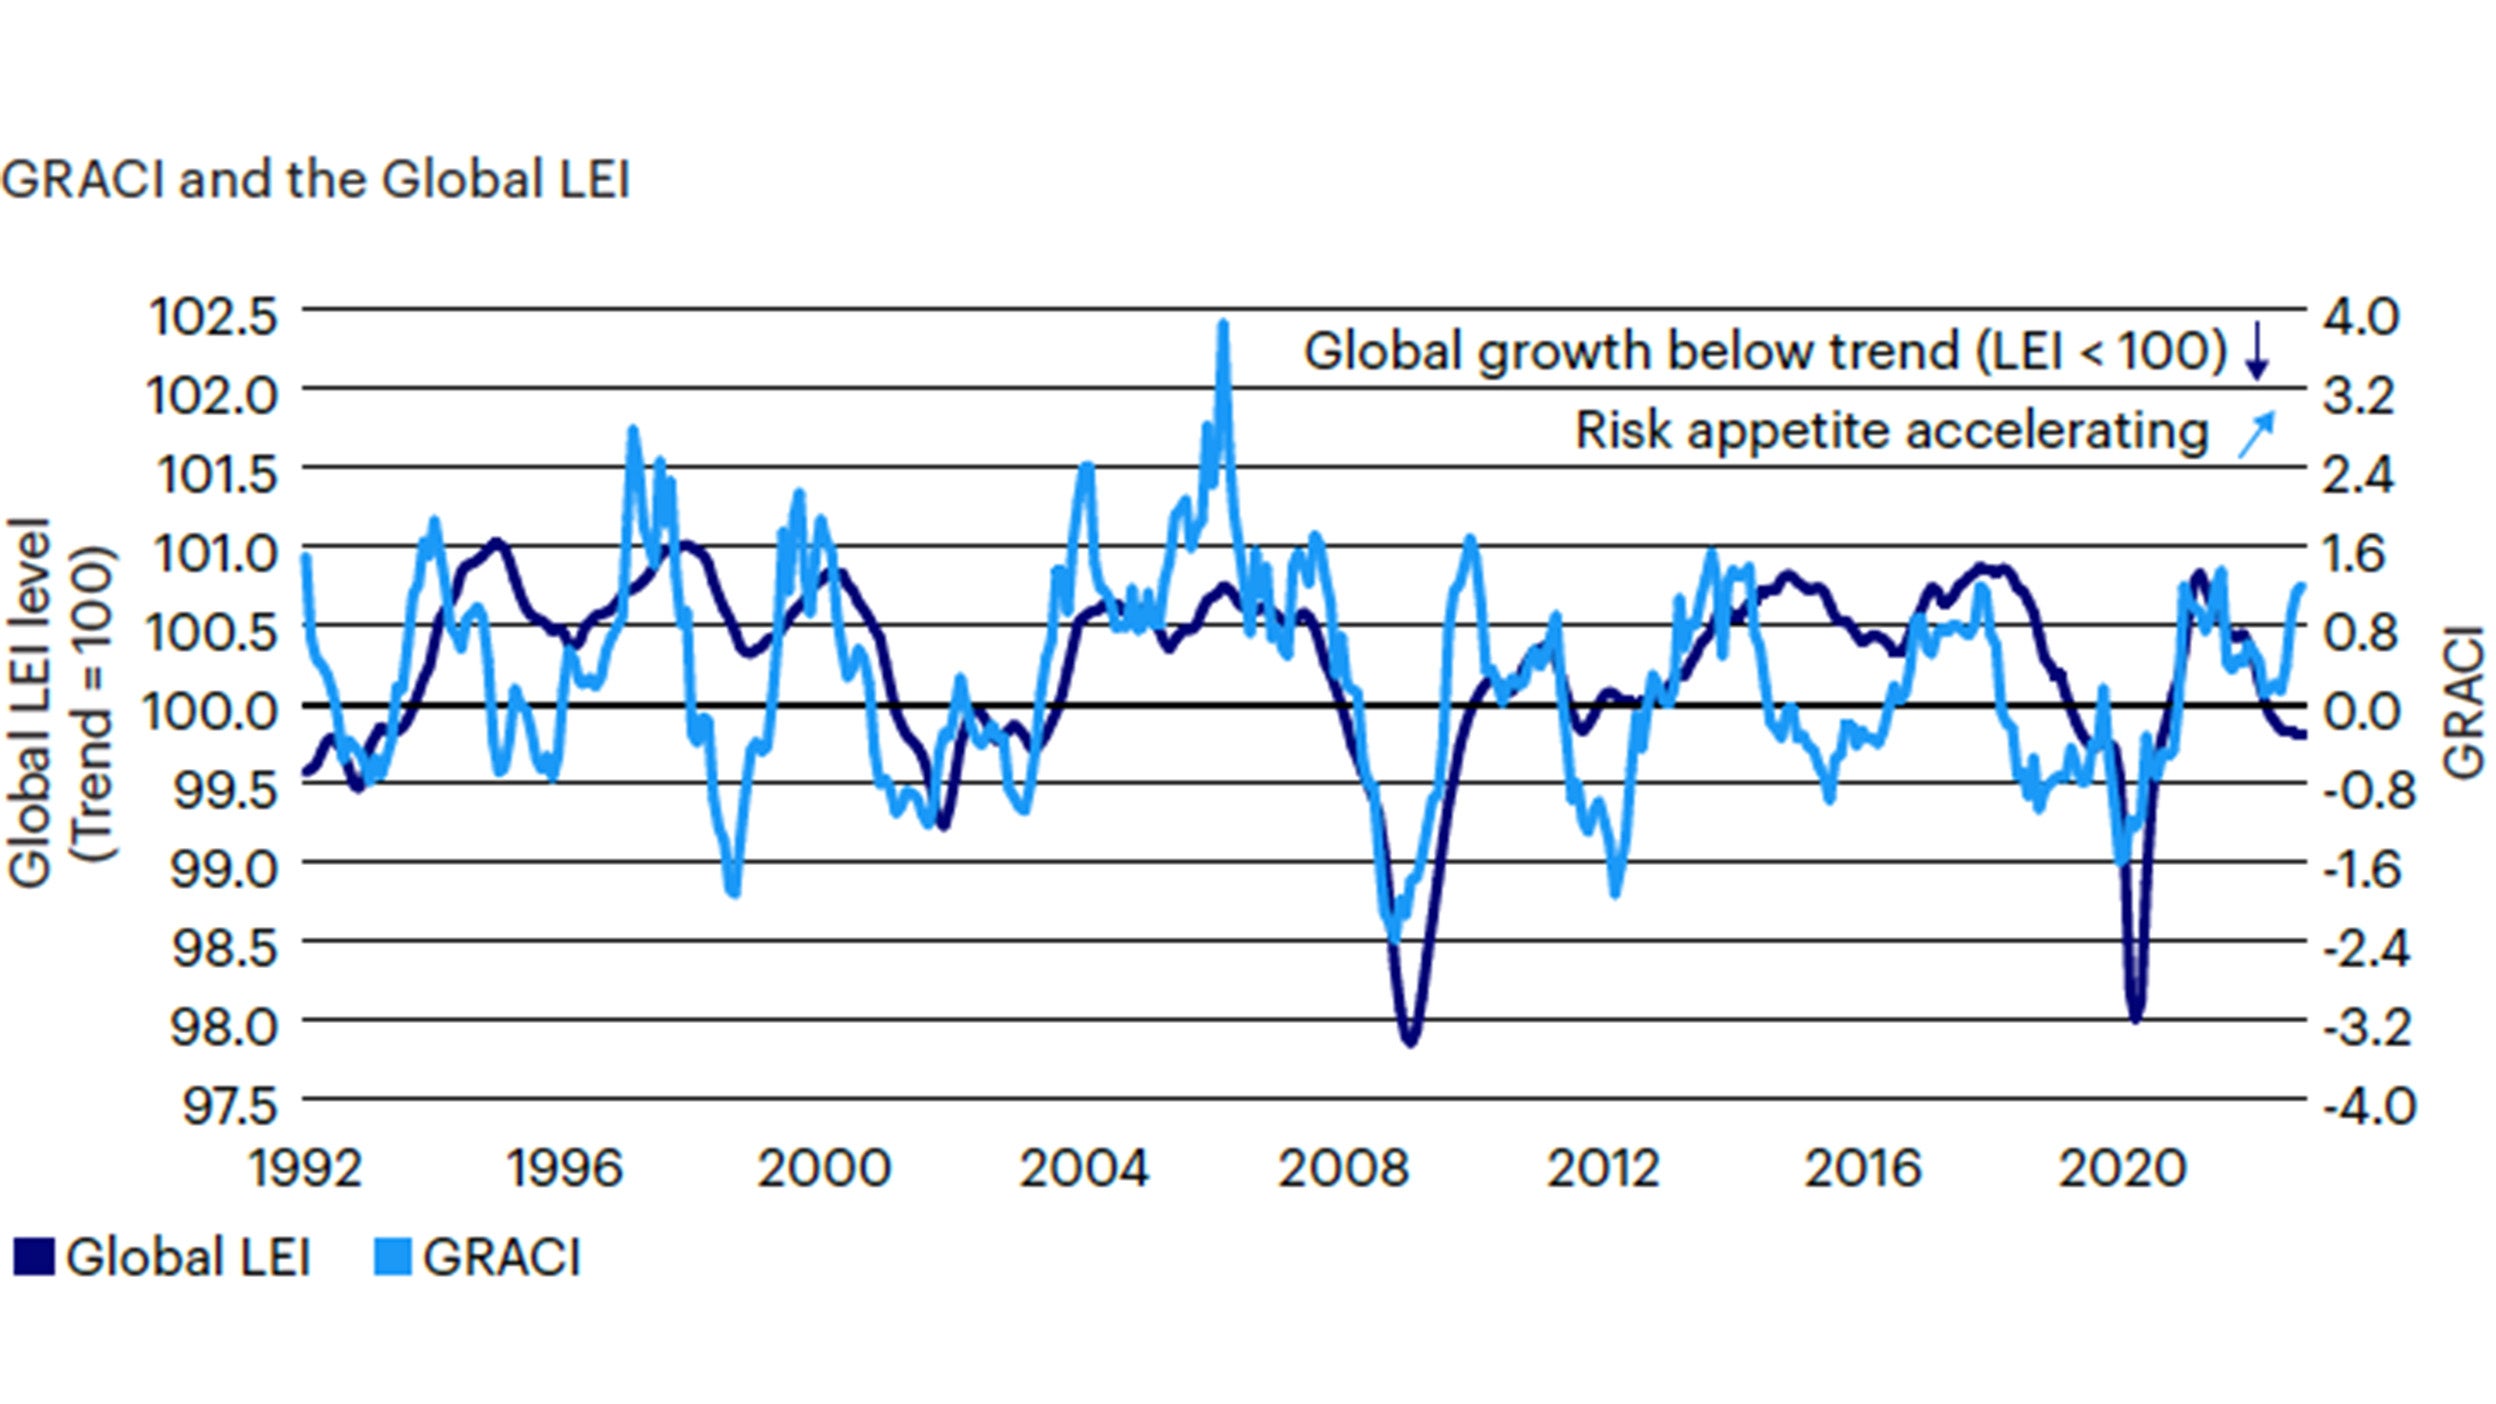
Sources: Bloomberg L.P., MSCI, FTSE, Barclays, JPMorgan, Invesco Investment Solutions research and calculations, from Jan. 1, 1992 to Jan. 31, 2023. The Global Leading Economic Indicator (LEI) is a proprietary, forward-looking measure of the growth level in the economy. A reading above (below) 100 on the Global LEI signals growth above (below) a long-term average. The Global Risk Appetite Cycle Indicator (GRACI) is a proprietary measure of the markets’ risk sentiment. A reading above (below) zero signals a positive (negative) compensation for risk taking in global capital markets in the recent past. Past performance does not guarantee future results.
In contrast to widespread recession fears, our leading indicators point to some green shoots, with consumer sentiment surveys rebounding strongly from all-time lows in the developed world, and the manufacturing cycle in Europe and Emerging Markets showing early evidence of improving momentum. For the third consecutive month, we register a noticeable improvement in European leading economic indicators, suggesting cyclical divergence relative to the US where lagged effects from policy tightening provide headwinds to growth, especially for the housing sector. The strong rebound in China’s manufacturing and service industry surveys in January provides confirmation of economic re-opening after the relaxation of Covid restrictions. High-frequency mobility data covering the Lunar New Year holiday shows signs of a rebound in spending. Global capital markets have re-priced this favorable growth news consistently across asset classes, regions, styles, and sectors, with emerging markets outperforming developed markets, cyclicals outperforming defensives, equities outperforming fixed income and credit spreads tightening. As a result, global risk appetite continues to rise, presaging a recovery in global growth, led by Europe and emerging markets (Figure 1 and Figure 2).
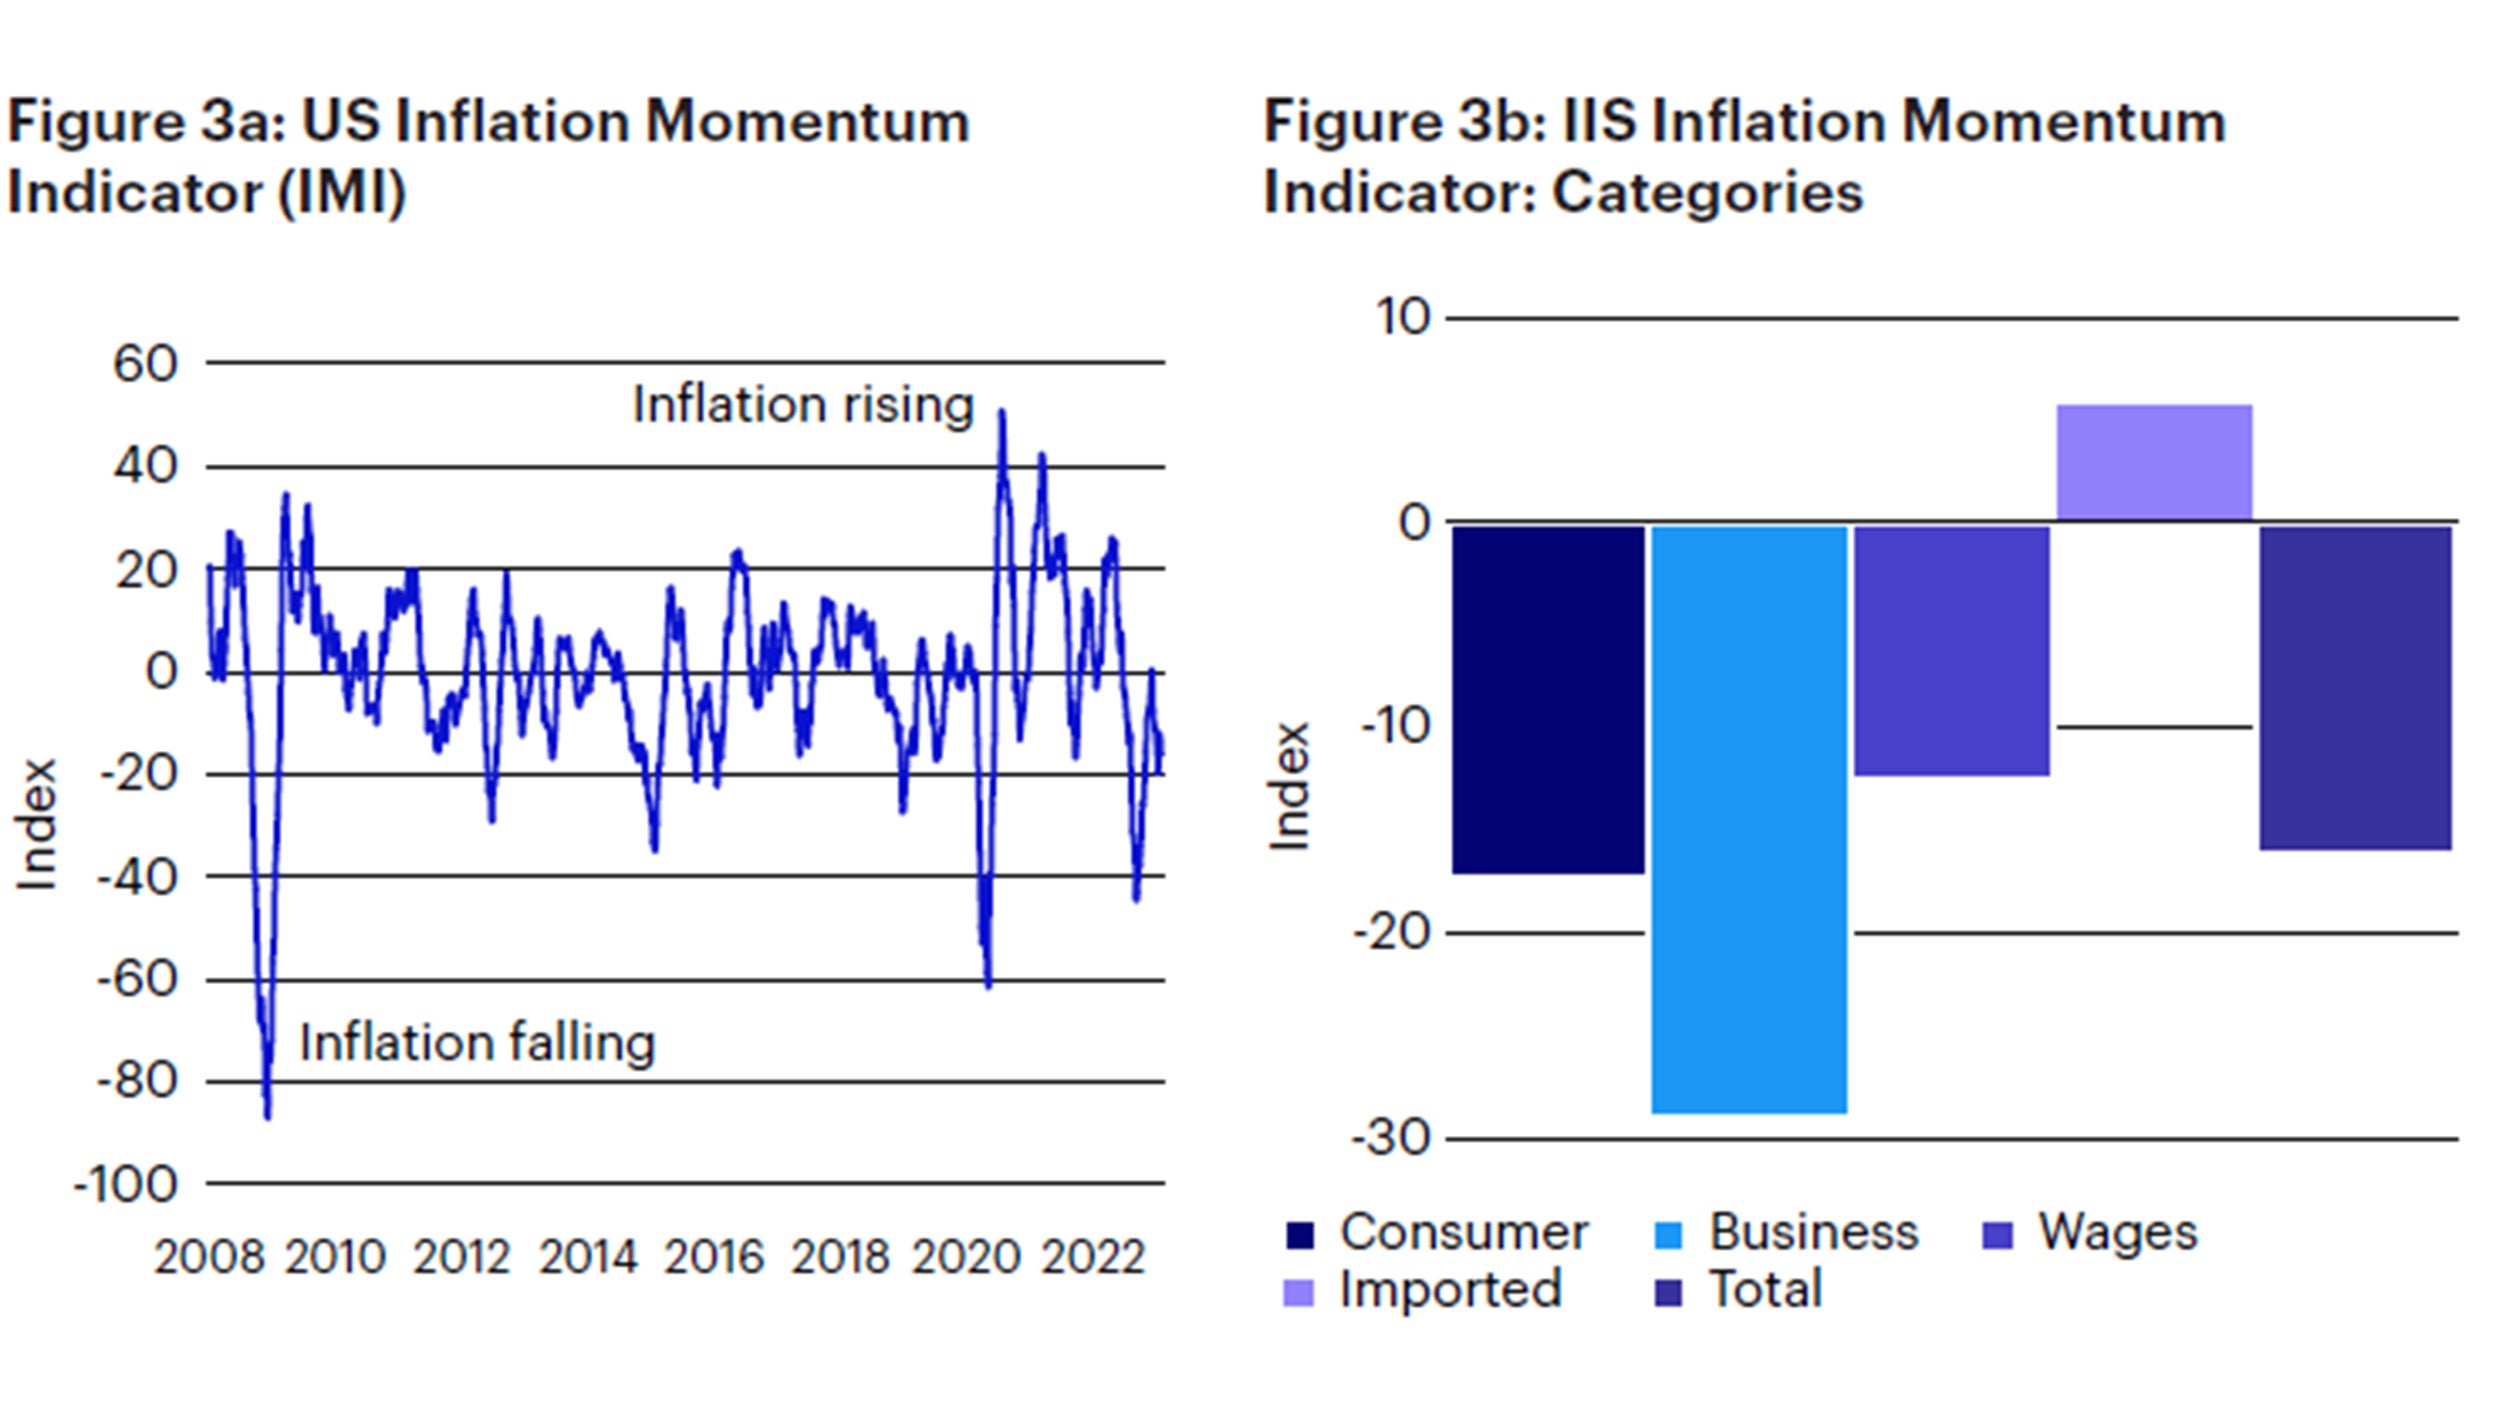
Sources: Bloomberg L.P. data as of Jan. 31, 2023, Invesco Investment Solutions calculations. The US Inflation Momentum Indicator (IMI) measures the change in inflation statistics on a trailing three-month basis, covering indicators across consumer and producer prices, inflation expectation surveys, import prices, wages, and energy prices. A positive (negative) reading indicates inflation has been rising (falling) on average over the past three months.
Despite the positive news flow, growth risks remain elevated, with the long and variable lags of monetary policy tightening yet to be fully reflected in US economic activity, and the European Central Bank (ECB) continues to aggressively hike interest rates, following the path already laid out by the Federal Reserve. However, we expect a more supportive policy environment from China, where regulatory tightening appears to have peaked both for the tech sector and property development. It will be important to see how inflationary this growth impulse will be, potentially derailing the lower inflation trend of the past few months.
Investment positioning
There were no changes in portfolio positioning over the past month. We maintain an overweight risk stance in the Global Tactical Allocation Model relative to benchmark, favoring equities over fixed income, overweighting emerging markets, cyclical sectors, and factors (value, small/mid-caps). We overweight credit risk through high yield, loans, and emerging markets debt relative to investment grade credit, and stay neutral on duration. We remain underweight the US dollar (Figure 4, 5, 6, 7).
In particular:
- Within equities we overweight cyclical factors with high operating leverage such as value and (small) size, while we underweight defensive factors as low volatility and quality. We underweight momentum as inflection points in the market cycle tend to generate reversal effects between recent winners and losers. Similarly, we favor exposures to cyclical sectors such as financials, industrials, materials, and energy at the expense of health care, staples, utilities, and technology. From a regional perspective, we overweight emerging markets and developed ex-US equities, supported by improving risk appetite, expectations for US dollar depreciation, and positive economic momentum in Europe.
- In fixed income despite recent spread compression and spreads now hovering around historical averages, we continue to overweight risky credit via high yield, bank loans and emerging markets hard currency debt. In this environment of below trend and improving growth, risky credit offers an attractive tactical opportunity for equity-like returns with lower volatility. The exposure is funded from investment grade and government bonds, while we maintain a neutral duration stance relative to benchmark. We expect additional compression in breakeven inflation expectations as inflation momentum continues to slow, hence favor nominal over inflation-linked bonds.
- In currency markets we remain underweight the US dollar, as global growth is outperforming relative to expectations and recovery regimes are typically accompanied by strong flows into non-US assets. While yield differentials still support the US dollar relative to foreign currencies, expensive valuations provide headwind to the greenback at a time when risk appetite is improving and monetary policy in Europe and Japan is getting tighter. Within developed markets we favor the euro, the British pound, Norwegian kroner and Swedish krona relative to the Swiss Franc, Japanese yen, Australian and Canadian dollars. In EM we favor high yielders with attractive valuations as the Colombian peso and Brazilian real, relative to low yielding currencies as the Korean won, Taiwan dollar and Chinese renminbi.
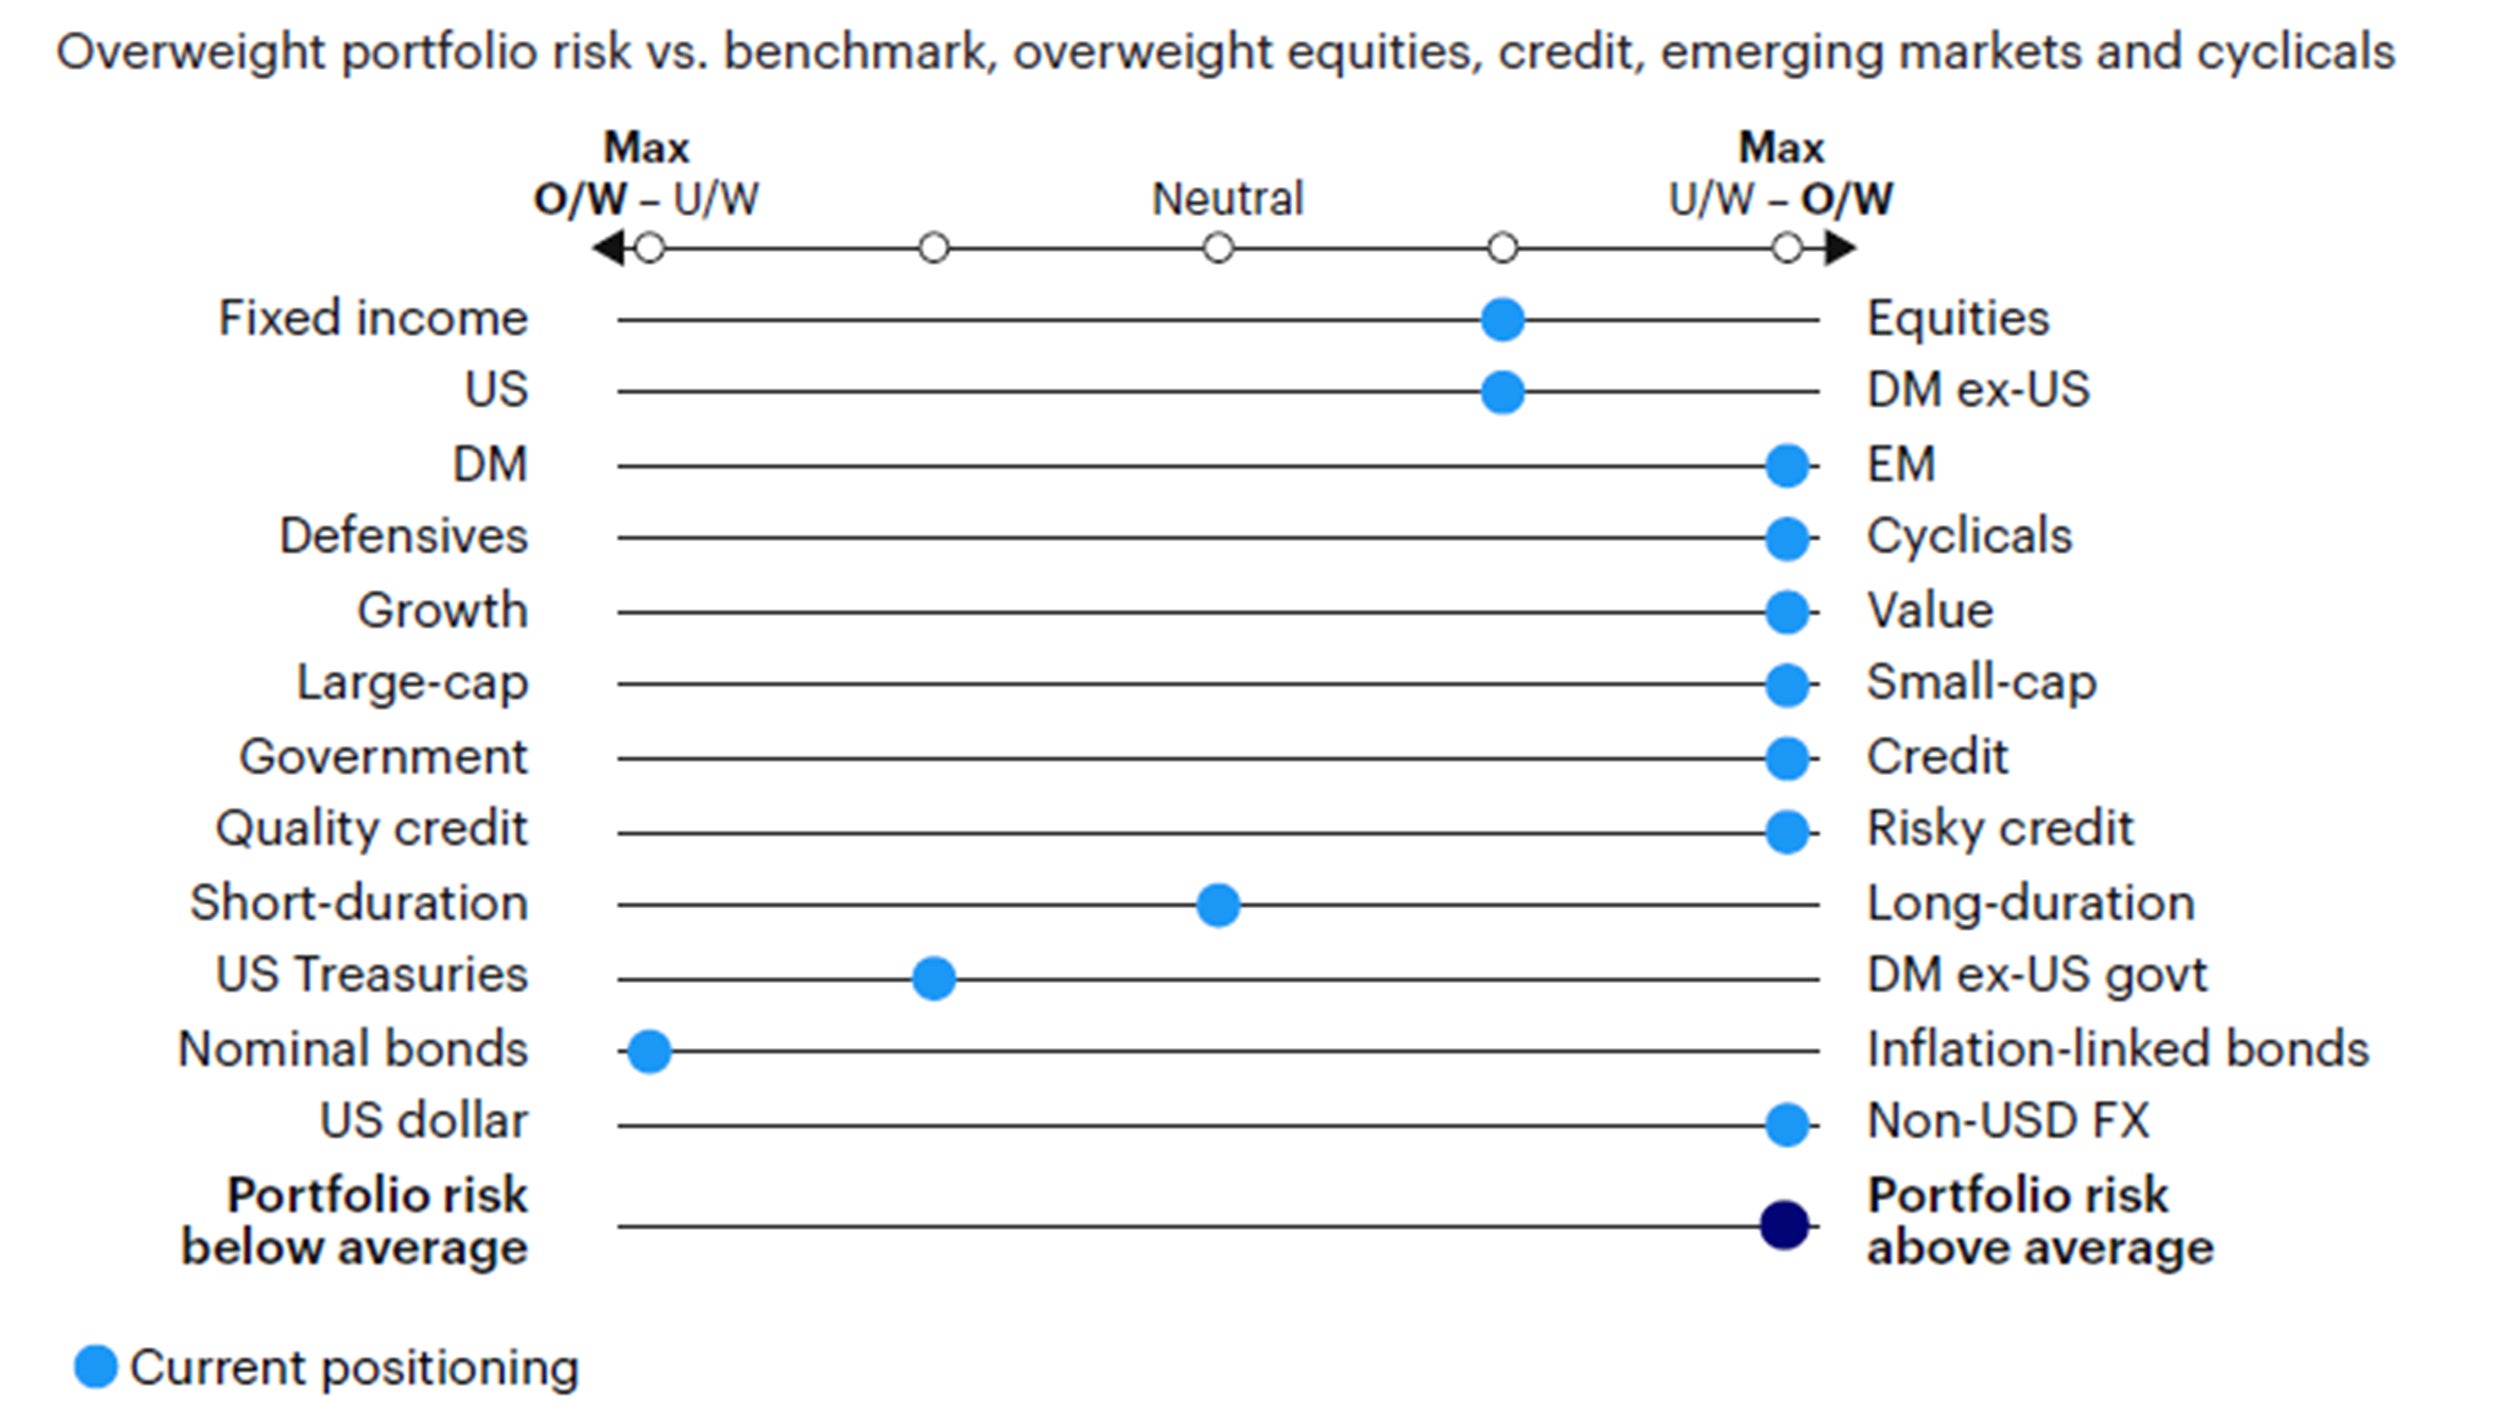
Source: Invesco Investment Solutions, Jan. 31, 2023. DM = developed markets. EM = emerging markets. Non-USD FX refers to foreign exchange exposure as represented by the currency composition of the MSCI ACWI Index. For illustrative purposes only.
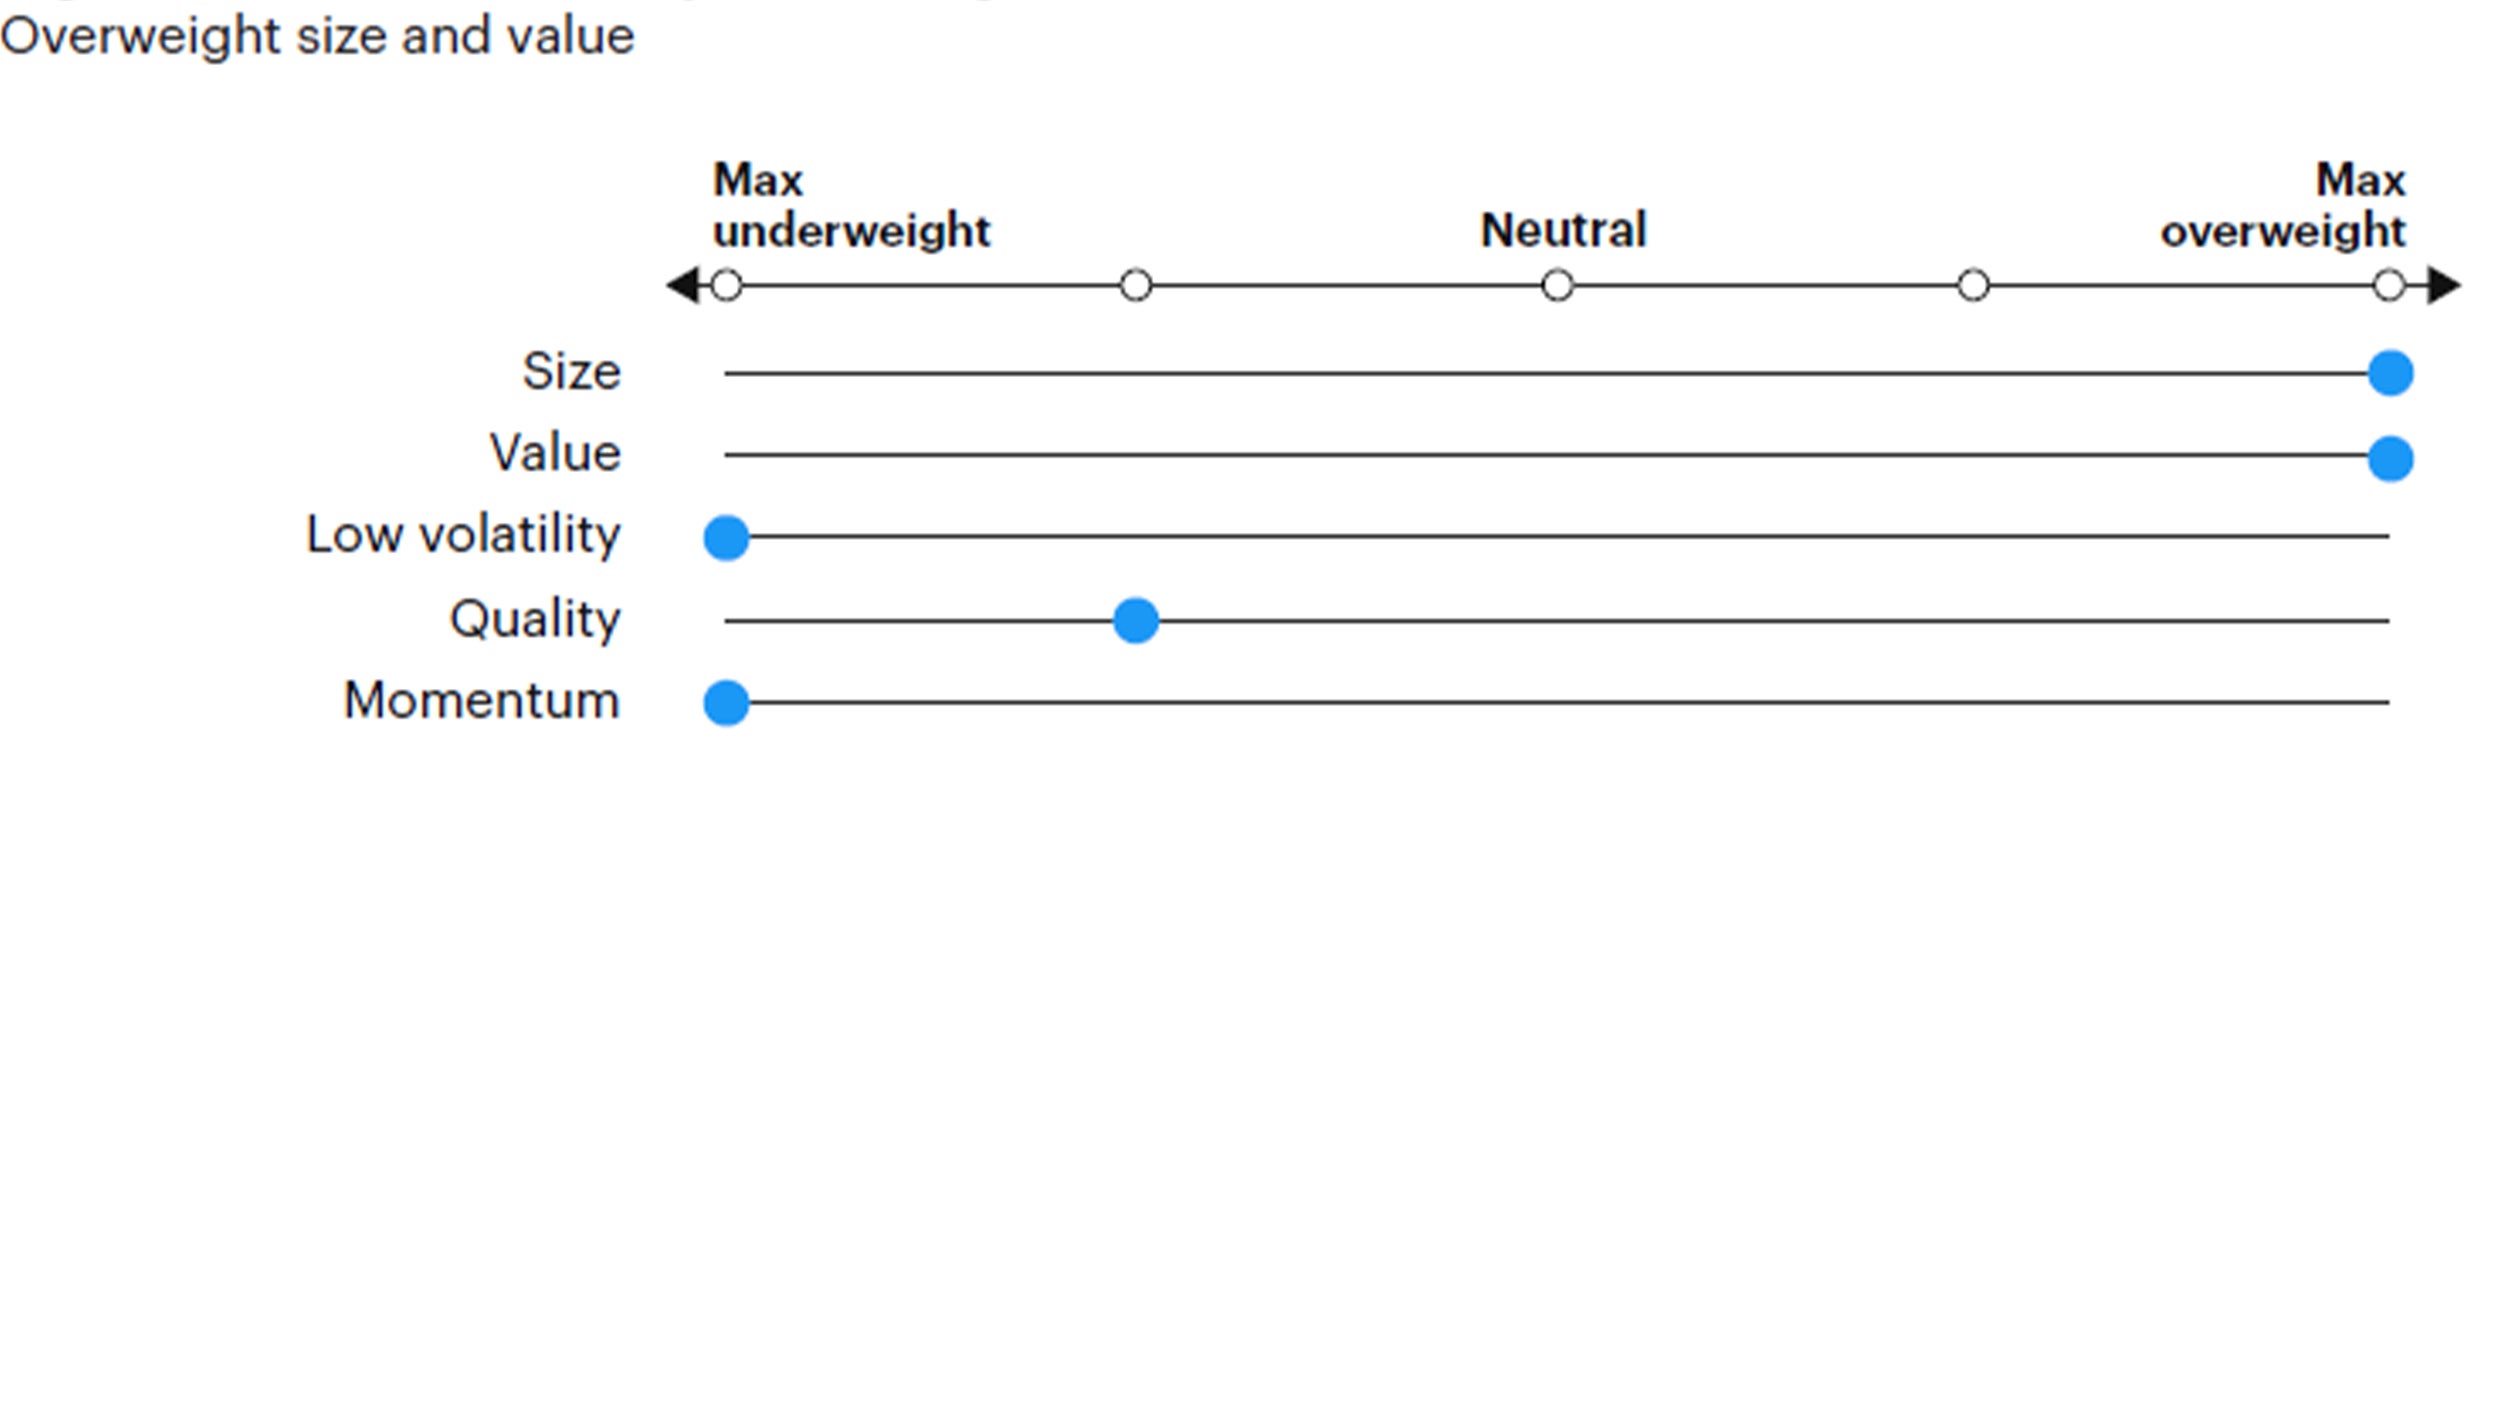
Source: Invesco Investment Solutions, Jan. 31, 2023. For illustrative purposes only. Neutral refers to an equally weighted factor portfolio.
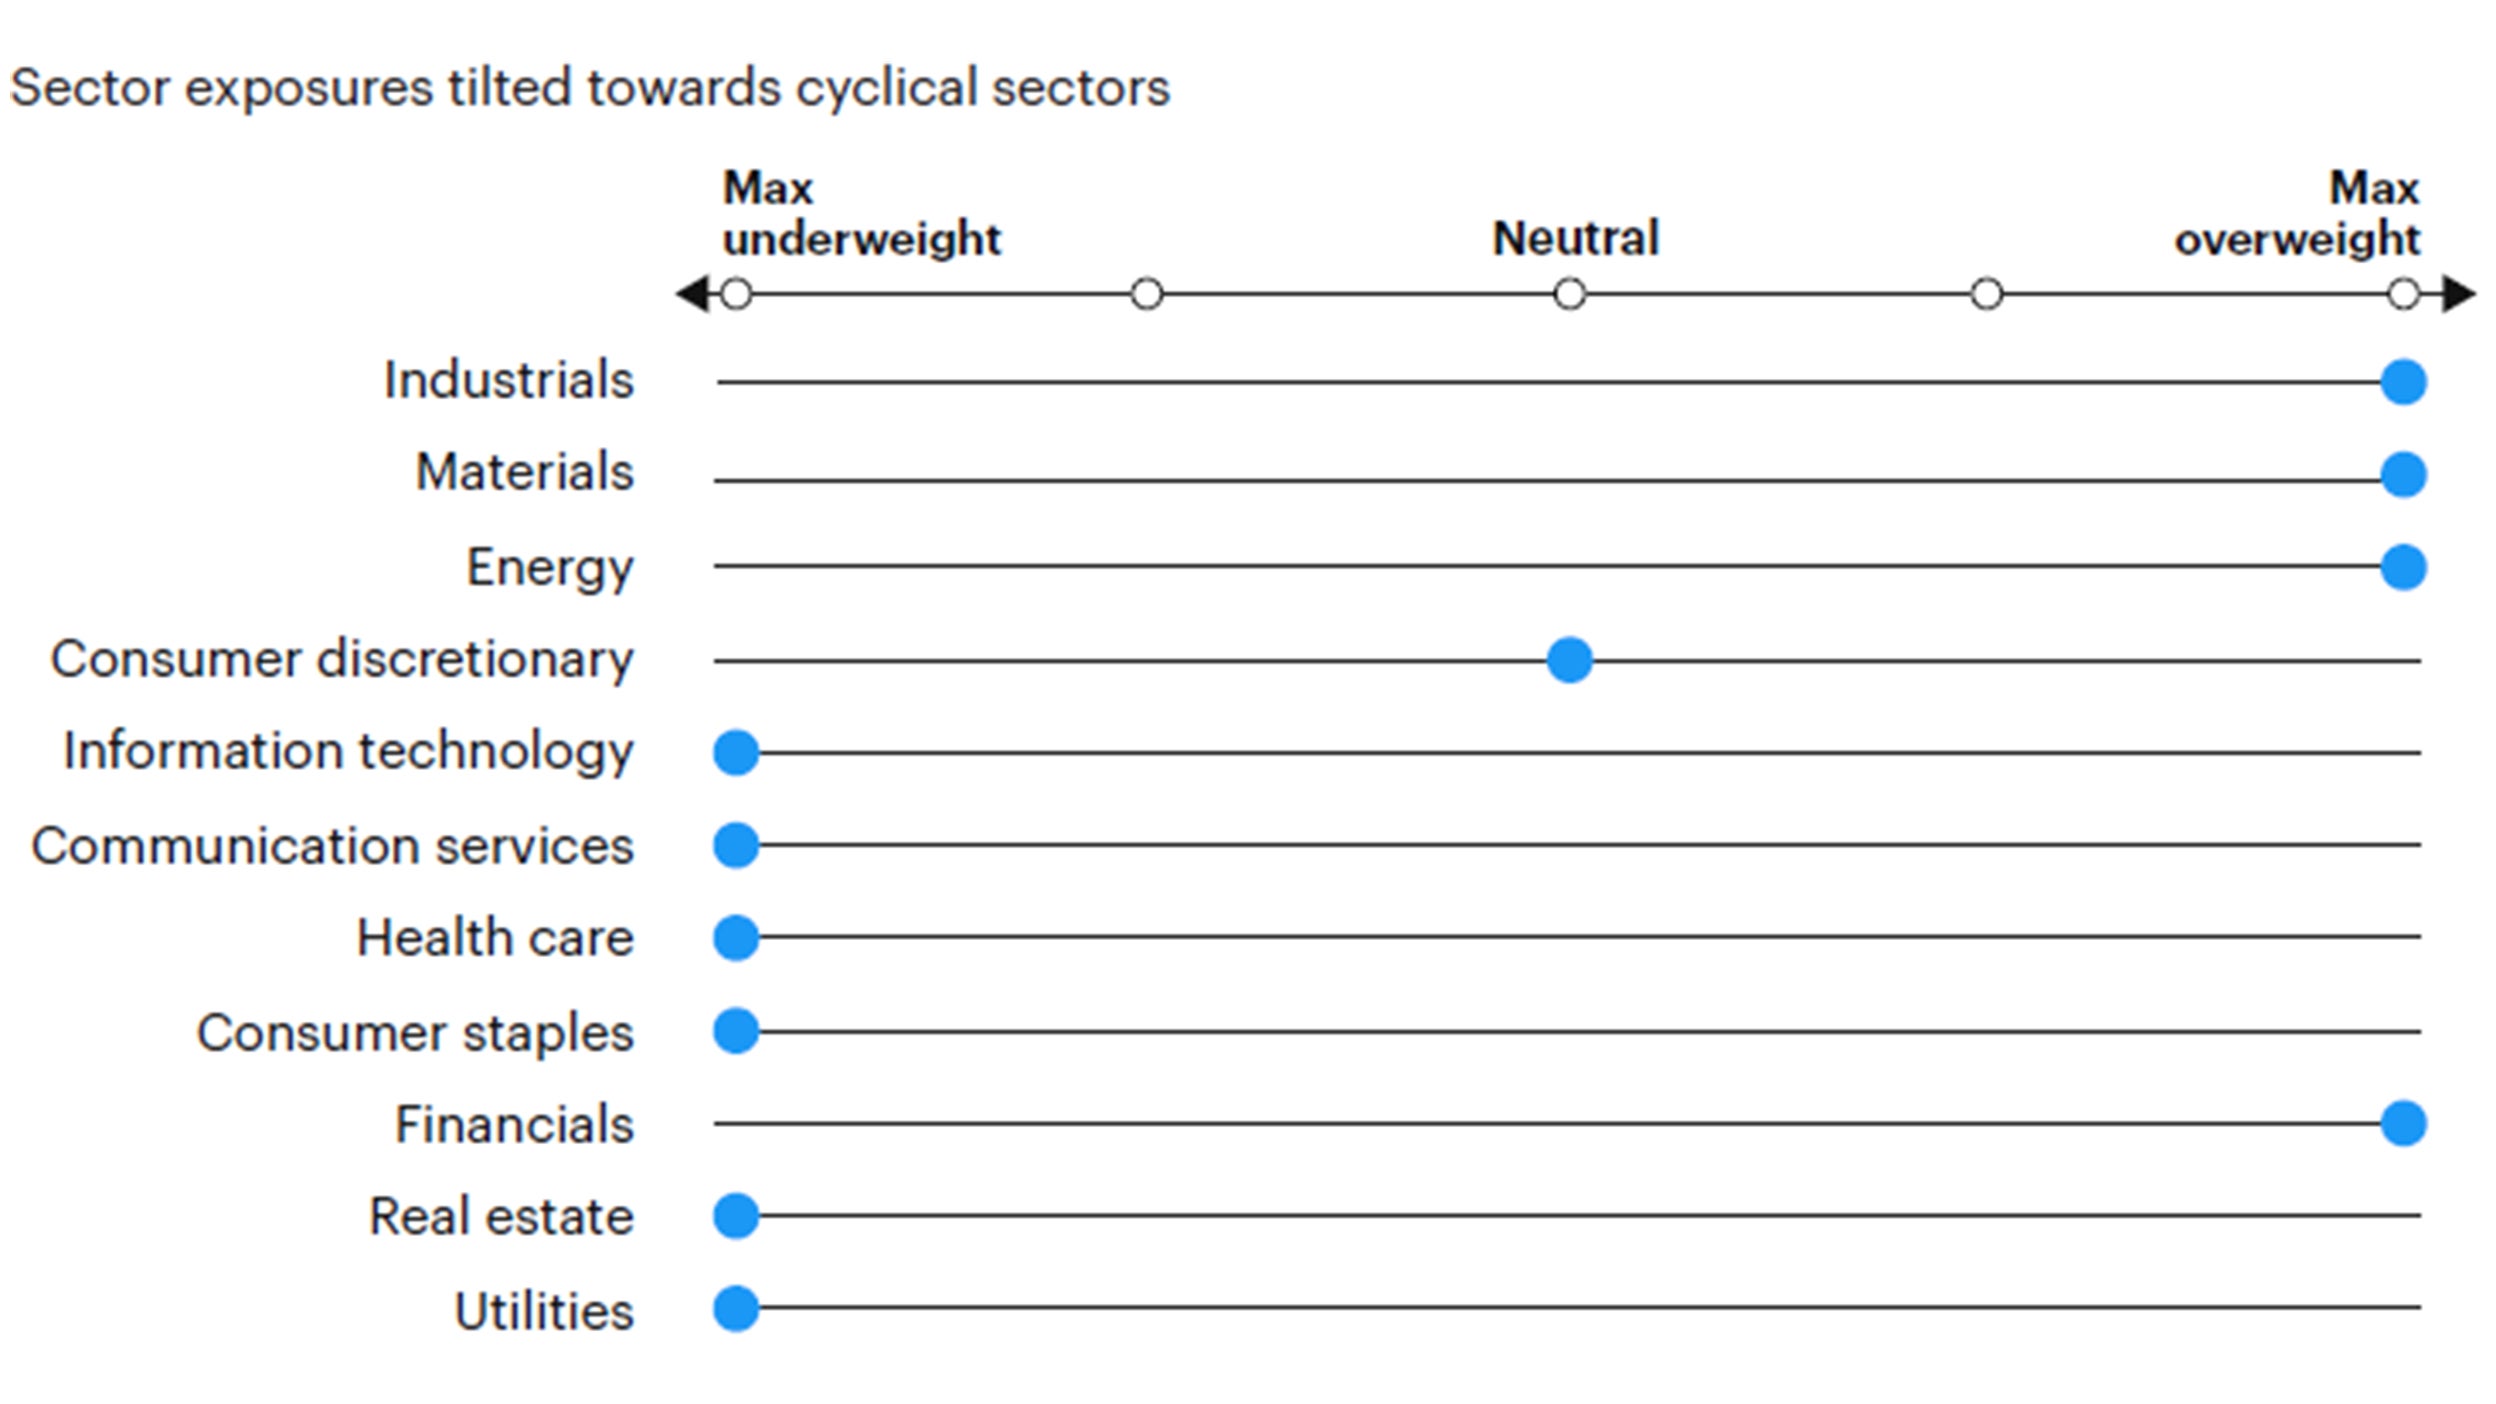
Source: Invesco Investment Solutions, Jan. 31, 2023. For illustrative purposes only. Sector allocations derived from factor and style allocations based on proprietary sector classification methodology. As of November 30th,from factor and style allocations based on proprietary sector classification methodology. As of November 30th, 2022, Cyclicals: energy, financials, industrials, materials; Defensives: consumer staples, health care, information technology, real estate, communication services, utilities; Neutral: consumer discretionary.
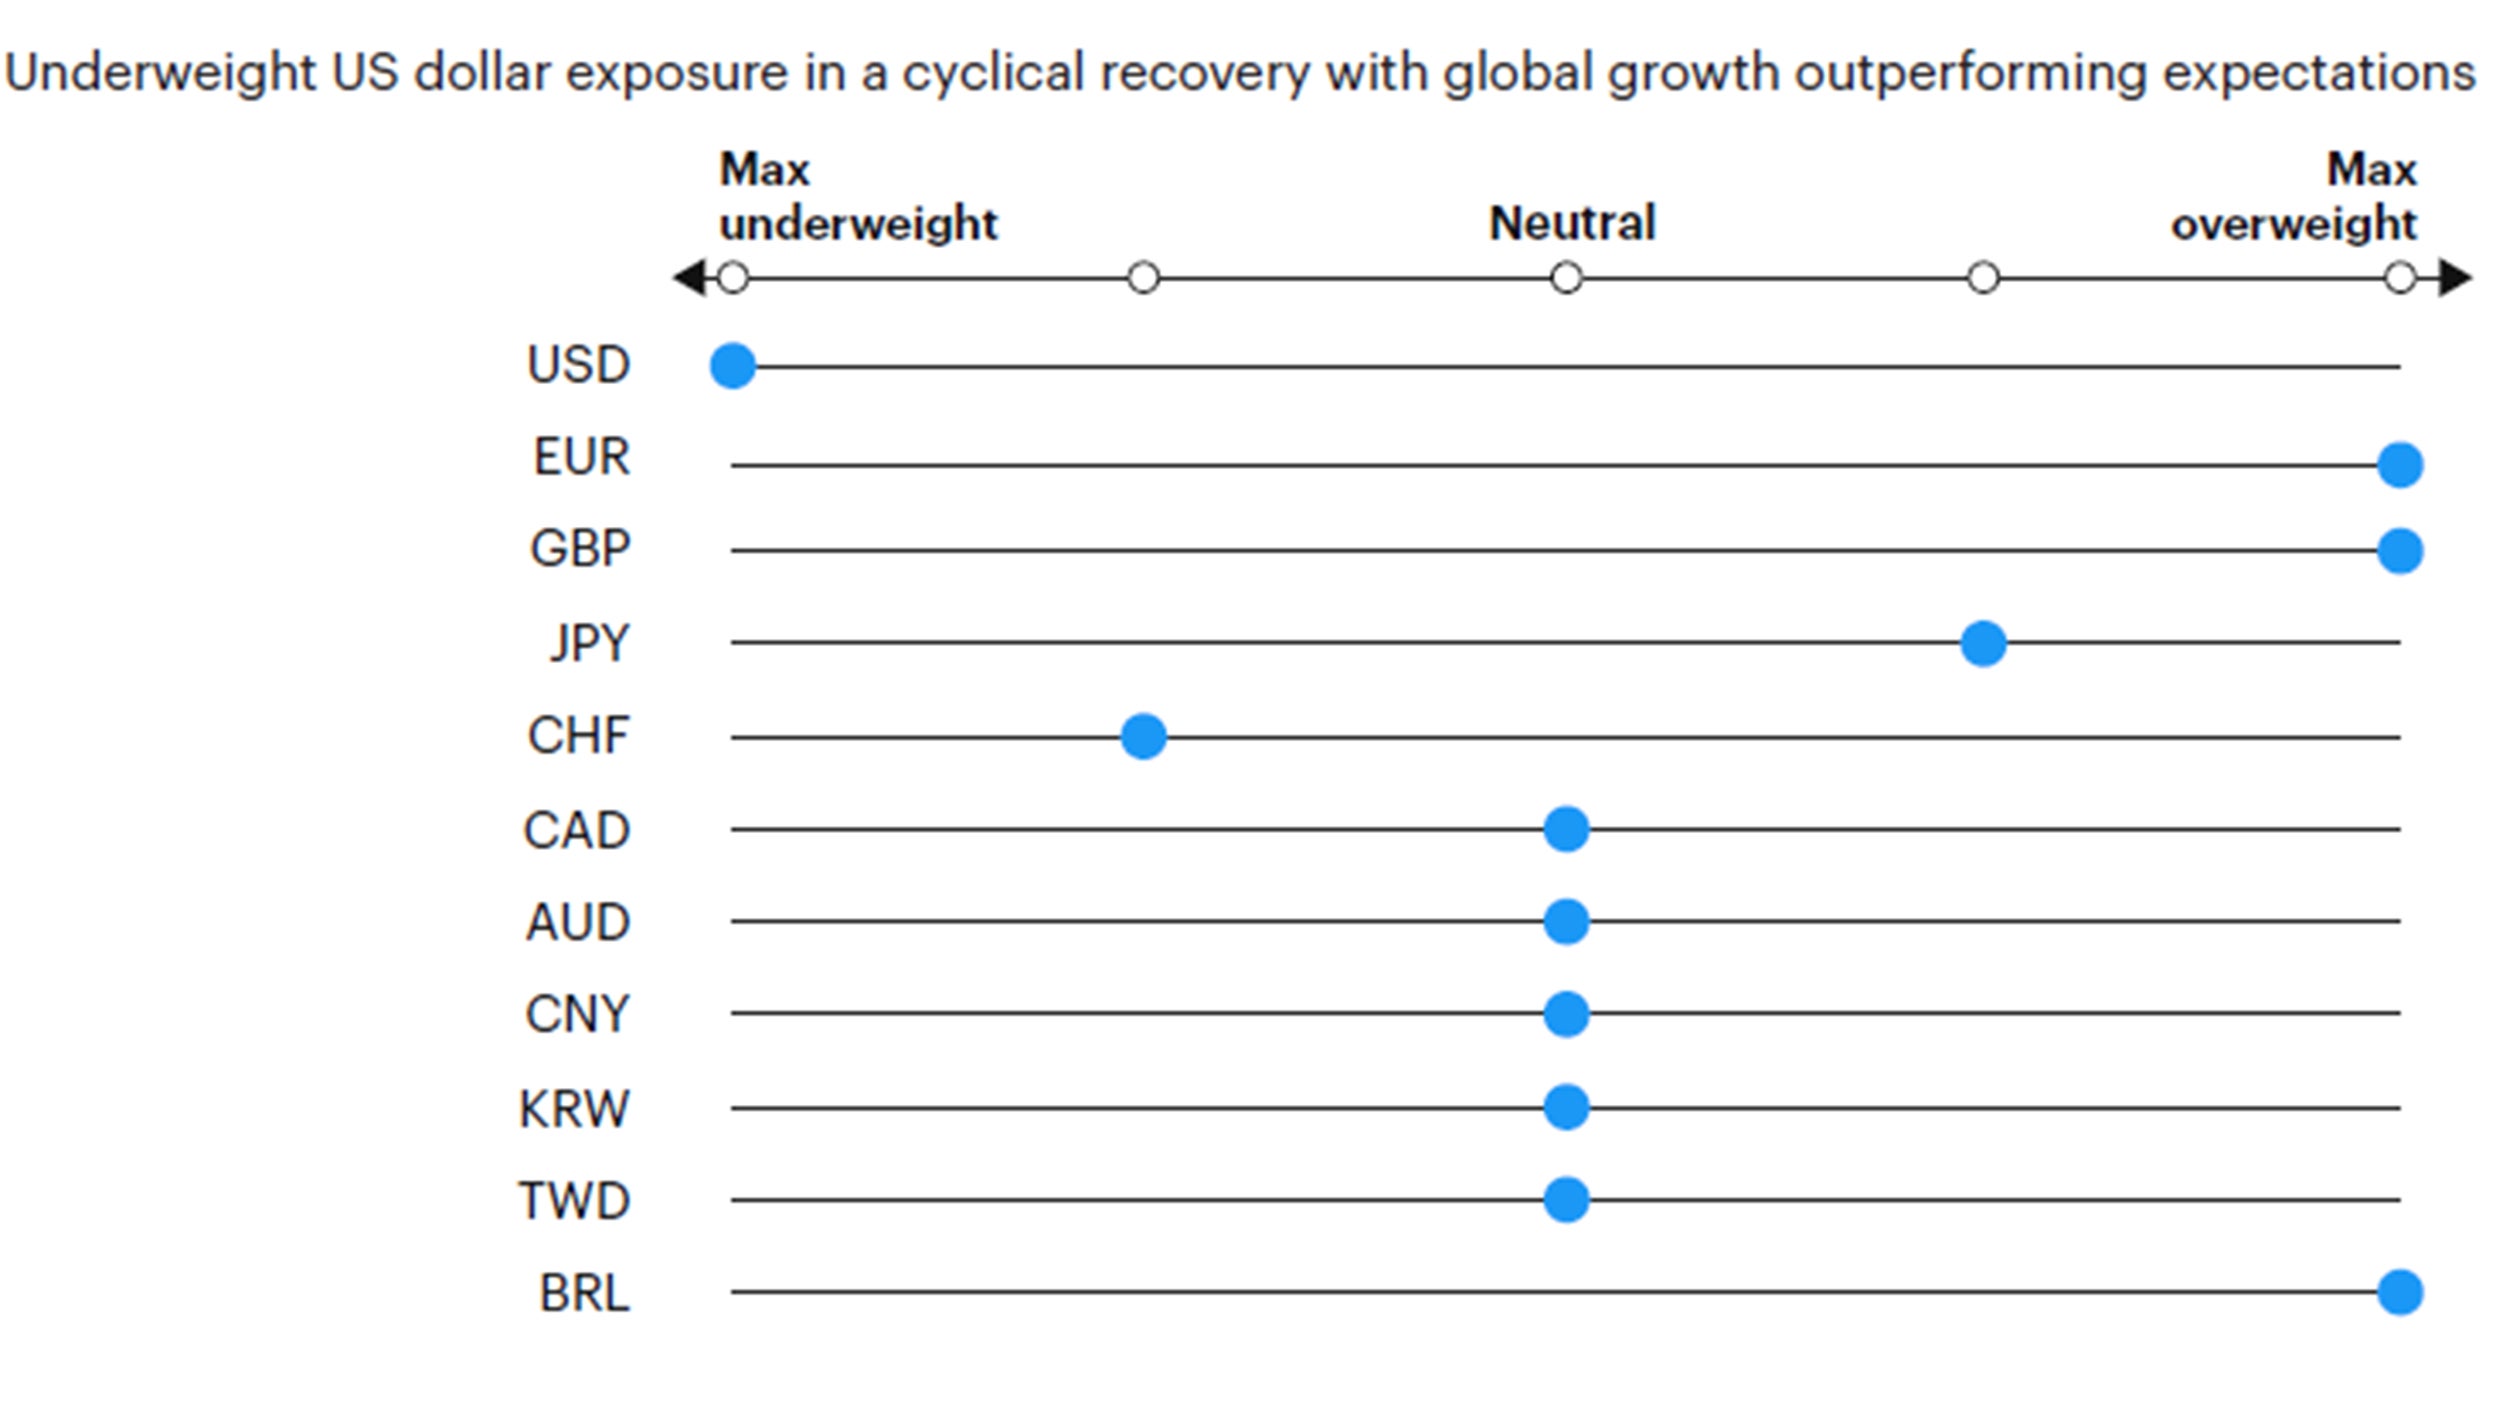
Source: Invesco Investment Solutions, Jan. 31, 2023. For illustrative purposes only. Currency allocation process considers four drivers of foreign exchange markets: 1) US monetary policy relative to the rest of the world, 2) global growth relative to consensus expectations, 3) currency yields (i.e., carry), 4) currency long-term valuations
FOOTNOTES
-
1
Global 60/40 benchmark (60% MSCI ACWI, 40% Bloomberg Global Aggregate USD Hedged).
-
2
See Tactical Asset Allocation – December 2022 Update.
-
3
Consumer inflation expectations measured via University of Michigan Survey of median expected change in prices over the next year. Breakeven inflation expectations refer to the spread between nominal US Treasuries and Treasury Inflation Protected Securities (TIPS)


