Tactical Asset Allocation - December 2024

Synopsis
While the outcome of the US election may seemingly represent a sudden change to the market cycle, we are skeptical of this interpretation and look at the experience from 2016 to draw valuable lessons. Markets promptly absorb new information and eventually return to focusing on traditional drivers of performance such as monetary policy, the growth cycle, and inflation.
Our framework remains in a contraction regime. We maintain a cautious asset allocation versus benchmark, overweighting fixed income relative to equities, favoring US equities over developed ex-US and emerging markets, and overweighting defensive sectors with quality and low volatility characteristics. In fixed income, we remain overweight duration and underweight credit risk. Maintain overweight to the US dollar.
Maintain defensive portfolio positioning. Overweight fixed income vs. equities, favoring US equities over developed ex-US and emerging markets, defensive equity factors, higher duration, and credit quality.
Our macro process drives tactical asset allocation decisions over a time horizon between six months and three years, on average, seeking to harvest relative value and return opportunities between asset classes (e.g., equity, credit, government bonds, and alternatives), regions, factors, and risk premia.
Macro update
Despite positive sentiment towards US growth prospects following the US election, uncertainty surrounding global trade policies continues to exert a drag on global markets and, as a result, on market sentiment outside the US. Our barometer of global risk appetite has modestly improved over the past month but is yet to flag a sufficient rebound and inflection point in the cycle. However, global growth remains broadly stable around the world. Our macro framework remains in a contraction regime, signaling growth below-trend and decelerating growth expectations (Figures 1 and 2). On a positive note, following the heightened volatility in Chinese equity markets between September and November, in response to highly anticipated monetary and fiscal policy announcements, our China leading indicators have stabilized, showing improvements across manufacturing surveys, housing and construction indicators, industrial production and monetary policy conditions. As indicated in our recent commentaries, we continue to monitor developments in China and Asia more broadly, looking for early signs of a cyclical rebound in earnings expectations relative to developed markets, which are yet to materialize.

Sources: Bloomberg L.P., Macrobond. Invesco Solutions research and calculations. Proprietary leading economic indicators of Invesco Solutions. Macro regime data as of Nov. 30, 2024. The Leading Economic Indicators (LEIs) are proprietary, forward-looking measures of the level of economic growth. The Global Risk Appetite Cycle Indicator (GRACI) is a proprietary measure of the markets’ risk sentiment. Developed markets ex-USA include the eurozone, UK, Japan, Switzerland, Canada, Sweden, Australia. Emerging markets include Brazil, Mexico, Russia, South Africa, Taiwan, China, South Korea, India.

Source: Invesco Solutions as of Nov. 30, 2024.

Sources: Bloomberg L.P., Macrobond. Invesco Solutions research and calculations. Proprietary leading economic indicators of Invesco Solutions. Macro regime data as of Nov. 30, 2024. The Leading Economic Indicators (LEIs) are proprietary, forward-looking measures of the level of economic growth. The Global Risk Appetite Cycle Indicator (GRACI) is a proprietary measure of the markets’ risk sentiment.

Sources: Bloomberg L.P., MSCI, FTSE, Barclays, JPMorgan, Invesco Solutions research and calculations, from Jan. 1, 1992 to Nov. 30, 2024. The Global Leading Economic Indicator (LEI) is a proprietary, forward-looking measure of the growth level in the economy. A reading above (below) 100 on the Global LEI signals growth above (below) a long-term average. The Global Risk Appetite Cycle Indicator (GRACI) is a proprietary measure of the markets’ risk sentiment. A reading above (below) zero signals a positive (negative) compensation for risk-taking in global capital markets in the recent past. Past performance does not guarantee future results.
Reflecting on markets post US election: Lessons from 2016-2017
The outcome of the US election has been the dominant driver of financial markets over the past month, with two main themes being priced across asset classes, namely a positive US growth shock with expectations of expansionary fiscal policies and a negative growth shock for the rest of the world with expectations for higher tariffs and global trade policy uncertainty. During the campaign, President Elect Trump suggested tariffs up to 60% on imports from China, and 10-20% on goods coming from elsewhere. As recently as last week, the incoming administration threatened 25% tariffs on imports from Mexico and Canada to be announced as early as the first day in office. Global equity and currency markets swiftly priced in the negative headlines.1 While the outcome of the US election may seemingly represent a sudden change to the market cycle, with clear implications for asset prices over the coming quarters due to the medium-term nature of economic policies, we are skeptical of this interpretation and look at the experience from 2016 to draw valuable lessons. Following the Trump election in 2016, the same two policies emerged as primary drivers of markets in the immediate aftermath of the vote (US fiscal expansion and import tariffs). In fact, in the first month following the results, the relative performance across major asset classes back then was nearly identical to the performance we have experienced today, with US small caps outperforming US large caps, US equities outperforming non-US equities and emerging markets being the laggard (Figure 3a). However, over the course of 2017, markets experienced a nearly perfect reversal in this relative performance, with US small caps underperforming US large caps, US equities underperforming developed ex-US and emerging market equities, with the latter being the best-performing asset class. Similarly, US Treasuries also stabilized after the initial sell-off, posting small positive returns in 2017 despite fears of larger deficits and higher tariffs (Figure 3b). What happened? Did those policies fail to materialize? No. Fiscal expansion and global trade uncertainty were very prominent features of the following years, but so were several new developments. In particular, the global economy experienced what became the strongest “global synchronized recovery” since 2010, led by China, Europe, and a global inventory cycle restocking.2
To be clear, we have no preconceived expectation that markets in 2025 will follow the same patterns we observed in 2017. Instead, we highlight how this historical analogy provides a valuable reminder that markets promptly absorb new information, and even multi-year economic policies can be priced in —in a few weeks. Markets eventually return to focusing on incoming information and traditional drivers of performance such as monetary policy, the growth cycle, and inflation. Hence, we reiterate the importance of adhering to a disciplined investment process, processing incoming economic and financial data to drive asset allocation decisions, and refraining from extrapolating highly uncertain short-term developments into long-term trends.
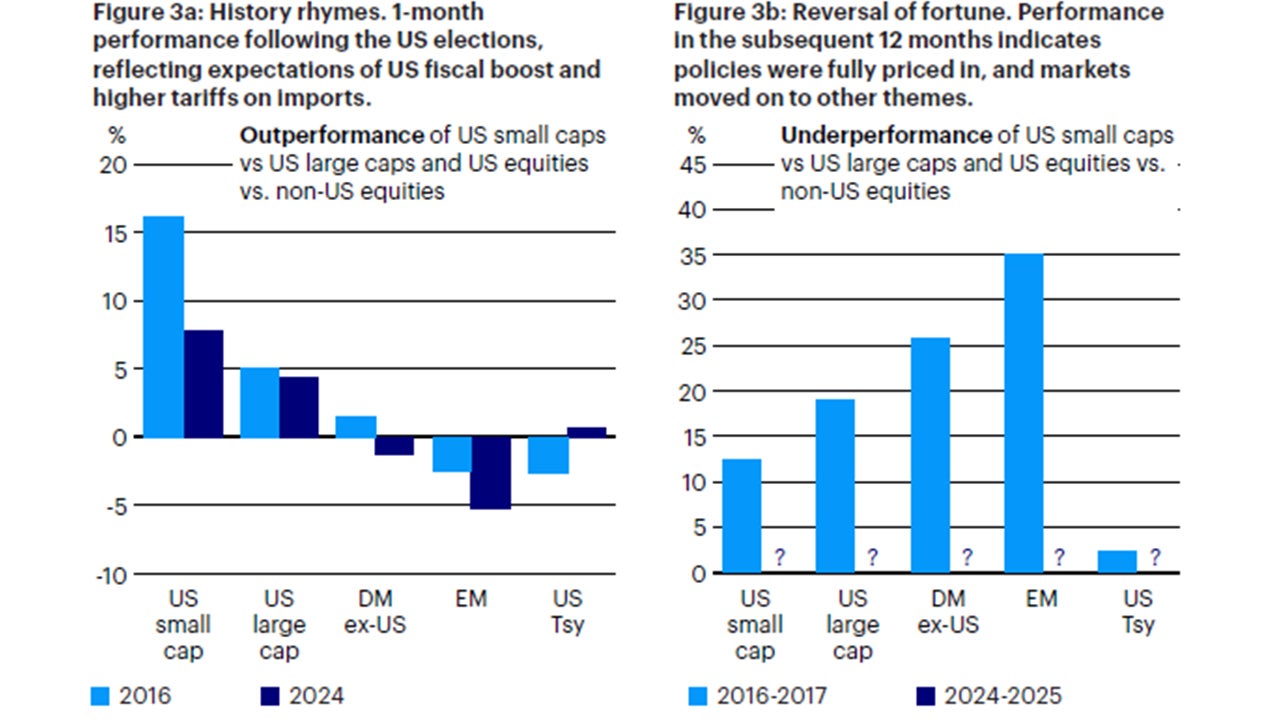
Sources: Bloomberg L.P.,Invesco. 1-month performance following the US elections covering the periods between 11/8/2016 - 12/8/2016, and 11/5/2024 - 12/1/2024. Performance in the subsequent 12-months covering the period 12/8/2016 to 12/31/2017. Total returns of US small cap, US large cap, DM ex-US, EM, and US Tsy, are the returns of the Russell 2000 Index, S&P 500 Index, MSCI EAFE Index, MSCI Emerging Markets Index, and Bloomberg US Treasury Index, respectively.
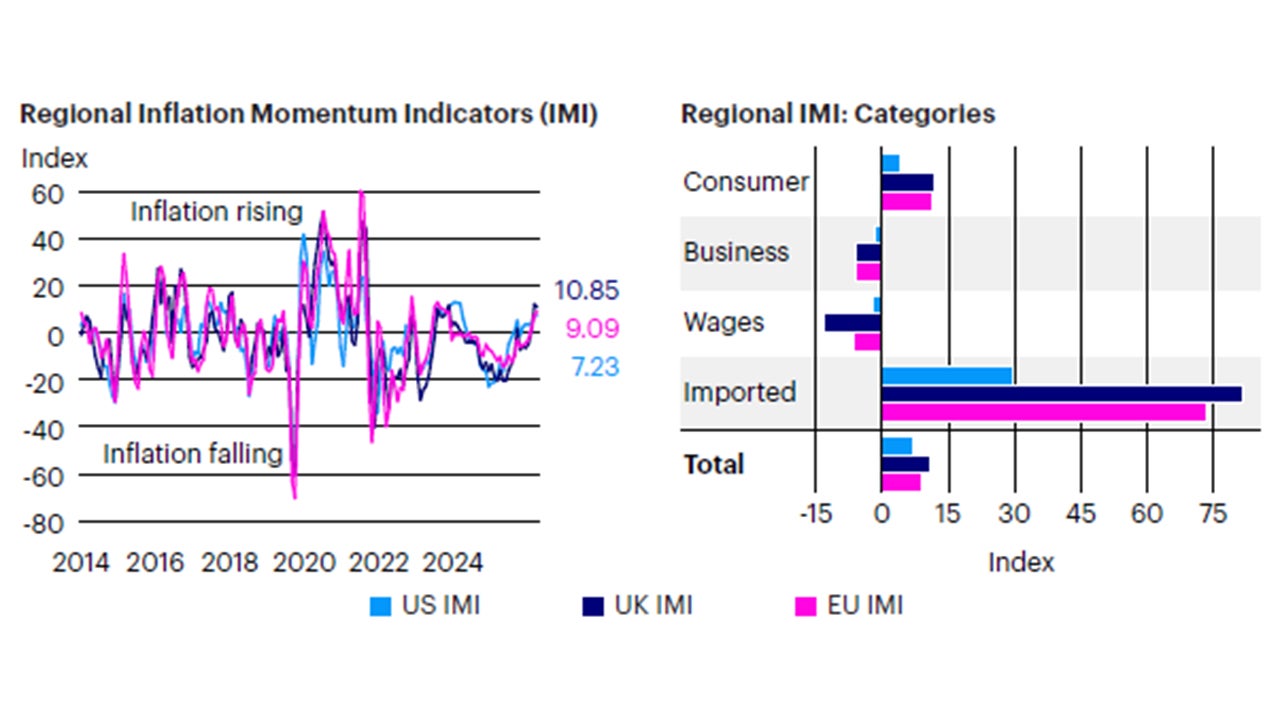
Sources: Bloomberg L.P. data as of Nov. 30, 2024, Invesco Solutions calculations. The US Inflation Momentum Indicator (IMI) measures the change in inflation statistics on a trailing three-month basis, covering indicators across consumer and producer prices, inflation expectation surveys, import prices, wages, and energy prices. A positive (negative) reading indicates inflation has been rising (falling) on average over the past three months.
Investment positioning
There are no changes in portfolio positioning this month. We underweight risk relative to benchmark in the Global Tactical Allocation Model,3 underweighting equities relative to fixed income, favoring US equities and defensive sectors with quality and low volatility characteristics. In fixed income, we underweight credit risk4 relative to benchmark and overweight duration via investment grade credit and sovereign fixed income at the expense of lower quality credit sectors. (Figures 4 to 7). In particular:
• In equities, we overweight defensive sectors with quality and low volatility characteristics, tilting towards larger capitalizations at the expense of value, mid and small caps. Despite the extended positioning in mega-cap quality names, we expect a combination of quality and low volatility characteristics to outperform and provide downside risk mitigation in a scenario of falling growth expectations, falling bond yields, and weaker equity markets. Hence, we favor exposures to defensive sectors such as health care, staples, utilities, and technology at the expense of cyclical sectors such as financials, industrials, materials, and energy. From a regional perspective, we maintain an overweight position in US equities relative to other developed markets and emerging markets, driven by declining global risk appetite, stronger US earnings revisions vs. the rest of the world, and a still favorable outlook for the US dollar.
• In fixed income, we underweight credit risk and overweight duration, favoring investment grade and sovereign fixed income relative to high yield. Credit spreads tightened further over the past month, clearly signaling resilience in credit markets. While the current backdrop does not suggest a major risk for credit spreads, downward revisions to growth expectations are likely to be accompanied by marginally wider spreads from cycle lows and lower bond yields, favoring higher quality and higher duration assets. In sovereigns, we maintain a modest overweight in inflation-protected securities vs. nominal bonds (Figure 4).
• In currency markets, we maintain a moderate overweight in the US dollar, as yield differentials with major foreign currencies are narrowing. However, overall higher yields and negative surprises in global growth still inform our position in favor of the greenback. Within developed markets, we favor the euro, the British pound, the Norwegian kroner, the Swedish krona, and the Singapore dollar relative to the Swiss franc, Japanese yen, Australian and Canadian dollars. In EM, we favor high yielders with attractive valuations, such as the Colombian peso, Brazilian real, Indian rupee, Indonesian rupiah, and Mexican peso, relative to low yielding and more expensive currencies, such as the Korean won, Taiwan dollar, Philippines peso, and Chinese renminbi.
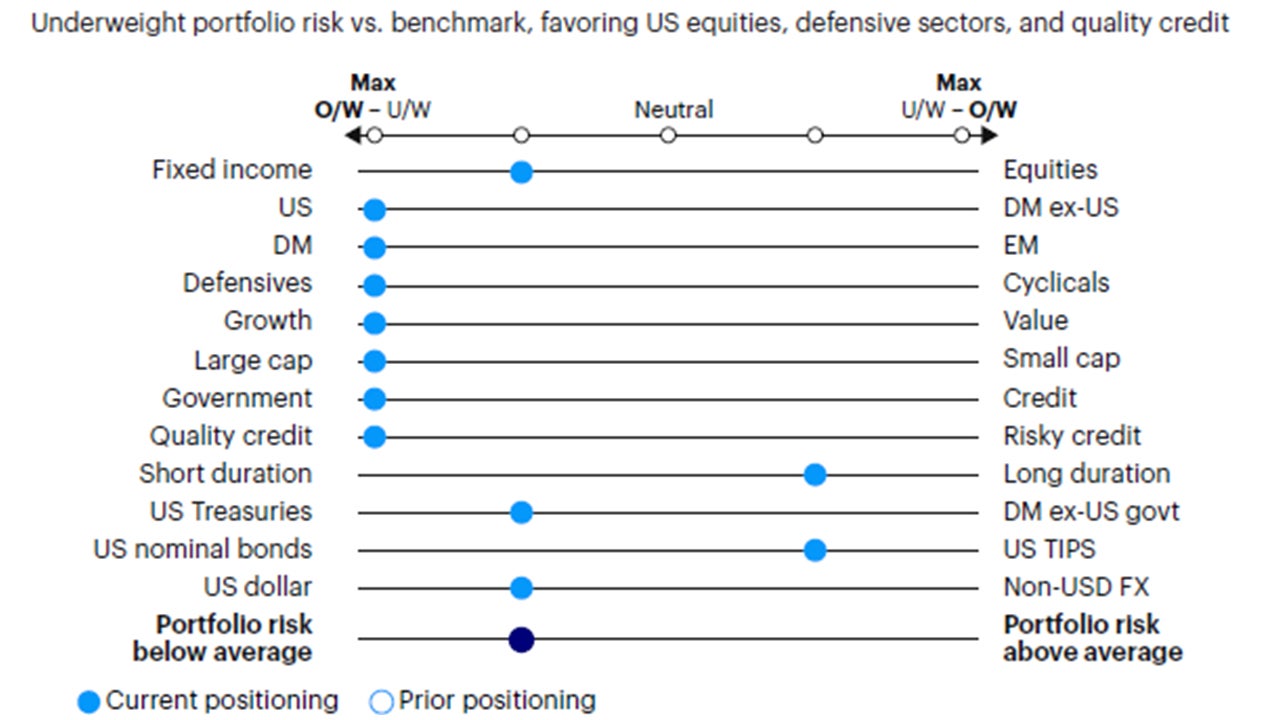
Source: Invesco Solutions, Dec. 1, 2024. DM = developed markets. EM = emerging markets. Non-USD FX refers to foreign exchange exposure as represented by the currency composition of the MSCI ACWI Index. For illustrative purposes only.
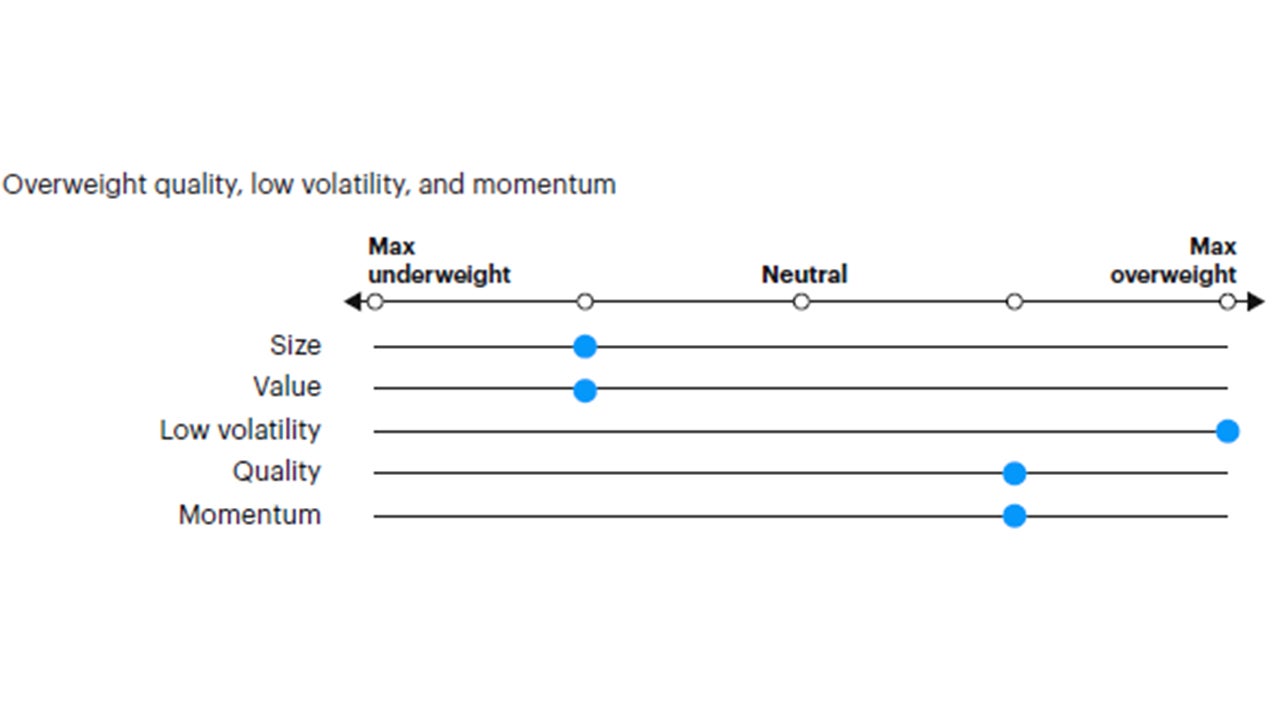
Source: Invesco Solutions, Dec. 1, 2024. For illustrative purposes only. Neutral refers to an equally weighted factor portfolio.
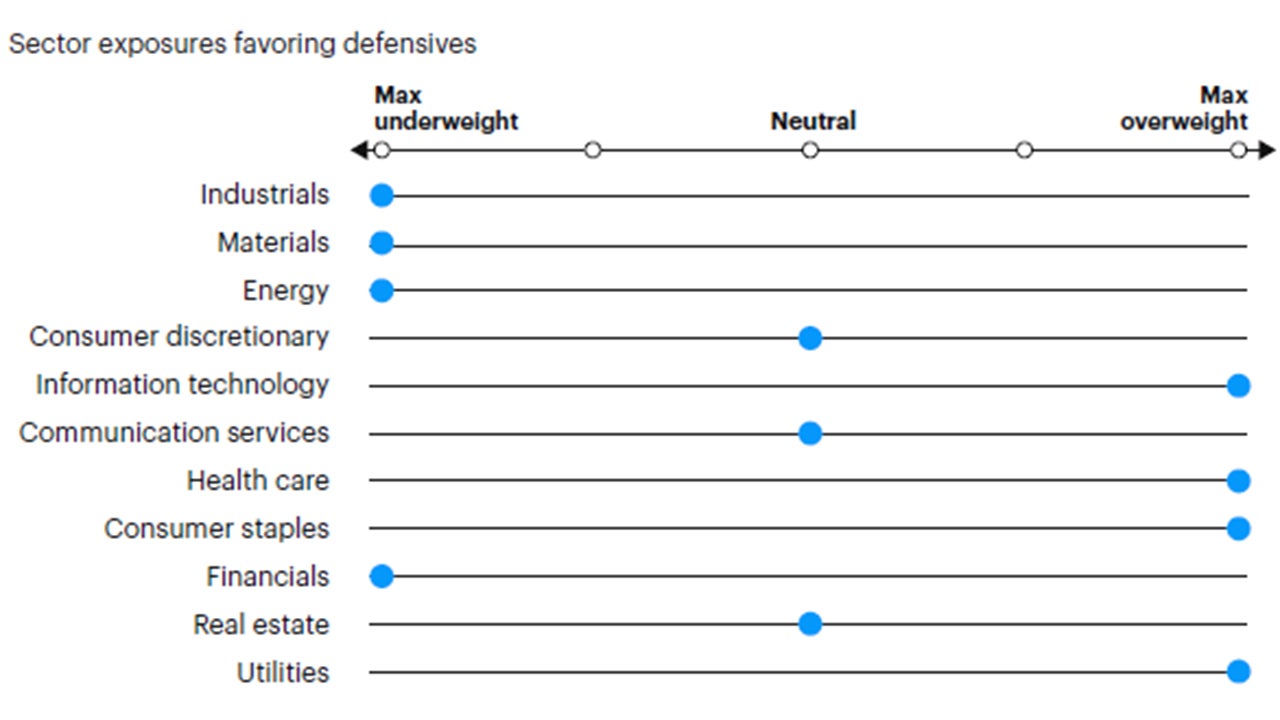
Source: Invesco Solutions, Dec. 1, 2024. For illustrative purposes only. Sector allocations derived from factor and style allocations based on proprietary sector classification methodology. As of December 2023, Cyclicals: energy, financials, industrials, materials; Defensives: consumer staples, health care, information technology, real estate, utilities; Neutral: consumer discretionary and communication services.
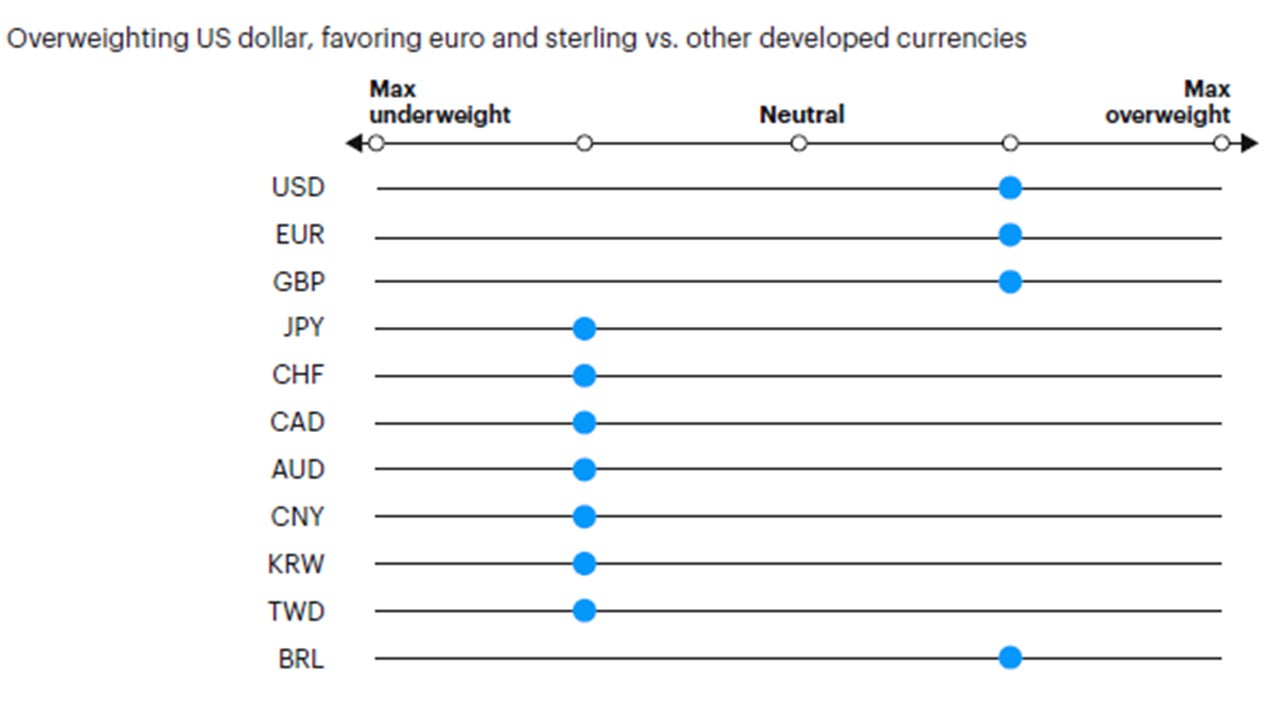
Source: Invesco Solutions, Dec. 1, 2024. For illustrative purposes only. Currency allocation process considers four drivers of foreign exchange markets: 1) US monetary policy relative to the rest of the world, 2) global growth relative to consensus expectations, 3) currency yields (i.e., carry), 4) currency long-term valuations.
Investment risks
The value of investments and any income will fluctuate (this may partly be the result of exchange rate fluctuations), and investors may not get back the full amount invested.
When investing in less developed countries, you should be prepared to accept significantly large fluctuations in value. Investment in certain securities listed in China can involve significant regulatory constraints that may affect liquidity and/or investment performance.
Footnotes
-
1
“A roadmap through the drama and realities of Trump’s trade war," Bloomberg, December 1, 2024.
-
2
See, for example: “Global growth hasn’t looked this synchronized since 2010,", Bloomberg, March 2017; “The global economy enjoys a synchronized upswing," The Economist, March 2017; “IMF hails broadest upsurge in global growth since 2010," The Financial Times, January 2018.
-
3
Reference benchmark 60% MSCI ACWI, 40% Bloomberg Global Aggregate Hedged Index.
-
4
Credit risk defined as duration times spread (DTS).


