Tactical Asset Allocation - December 2023

Synopsis
We remain positioned for a recovery in the global cycle. Falling inflation is fueling positive market sentiment, expectations for rate cuts, and improving growth.
We remain overweight portfolio risk in the Global Tactical Asset Allocation model1, favoring equities relative to fixed income, emerging markets, value, and smaller capitalizations. We tilt toward non-US developed equities, anticipating a bottom in European growth. Overweight risky credit, neutral duration, and underweight the US dollar.
Prospects of falling inflation are boosting global market sentiment. Overweight risk assets while tilting toward non-US equities on early signs of a cyclical bottom in European growth.
Our macro process drives tactical asset allocation decisions over a time horizon between six months and three years, on average, seeking to harvest relative value and return opportunities between asset classes (e.g., equity, credit, government bonds, and alternatives), regions, factors, and risk premia.
Macro update
Global growth momentum continues to soften on the margin but remains broadly stable. However, our leading indicators are now flagging the potential for cyclical divergence in favor of Europe and emerging markets relative to the United States, a development we have not seen since Q1 and unlikely to be discounted by market consensus. Following last month, leading indicators for the United States reported additional weakness in consumer sentiment surveys, manufacturing business surveys, and industrial orders, while housing indicators remained stable. On the other hand, after several quarters of meaningful underperformance, leading indicators of European growth, such as manufacturing production expectations, orders, and inventories, point toward a near-term stabilization or cyclical bottom in the cycle, flagging the potential for cyclical divergence between the regions. Similarly, incoming data from China and the rest of Asia confirmed a similar stabilization and the prospect for positive cyclical momentum in the next few months, with improvements in business surveys and industrial production. Property markets remain weak but somewhat stable. After three consecutive months of negative returns, global equity markets posted an impressive rebound in November, outperforming fixed income, while credit spreads also experienced meaningful tightening across corporate high yield, investment grade and emerging markets debt. Downside inflation surprises have fueled optimism toward a soft landing, expectations for rate cuts in 2024, and contributed to a weakening in the US dollar. Overall, our framework suggests the world economy remains in a recovery regime, characterized by below-trend growth and improving growth expectations, as proxied by our gauge of global risk appetite remaining on a rising trend (Figure 1, Figure 2). Interestingly, this barometer of market sentiment has now reached levels that have coincided with prior cyclical peaks in the post-GFC period, suggesting that incoming data are likely to be a very important driver of market performance.

Sources: Bloomberg L.P., Macrobond. Invesco Solutions research and calculations. Proprietary leading economic indicators of Invesco Solutions. Macro regime data as of November 30, 2023. The Leading Economic Indicators (LEIs) are proprietary, forward-looking measures of the level of economic growth. The Global Risk Appetite Cycle Indicator (GRACI) is a proprietary measure of the markets’ risk sentiment. Developed markets ex-USA include the Eurozone, UK, Japan, Switzerland, Canada, Sweden, Australia. Emerging markets include Brazil, Mexico, Russia, South Africa, Taiwan, China, South Korea, India.

Source: Invesco Solutions as of November 30, 2023.

Sources: Bloomberg L.P., Macrobond. Invesco Solutions research and calculations. Proprietary leading economic indicators of Invesco Solutions. Macro regime data as of November 30, 2023. The Leading Economic Indicators (LEIs) are proprietary, forward-looking measures of the level of economic growth. The Global Risk Appetite Cycle Indicator (GRACI) is a proprietary measure of the markets’ risk sentiment.

Sources: Bloomberg L.P., MSCI, FTSE, Barclays, JPMorgan, Invesco Solutions research and calculations, from Jan. 1, 1992 to November 30, 2023. The Global Leading Economic Indicator (LEI) is a proprietary, forward-looking measure of the growth level in the economy. A reading above (below) 100 on the Global LEI signals growth above (below) a long-term average. The Global Risk Appetite Cycle Indicator (GRACI) is a proprietary measure of the markets’ risk sentiment. A reading above (below) zero signals a positive (negative) compensation for risk-taking in global capital markets in the recent past. Past performance does not guarantee future results.
Inflation
As argued over the past few months, we believe decelerating inflation, coupled with stable growth and stable employment, remains the primary catalyst for outperformance in risky assets. Developments over the past month seem to provide a strong confirmation for this Goldilocks scenario. Downside inflation surprises across the US, Europe, and emerging markets have coincided with favorable reactions in equity markets and pricing for substantial rate cuts in 2024. The 16% decline in global energy prices over the past two months, if not reversed, should put further downward pressure on headline and core CPI statistics over the next few months and quarters, allowing inflation to return to levels consistent with monetary policy targets (Figure 3). In addition, oil markets have seen a meaningful re-steepening of futures curves, with 12-month forward Brent futures moving from a $12 discount to a $3 discount relative to spot prices, indicative of a more balanced demand/supply and potentially muted price pressures. Indeed, our inflation momentum indicators signal a noticeable decline in imported inflation (driven mainly by energy and food prices), which have historically led to turning points in other, less volatile categories such as consumer and business price inflation (Figure 4).
Overall, the evolution of growth, employment and inflation continues to support our positioning for a favorable backdrop in risk assets in the near term.
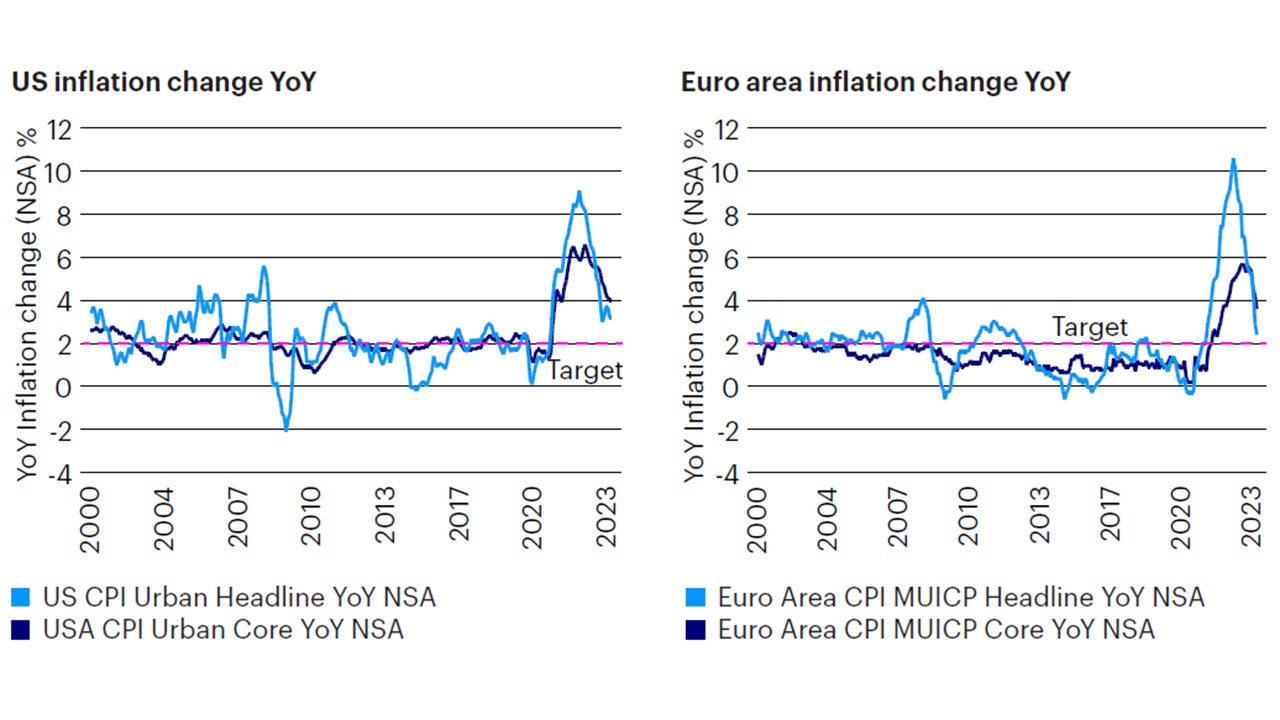
Sources: Bloomberg L.P. data as of November 30, 2023, Invesco Solutions calculations.
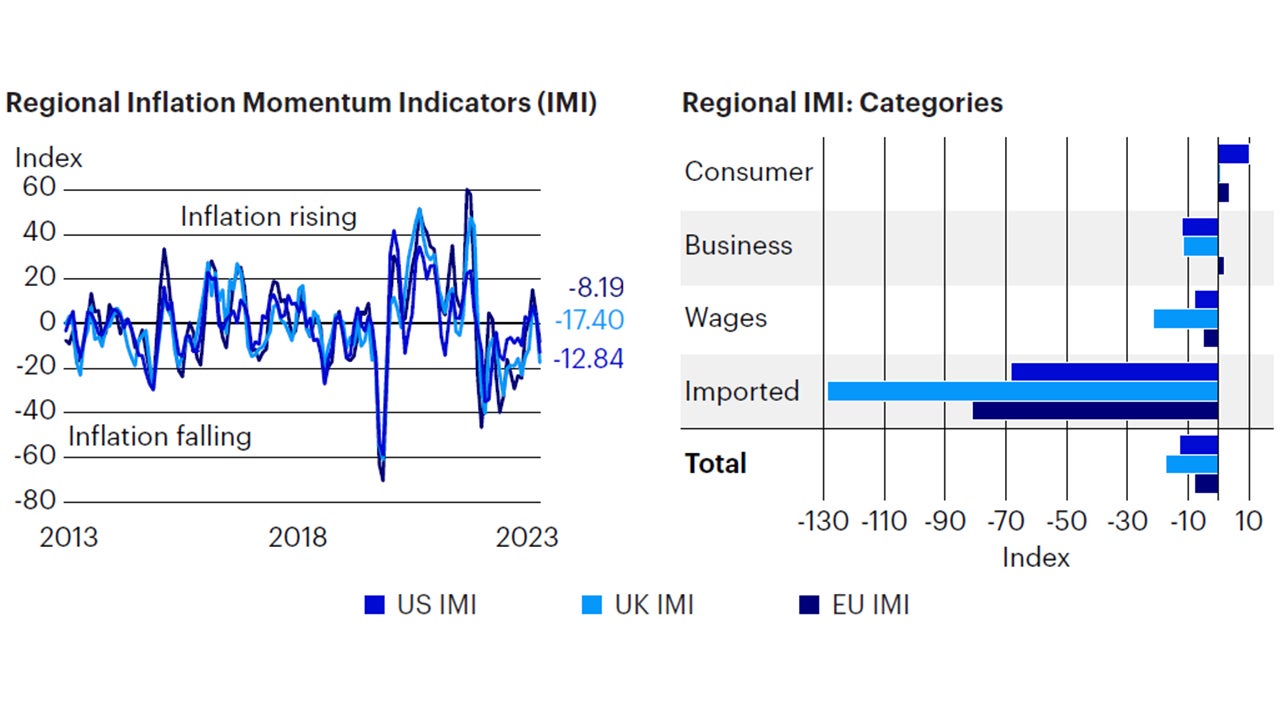
Sources: Bloomberg L.P. data as of November 30, 2023, Invesco Solutions calculations. The US Inflation Momentum Indicator (IMI) measures the change in inflation statistics on a trailing three-month basis, covering indicators across consumer and producer prices, inflation expectation surveys, import prices, wages, and energy prices. A positive (negative) reading indicates inflation has been rising (falling) on average over the past three months.
Investment positioning
We implemented a few changes to portfolio positioning this month. We remain overweight risk relative to the benchmark in the Global Tactical Allocation Model, overweight equities over fixed income, favoring emerging markets, cyclical sectors, value, and smaller capitalizations with favorable momentum. We moved to an overweight position in Developed ex-USA equities, funded from US equities. In fixed income, we remain overweight credit risk via lower quality sectors, maintaining a neutral duration posture and closing the exposure in inflation-linked bonds. We remain underweight in the US dollar (Figures 5 to 8). In particular:
• Within equities, we overweight cyclical factors with high operating leverage and a higher sensitivity to a rebound in growth expectations, such as value and smaller capitalizations, while we underweight defensive factors, such as low volatility, quality, and larger capitalizations. Similarly, we favor exposures to cyclical sectors such as financials, industrials, materials, and energy at the expense of health care, staples, utilities, and technology. From a regional perspective, we remain overweight emerging markets, supported by improving risk appetite and expectations for US dollar depreciation, and move to an overweight exposure in developed ex-US equities, driven by prospects for cyclical divergence in leading economic indicators between the US and other developed markets.
• In fixed income, we remain overweight in risky credit2 via high yield, bank loans and emerging markets hard currency debt. While credit spreads have tightened meaningfully over the past month, we expect volatility to remain subdued and credit markets to offer stable yields in a favorable macro backdrop. The case for credit assets remains limited to their income advantage over government bonds rather than capital appreciation. In sovereigns, we move to an underweight exposure in inflation-linked bonds in favor of nominal bonds across developed markets, driven by negative inflation momentum (Figure 4).
• In currency markets, we underweight the US dollar, as regimes of cyclical recoveries are typically accompanied by strong reflationary flows into non-US assets. However, yield differentials continue to widen in favor of the US dollar, providing headwinds to this bearish position on the greenback. Within developed markets, we favor the euro, the British pound, the Norwegian kroner, the Swedish krona, and the Singapore dollar relative to the Swiss Franc, Japanese yen, and Australian and Canadian dollars. In EM, we favor high yielders with attractive valuations as the Colombian peso, the Polish zloty, and the South African rand, relative to low yielding and more expensive currencies, such as the Korean won, the Mexican peso, the Thai baht, and the Chinese renminbi, but still expect these currencies to do well in a US dollar depreciation scenario.
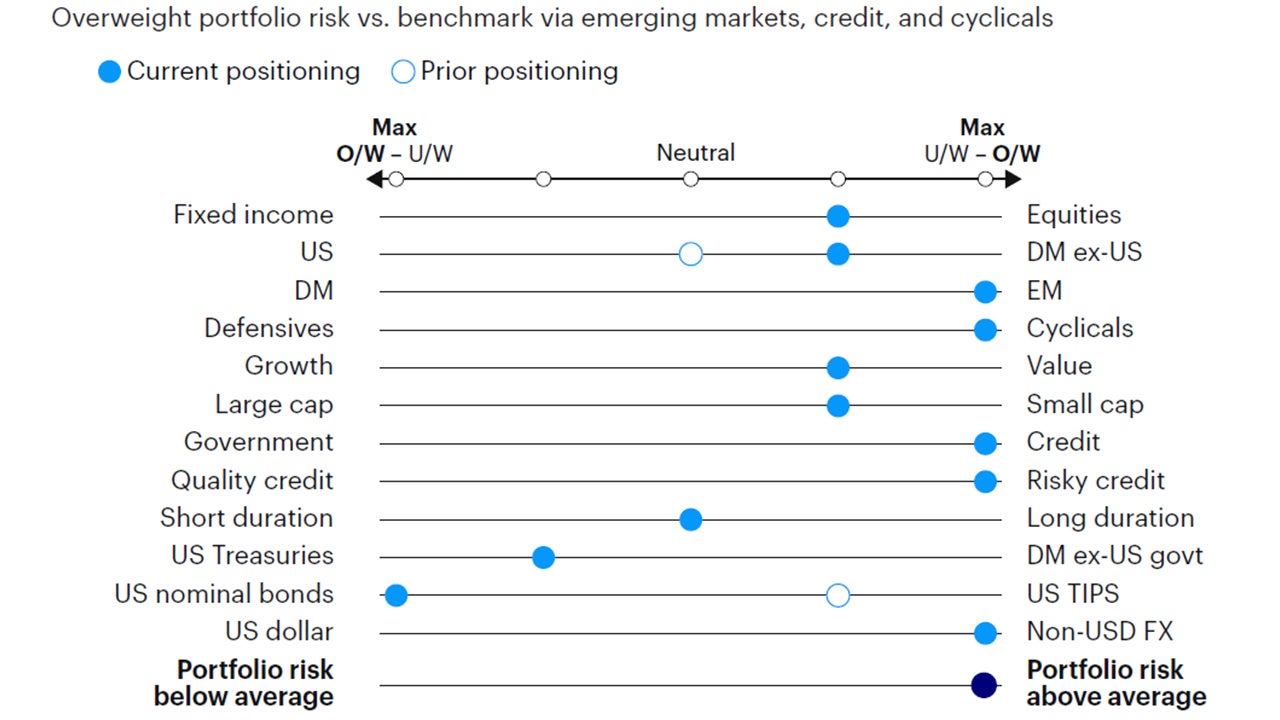
Source: Invesco Solutions, November 30, 2023. DM = developed markets. EM = emerging markets. Non-USD FX refers to foreign exchange exposure as represented by the currency composition of the MSCI ACWI Index. For illustrative purposes only.
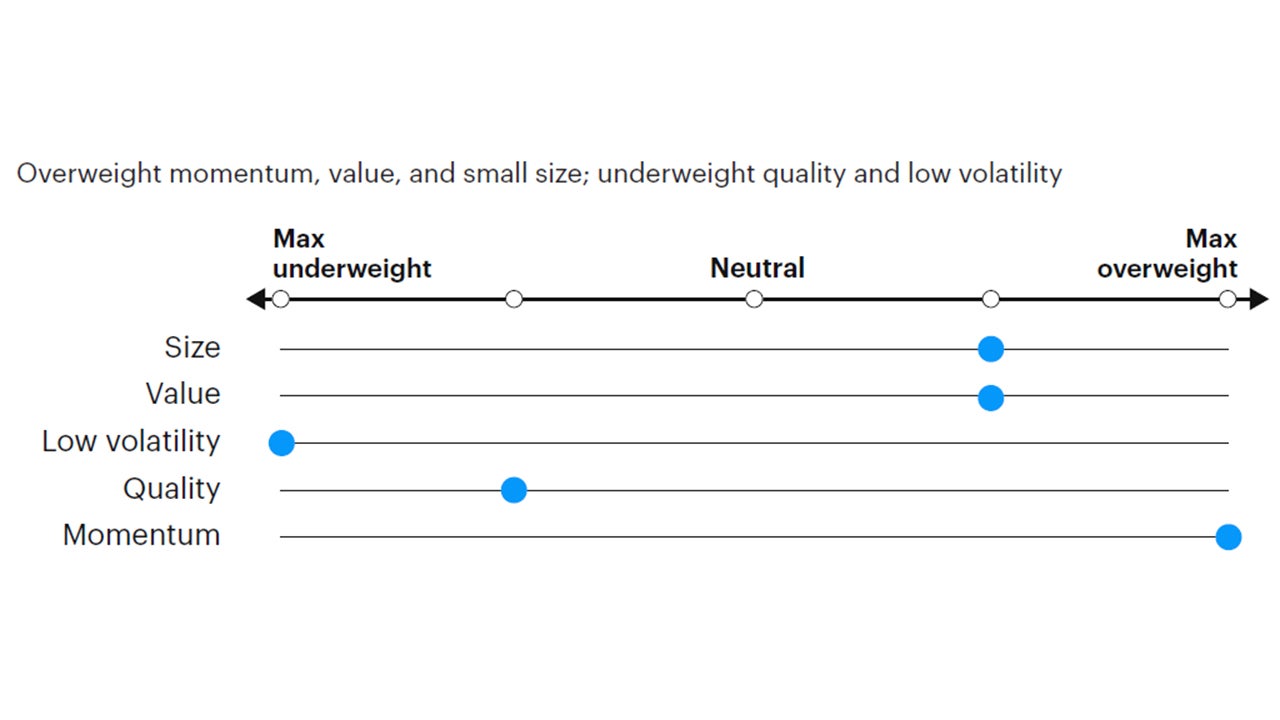
Source: Invesco Solutions, November 1, 2023. For illustrative purposes only. Neutral refers to an equally weighted factor portfolio.
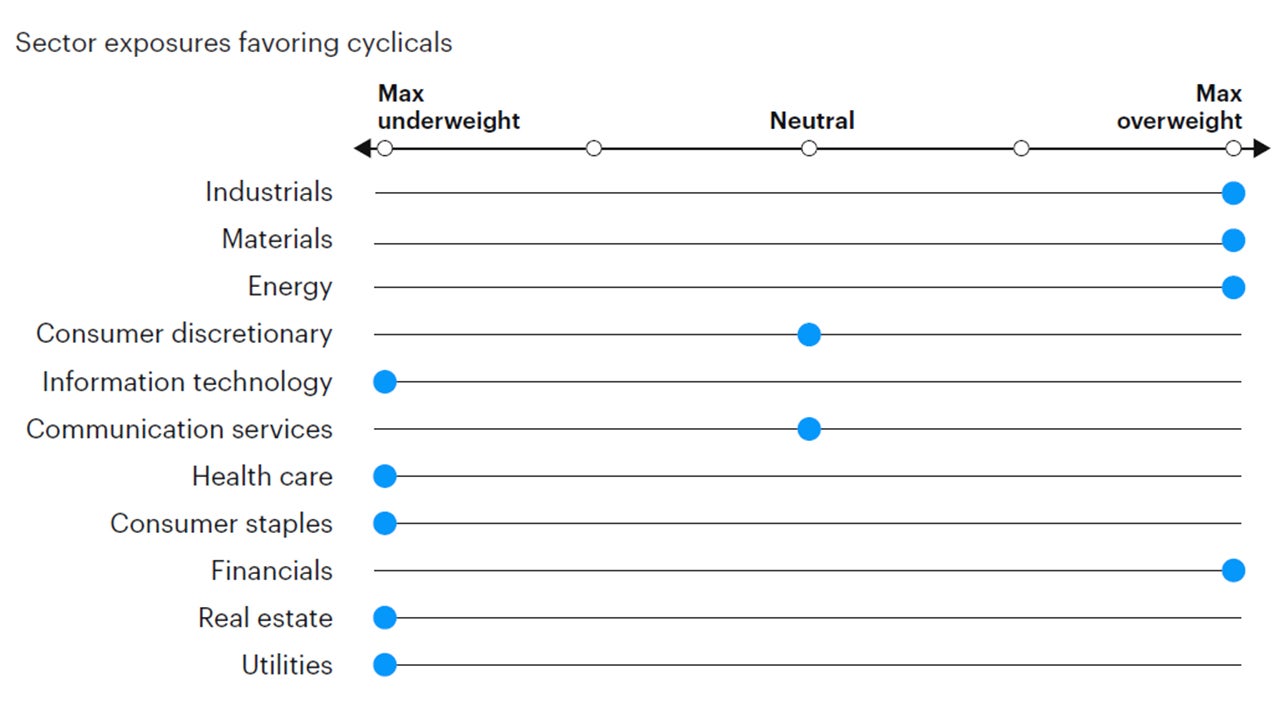
Source: Invesco Solutions, November 1, 2023. For illustrative purposes only. Sector allocations derived from factor and style allocations based on proprietary sector classification methodology. As of September 30, 2023, Cyclicals: energy, financials, industrials, materials; Defensives: consumer staples, health care, information technology, real estate, utilities; Neutral: consumer discretionary and communication services.
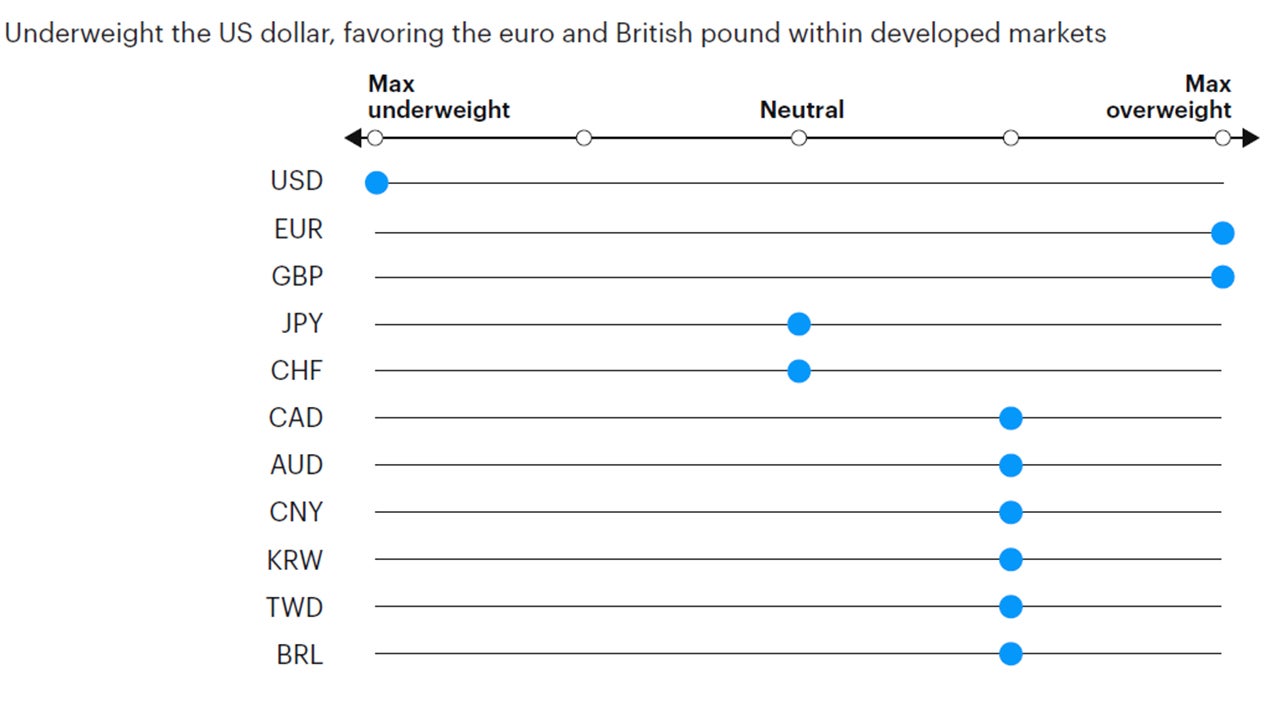
Source: Invesco Solutions, November 1, 2023. For illustrative purposes only. Currency allocation process considers four drivers of foreign exchange markets: 1) US monetary policy relative to the rest of the world, 2) global growth relative to consensus expectations, 3) currency yields (i.e., carry), 4) currency long-term valuations.
Footnotes
-
1
Global 60/40 benchmark (60% MSCI ACWI, 40% Bloomberg Global Aggregate USD Hedged).
-
2
Credit risk defined as duration times spread (DTS).


