Insurance Insights Q3 2023: Enhancing fixed income buy-and-maintain portfolios

In this case study we take a bottom-up approach to analyze exposure to fixed income buy-and-maintain portfolios at a security level and determine how to optimize this exposure (given that yields are generally at attractive levels relative to a year ago). The asset class that we assess is investment grade USD-denominated debt.
First, we take a big picture perspective of how an insurer might engage in bottom-up analysis to optimize their portfolio. The first step is to either gain exposure to a new asset class with a favorable risk-reward profile or look at existing asset class exposure and assess the efficiency and profile of this.
After an insurer has decided to invest in this asset class, additional choices that would typically need to be made are around implementation. One way is to just simply invest in a public fund, unit trust or ETF; another is to invest via a segregated or separate account through a mandate given to an investment manager. Typically, the latter approach is favored by insurers as it can allow for a high degree of customization and can then be managed as a primarily buy-and-maintain mandate (well suited for core exposures). Guidelines or constraints around average or minimum ratings, duration, etc. can also be controlled more effectively. This bottom-up analysis is illustrated below:

Source: Invesco, for illustrative purposes only.
For our case study on fixed income, the following flow chart illustrates the approach one could use to narrow down a desired fixed income universe and construct an appropriate portfolio:

Strategy-level analysis – using Vision – Initial screening
Now, let’s go through a more detailed example of how our portfolio modeling system can be used to narrow down a large universe of bonds to a smaller list from which an efficient portfolio can be constructed.
This is accomplished by using a series of screens, followed by defining constraints and objectives and considering how these can be optimized. An initial screen could be based on ratings and liquidity for example, or perhaps may exclude certain countries or regions (depending on an insurer’s internal guidelines and requirements). Once the universe has been narrowed down, we can then apply more granular constraints – across maturity, issuer limits, ratings to name a few – or even a combination of one or more of these.
As mentioned earlier, we have used an exposure to broad investment-grade USD-denominated debt as the asset class to assess. For purposes of this analysis, we have chosen the hypothetical investable universe to be the ICE BofAML Corporate Master Index and the Bloomberg Barclays Taxable Municipal Bond Index. This universe covers the high-grade US market quite effectively and forms a large base from which to select relevant holdings.
We have then applied a simple ratings-based screen – to reiterate the importance of including only investment grade securities in the screened universe:

In addition, we can also screen the universe based on liquidity (as part of this for example, we could choose to exclude bonds that were issued several years ago) as well as bond with characteristics such as optionality (callable bonds), subordination, hybrids, perpetuals, etc., all this with the aim of constructing a quality-tilted, stable portfolio:

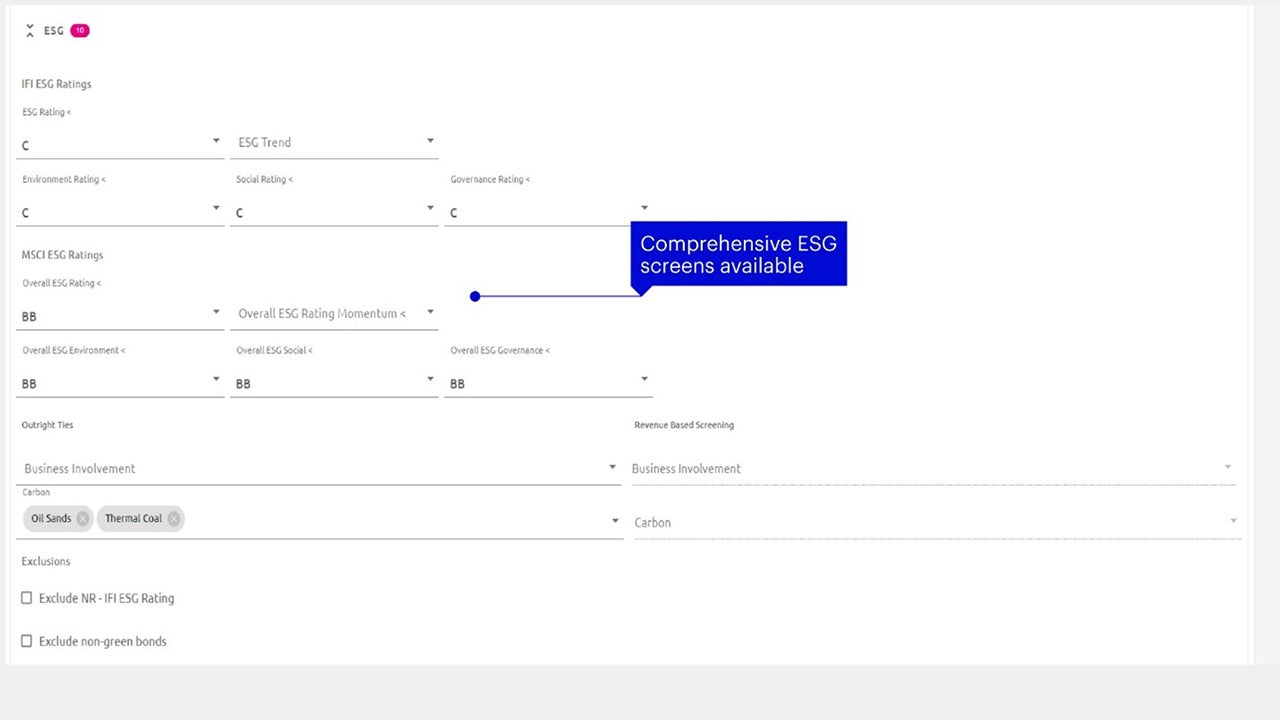
We can also screen the universe based on comprehensive ESG-related criteria (such as overall ratings, business involvement, direct carbon involvement, etc.), as shown below:
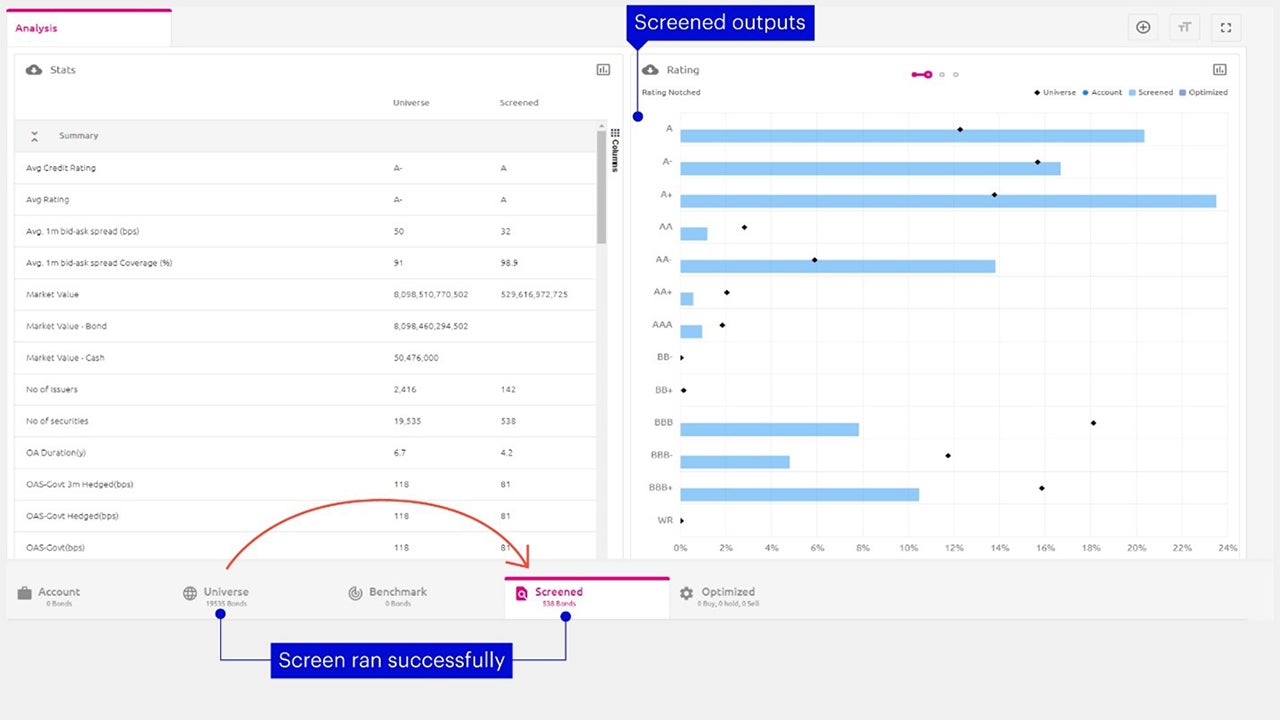
This initial screening then results in a narrower universe of bonds more closely matching the desired requirements:
Strategy-level analysis – using Vision – Constraints
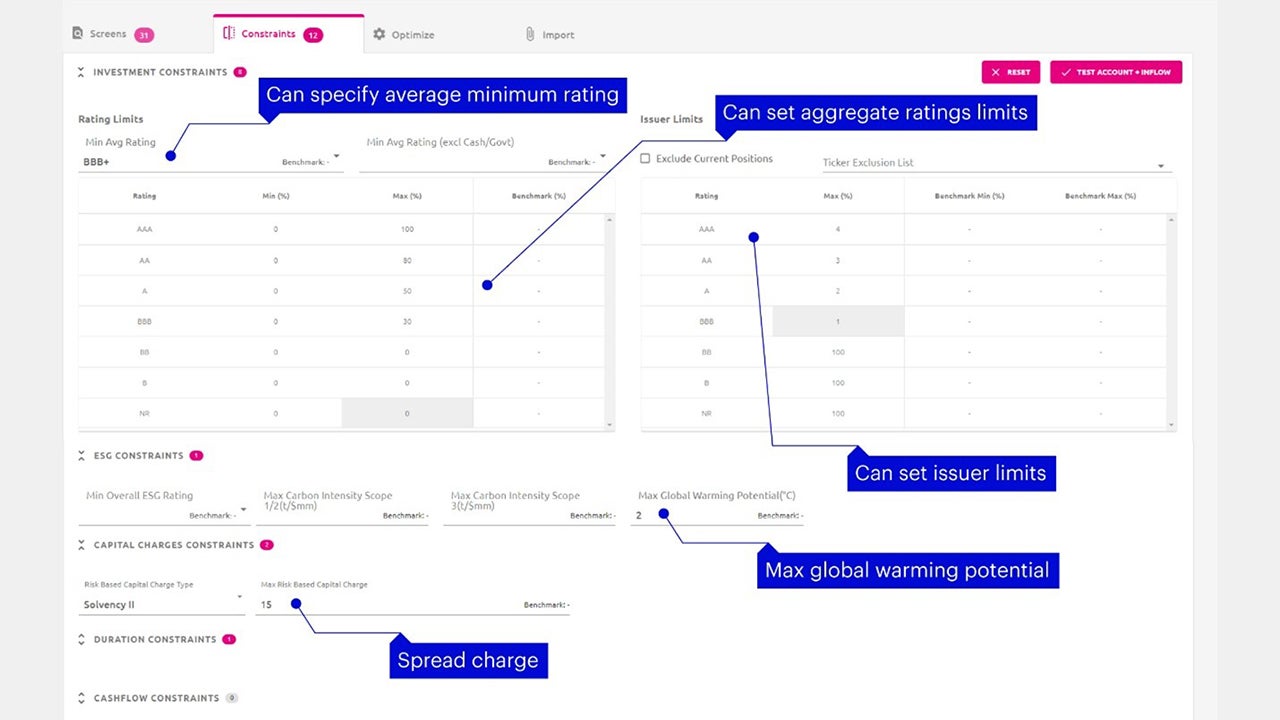
We are now able to move on to introducing constraints (i.e., active choices). As examples of this, we can set a desired minimum average rating (here set at BBB+) and introduce limits across single issuers (aggregate as well as individual), asset sub-types, sectors, etc.
There are several other sections such as:
- ESG - where we can set maximum carbon intensity levels (scope 1, 2 or 3) as well as a maximum global warming potential (here set at 2 degrees Celsius, for illustrative purposes only)
- Solvency II credit spread SCR – where we can specify a maximum level
- Duration constraints, including by duration buckets, for better liability matching ability (here set between 5 and 15, for illustrative purposes only)
- Specific cashflow requirements against a set of defined or best-estimate liabilities
There is also provision to incorporate custom constraints by specifying logical conditions and setting limits based on these.
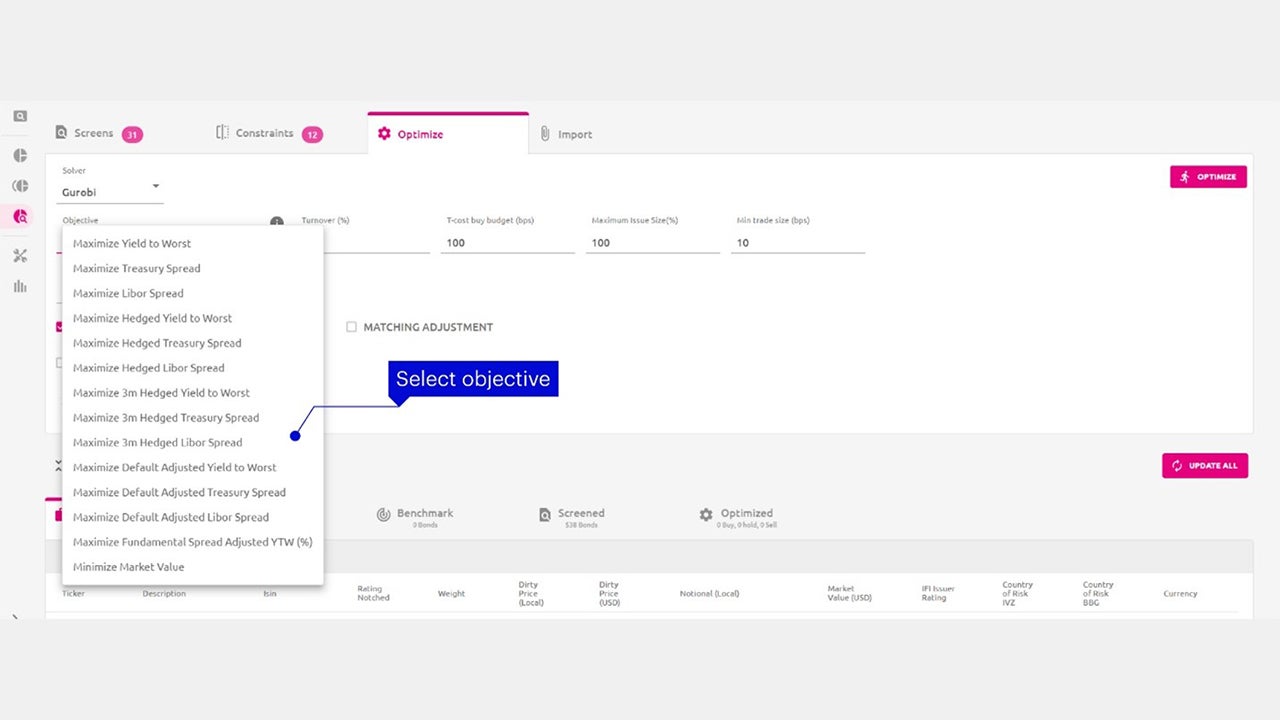
Once the desired constraints are parameterized, the final step is to run an optimization process – selecting a portfolio metric that we wish to optimize.
In the example here, we select the objective of maximizing the yield to worst:
With this, we are now ready to run the optimization and assess the results.
Analysis of results
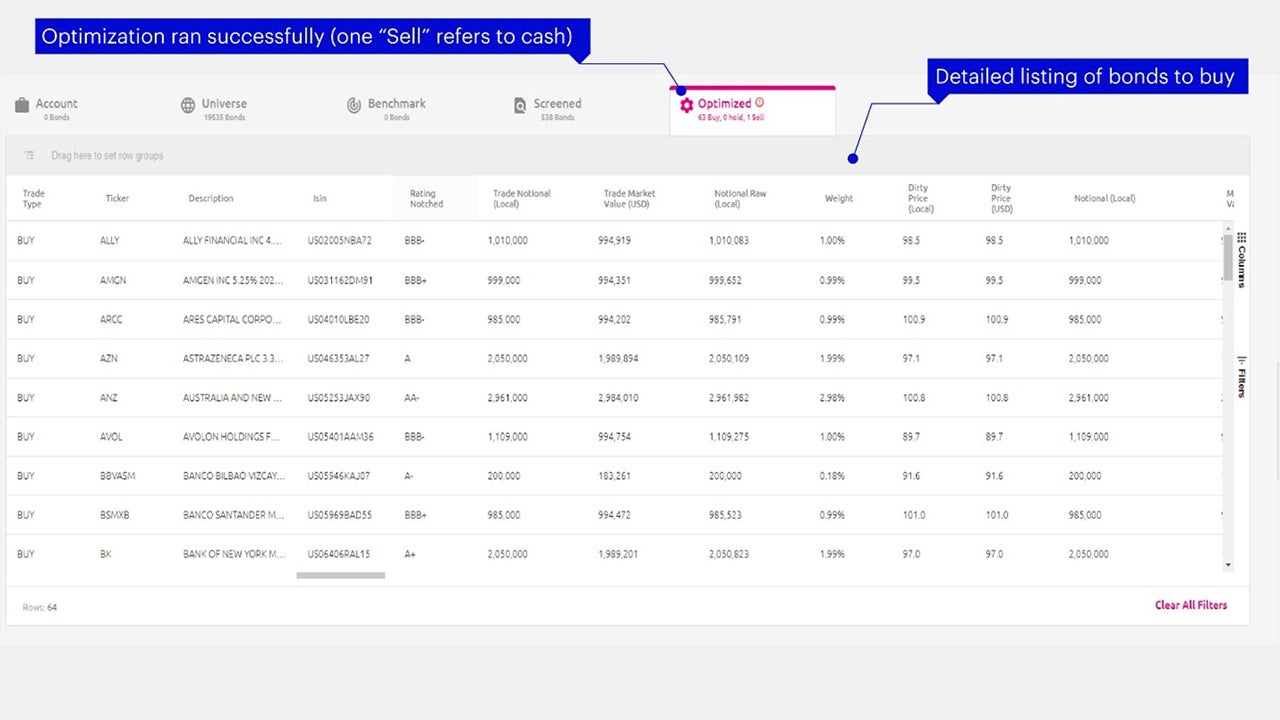
The following shows the optimized result of the screens and constraints. A detailed listing of the suggested bonds to select can be seen here – and can be used as the basis for constructing an appropriate portfolio:
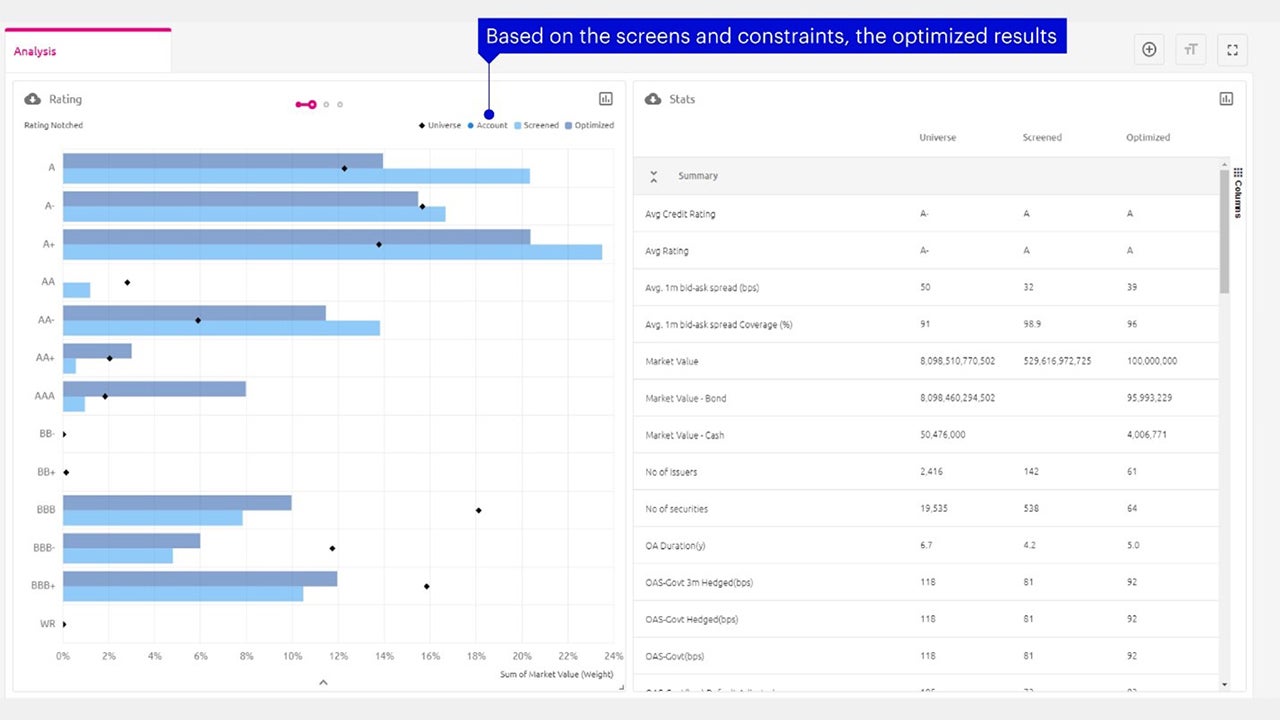
We can also compare and assess the broad characteristics of the potential portfolio relative to the starting universe:
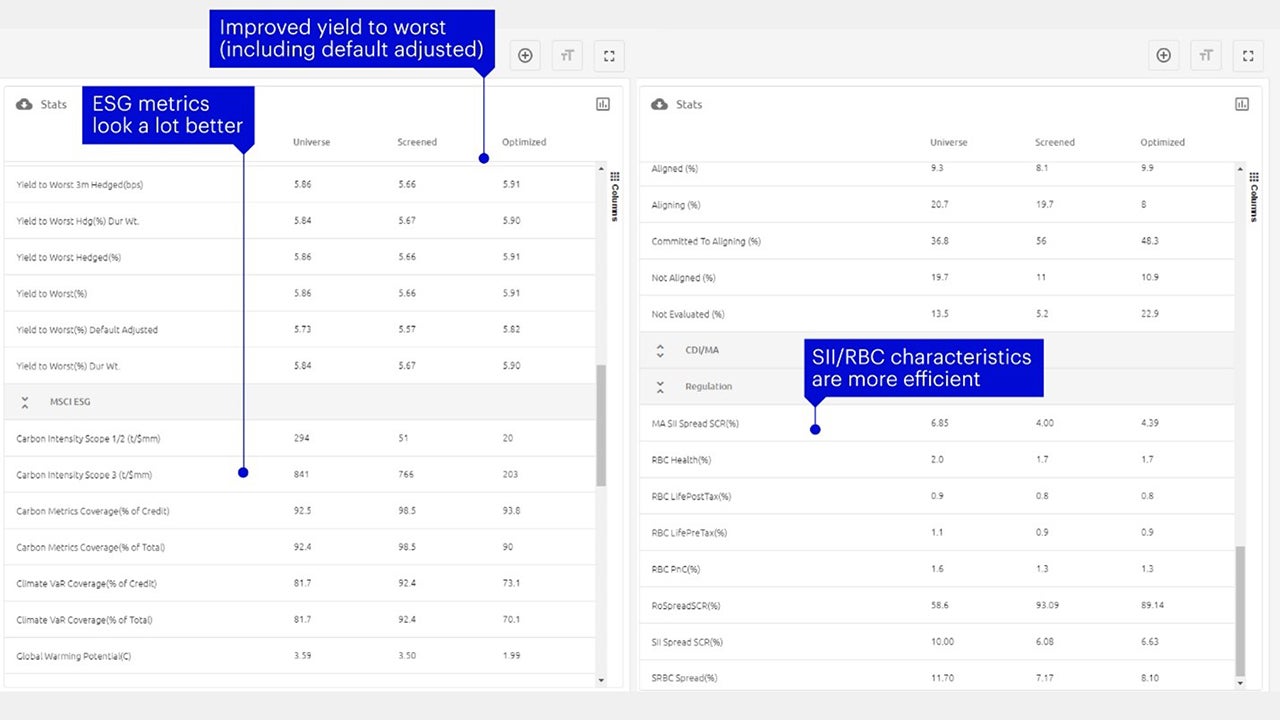
Detailed statistics allow for a deeper comparison across the various metrics of interest (rating, duration, yield, spread charge, ESG scores, etc.) to assess improvements/enhancements.
Through an iterative process, the portfolio can be modified (by changing screening/constraints criteria) to fine-tune any of the desired characteristics.
Matching adjustment consideration can also be incorporated while constructing and optimizing such portfolios. A set of liability cashflows can be used as part of the security selection process with constraints around asset-liability gaps.
Summary
The process detailed above demonstrates the utility of analyzing a portfolio on a security-by-security basis to optimize certain parameters. This is a fairly effective way to narrow down a universe of thousands of bonds to a subset that is more manageable and lends itself to a deeper analysis and can form the basis of portfolio construction – it is a means to an end, not the end in itself.
This approach can be applied when constructing a portfolio based on a new asset class, or indeed, even while assessing how best to deploy new funds into an existing asset class. On a semi-annual or annual basis, the process can be used to assess how the portfolio metrics are trending. If any significant deviations are being observed, necessary actions can then be taken to bring the portfolio back to the desired characteristics.
Key takeaways
We intend the series of Insights to be taken as a whole – and to demonstrate the benefit of a stepwise, disciplined approach to constructing appropriate insurance portfolios:
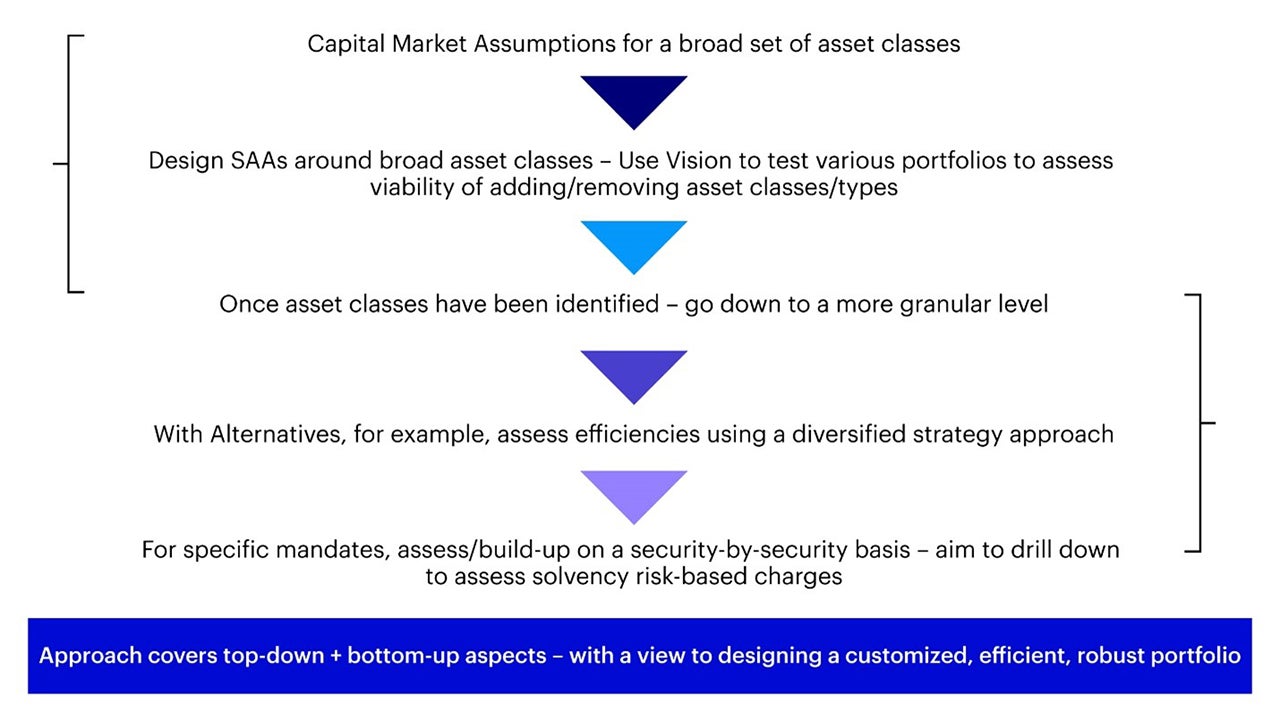
We trust you will find this approach and the information provided through the case study format of use. The aim is to combine the top-down and bottom-up approaches to construct a resilient portfolio, while also highlighting the need for regular analysis of any such portfolio to continuously generate efficiencies.1
Please feel free to reach out to us for a more interactive and customized analysis.
Footnotes
-
1
Investment risks
The value of investments and any income will fluctuate (this may partly be the result of exchange rate fluctuations) and investors may not get back the full amount invested. Diversification and asset allocation do not guarantee a profit or eliminate the risk of loss.
Invesco Investment Solutions (IIS) develops Capital Market Assumptions (CMAs) that provide long-term estimates for the behavior of major asset classes globally. The team is dedicated to designing outcome-oriented, multi-asset portfolios that meet the specific goals of investors. The assumptions, which are based on 5- and 10-year investment time horizon, are intended to guide these strategic asset class allocations. For each selected asset class, IIS develop assumptions for estimated return, estimated standard deviation of return (volatility), and estimated correlation with other asset classes. Estimated returns are subject to uncertainty and error, and can be conditional on economic scenarios. In the event a particular scenario comes to pass, actual returns could be significantly higher or lower than these estimates.
Vision
Invesco Vision is a decision support system that combines analytical and diagnostic capabilities to foster better portfolio management decision-making. Invesco Vision incorporates CMAs, proprietary risk forecasts, and robust optimization techniques to help guide our portfolio construction and rebalancing processes. By helping investors and researchers better understand portfolio risks and trade-offs, it helps to identify potential solutions best aligned with their specific preferences and objectives.
The Invesco Vision tool can be used in practice to develop solutions across a range of challenges encountered in the marketplace. The analysis output and insights shown in the document does not take into account any individual investor’s investment objectives, financial situation or particular needs. The insights are not intended as a recommendation to invest in a specific asset class or strategy, or as a promise of future performance. For additional information on our methodology, please refer to our CMA and Invesco Vision papers.


