Insurance Insights Q2 2024: Strategic Asset Allocations using multi-alternatives

In our past newsletters and in engagements with insurers, we often stress the importance of constantly reviewing Strategic Asset Allocations (SAA) in view of dynamic market conditions, capital markets, as well as liability and product profiles. It remains important to assess whether the current SAA is still valid and whether it can deliver on expectations – including from an asset and liability management perspective – especially relevant as several jurisdictions have or are introducing updated risk-based solvency regimes.
One key input into this process is, of course, the capital market assumptions. At Invesco, we generate a wide set of such assumptions (CMAs) which are updated on a quarterly basis and incorporate the latest market developments. As alluded to, for insurance-focused portfolios, other than just expected return/yield considerations, other aspects such as capital considerations of asset classes and the overall asset-liability matching profile, need to be considered. We usually illustrate this through the charts below – these have been updated over the prior quarter.
Figure 1 assesses the attractiveness of asset classes in terms of current conditions, and Figure 2 re-formats this based on the capital efficiency (expected return-to-standalone capital charge). As before, combining these two elements can help narrow down the initial list of asset types to consider.
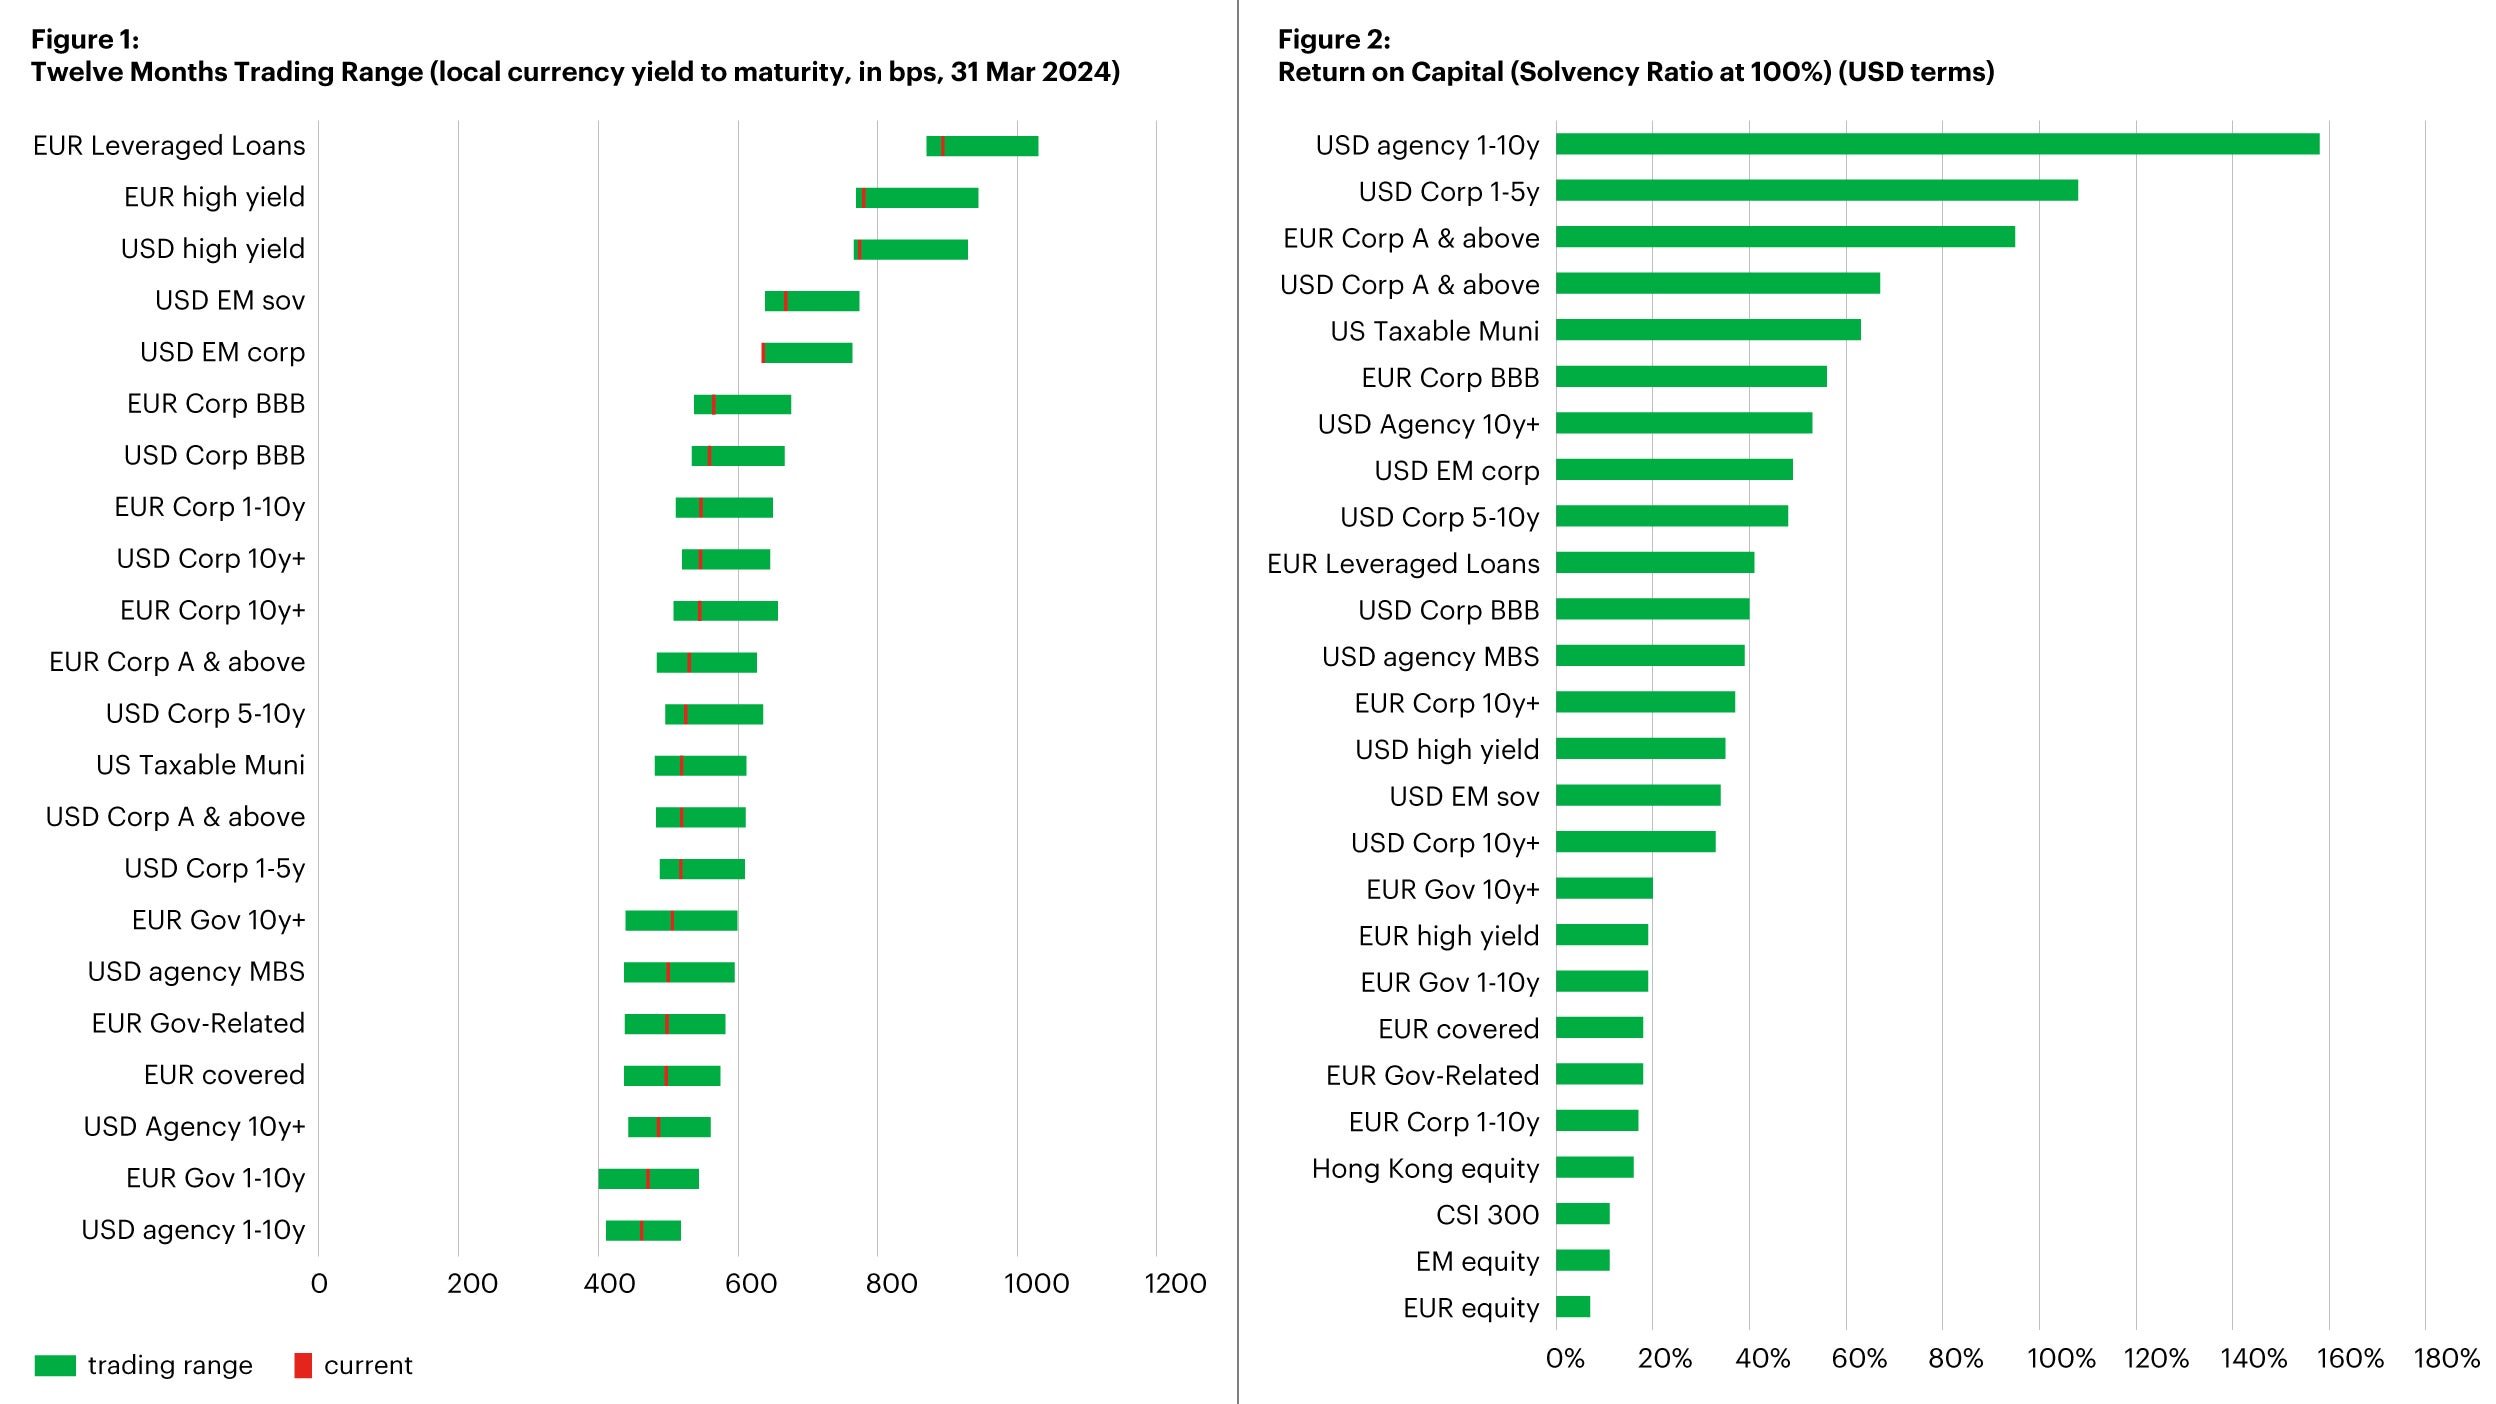
Source: Invesco as of 31 March 2024; Return on Capital = Expected Return / (Solvency Ratio * SCR). For fixed income assets, Barra's duration weighted yield to maturity is used as expected return. For other assets, Invesco CMAs are used where available. CMAs are as of 2024-03-31. Otherwise, manual inputs from Invesco Solutions are used. All the hedging of fixed income assets is based upon swap curves from Barra and basis curves from Bloomberg; where hedging is not assumed, yields / returns are converted into the report’s base currency based upon Bloomberg Generic Govt 10Y Yield differentials. Interest rate risk is excluded from SCR charges. Assets with zero SCR charges are not shown in the graph.
Looking at one dimension alone could potentially lead to inefficiencies in the portfolio. As an example, US taxable municipal bonds, US corporate A-rated and above bonds and indeed shorter duration US corporate bonds have middle-of-the-road yields compared to some of the other asset classes. However, if we were to consider these from a return on capital perspective these asset classes appear relatively efficient. As another example, European leveraged loans are trading at higher yields compared to European high yield bonds. We observe that European leveraged loans also look more efficient compared to high yield bonds – a theme of higher expected returns but close to the same capital charge that we’ll illustrate further. Of course, these charts will change depending on market conditions. Nevertheless, it remains important to assess portfolios across several dimensions and to ensure the objectives are valid and achievable.
[Please note that for purposes of this illustration, we have used the Solvency II Solvency Capital Required (SCR) standard formula for relevant risk charges as a proxy for more general risk-based capital (RBC) regimes.]
Updating Strategic Asset Allocations – Incorporating new asset classes
We have shown earlier how the introduction of some representative alternative asset classes can help improve the efficiency of insurance portfolios.
To recap, let’s see what happens to a hypothetical portfolio if we were to consider adding private credit and private equity as examples of alternative asset classes (in addition to an allocation to Asian investment grade credit) - how could we assess the impact?
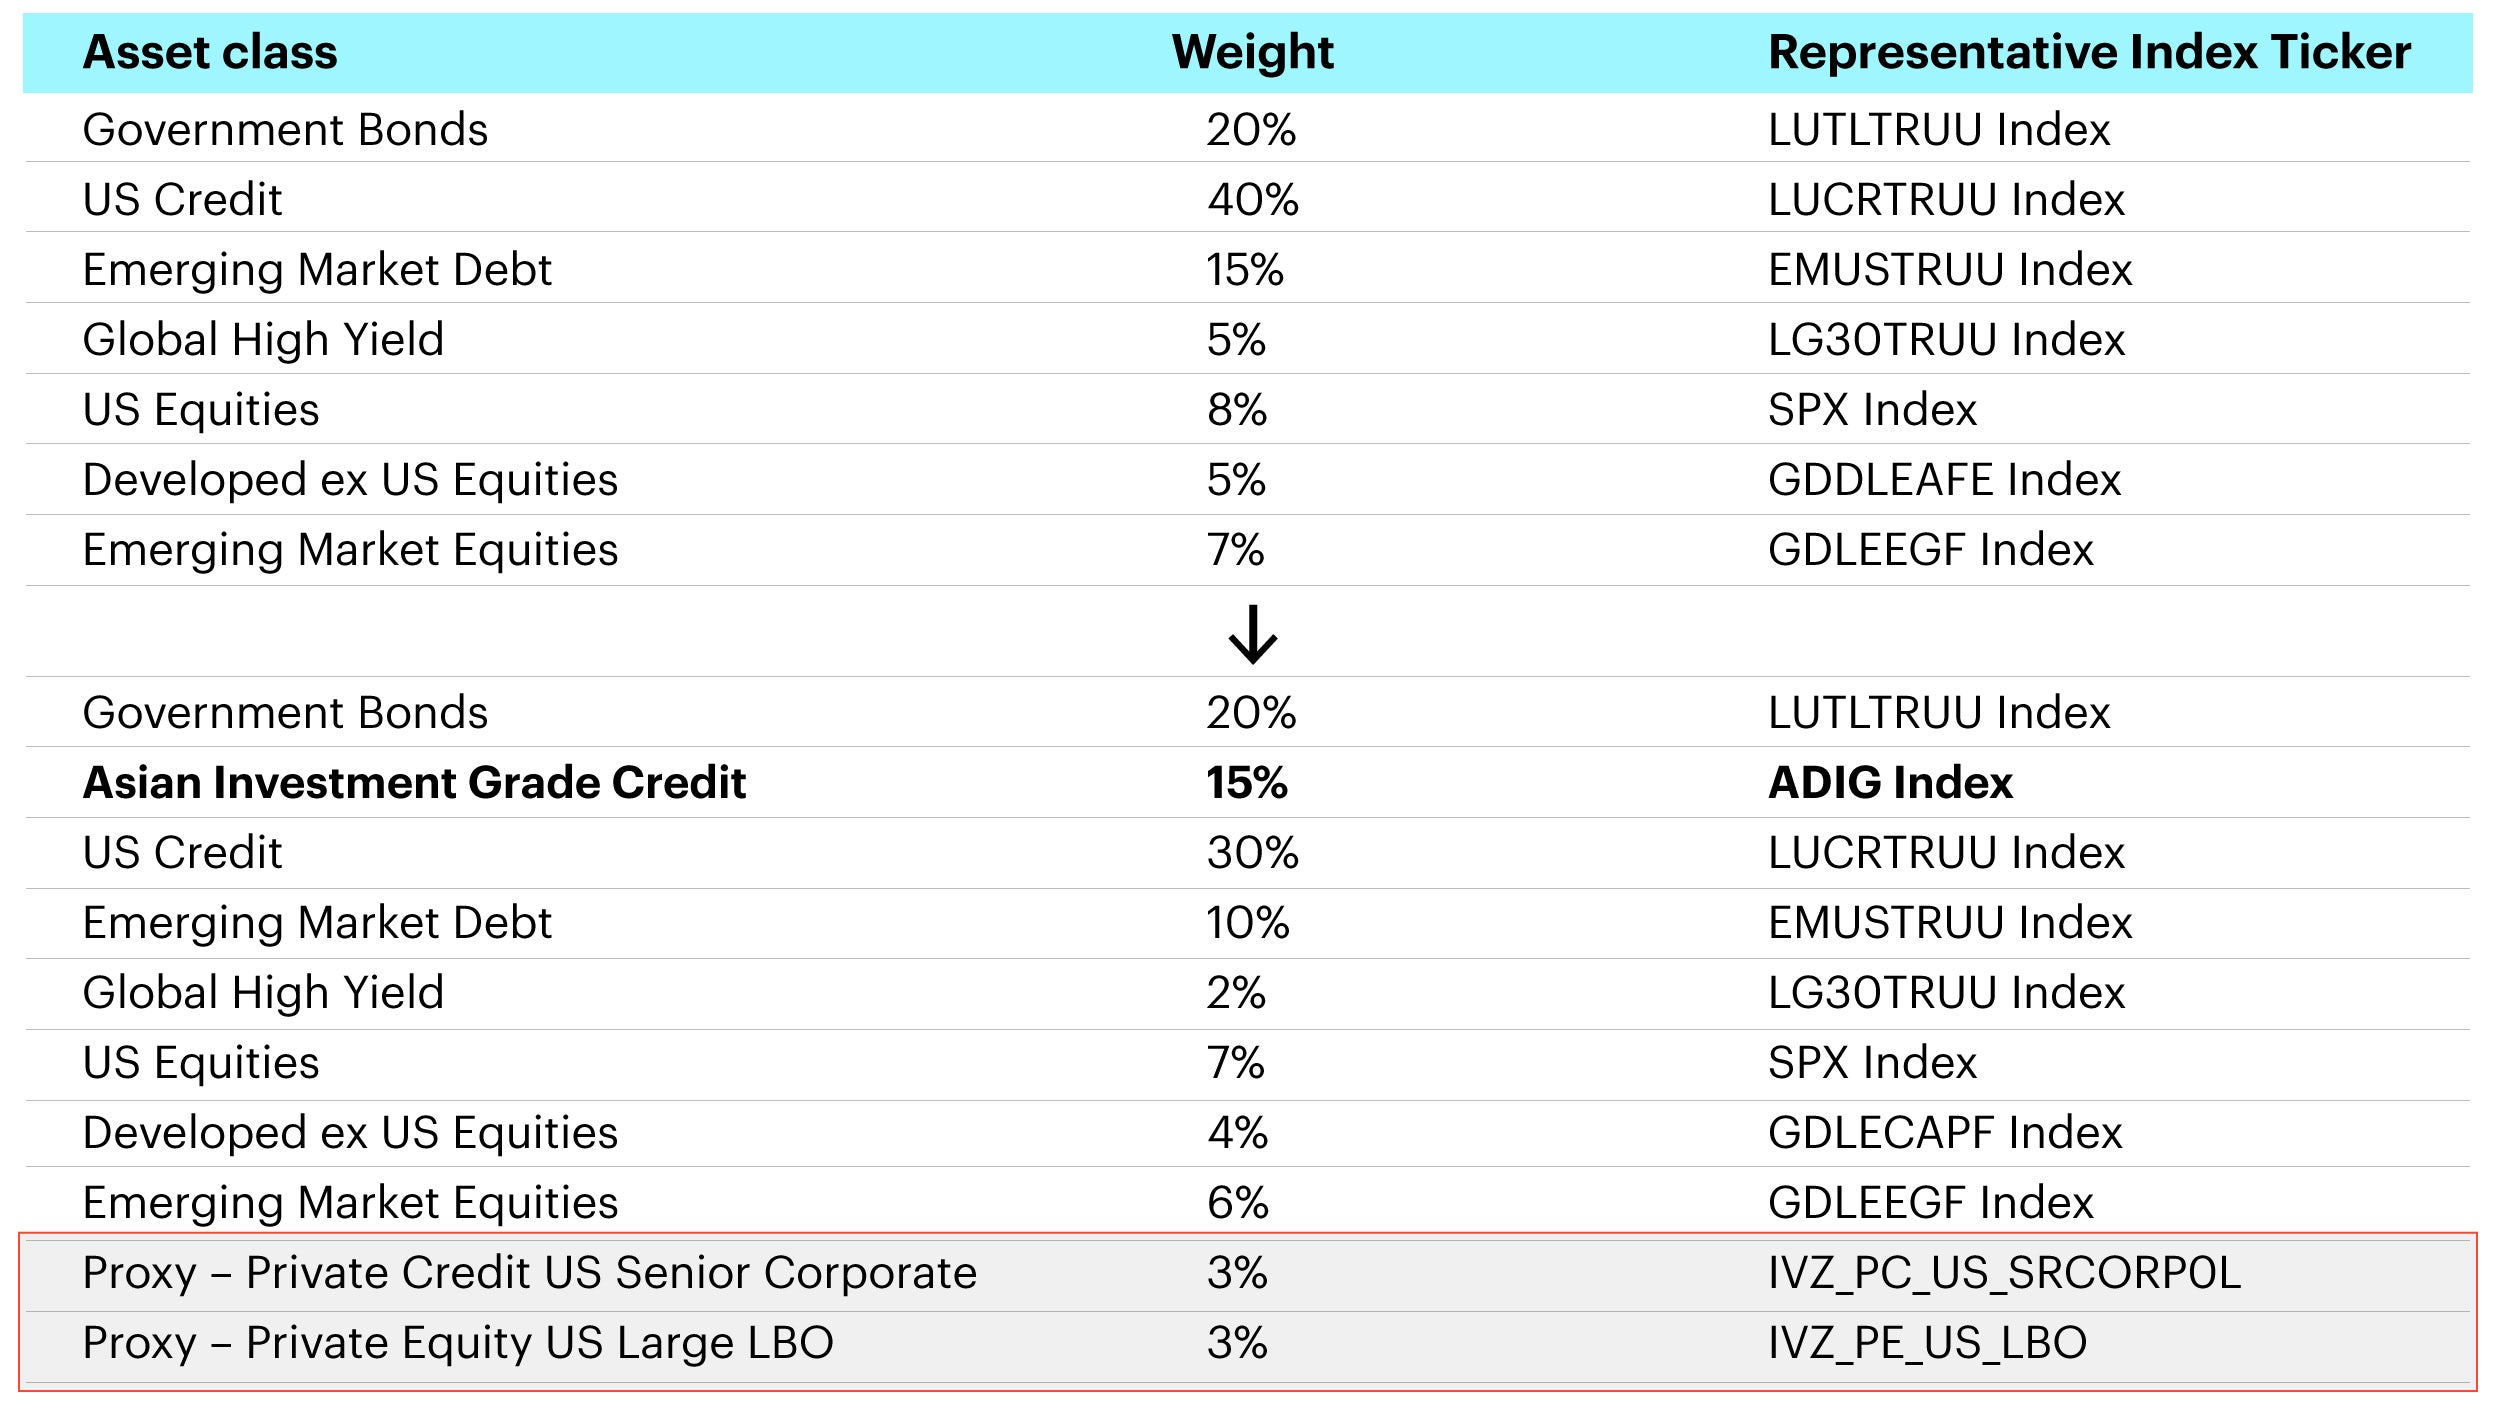
Note: Bloomberg Barclays US Long Treasury Total Return (LUTLTRUU IDX), ICE BofA Asian Dollar Investment Grade Index (ADIG IDX), US Corporate Total Return Value Unhedged USD (LUCRTRUU IDX), EM USD Aggregate USD Unhedged (EMUSTRUU IDX), Global High Yield Total Return (LG30TRUU IDX). S&P 500 Index (SPX IDX), MSCI Daily TR Gross EAFE Local (GDDLEAFE IDX), MSCI EM Daily TR Gross Emerging Markets EM Local (GDLEEGF IDX). Proxy - Invesco Private Credit US Senior Corporate Unlevered Index (IVZ_PC_US_SRCORP0L), Proxy - Invesco Private Equity US Large Leveraged Buyout Index (IVZ_PE_US_LBO).
Using our in-house portfolio management decision support system – called Invesco Vision1 – we are able to compare different asset allocations. The charts below (Figure 3 and 4) compare the risk-return profiles of the two portfolios above to see what impact the addition of such alternative asset classes has. Our aim is to assess how the risk-return profile changes by adding new asset classes.
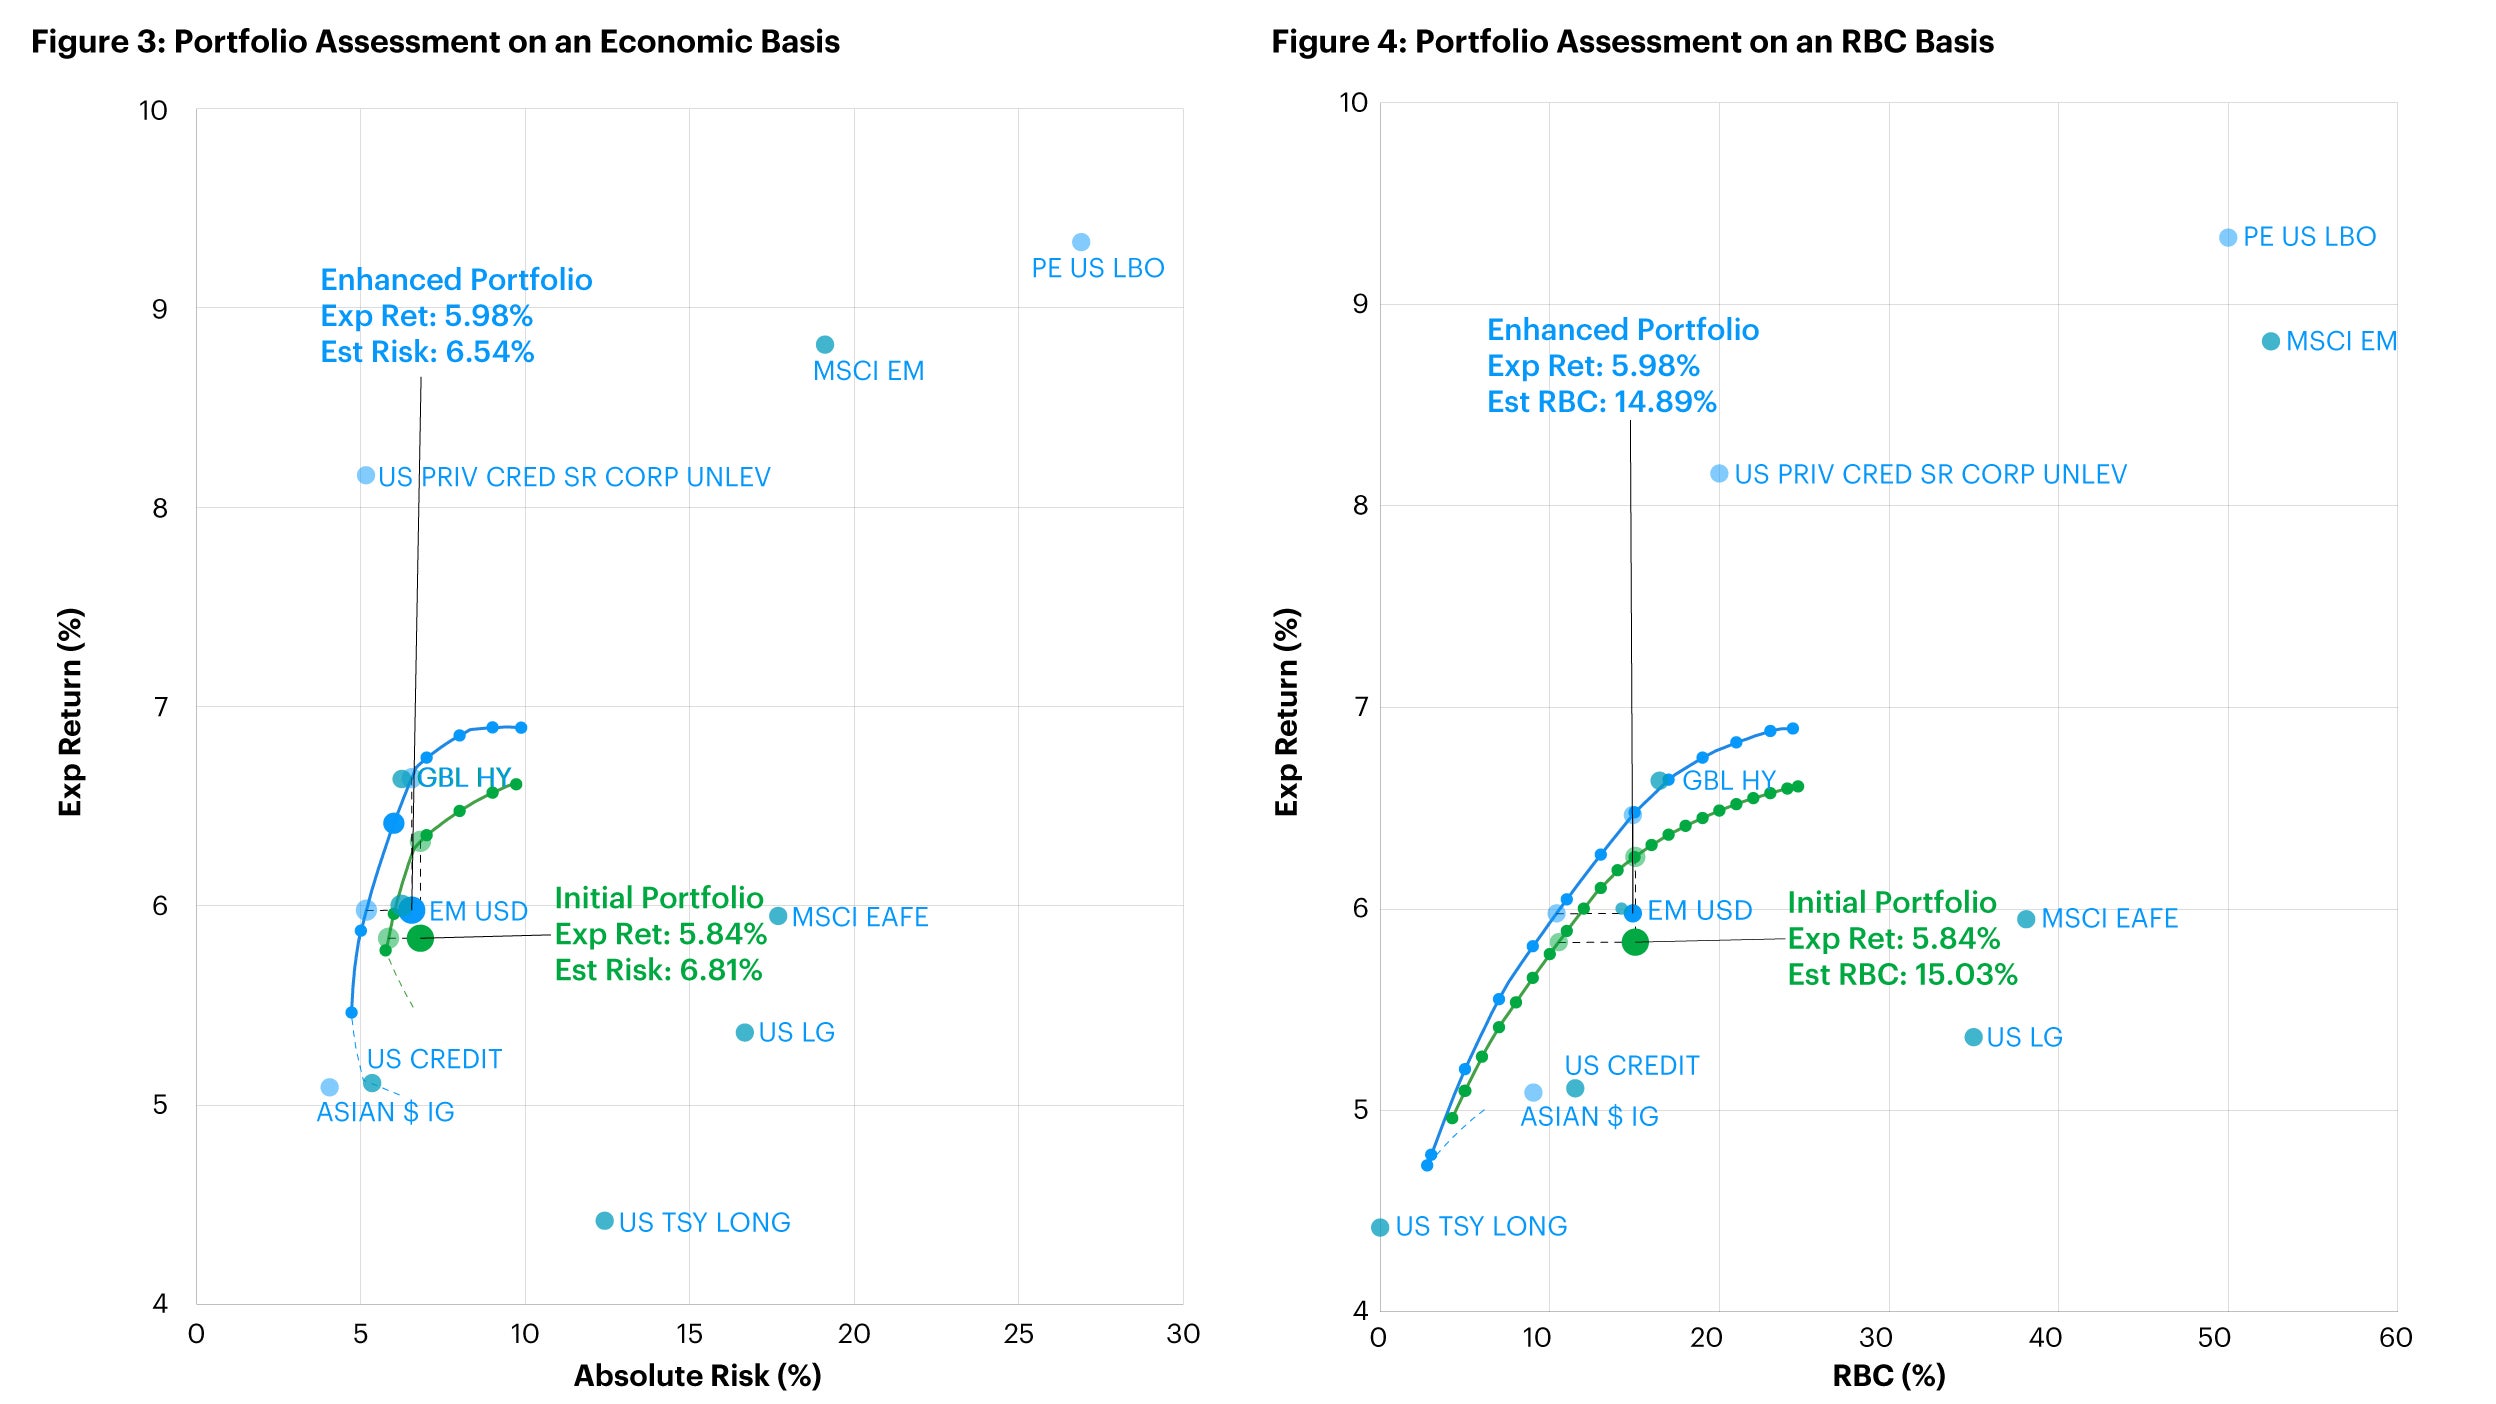
Source: Invesco analysis, 31 March 2024. There is no guarantee the expected return can be achieved.
Figure 3 (left) shows the portfolio characteristics on an economic basis and Figure 4 (right) shows the characteristics on a generic RBC basis (estimated spread charge for asset classes). The green line represents the frontier without private credit/private equity and the blue line represents the frontier including the alternative asset classes (and including Asian investment grade credit); the green and blue single points highlighted represent the respective portfolios.
We can see that by selectively adding generic private credit/private equity and some Asian investment grade credit, we can improve the overall risk-return profile of the portfolios – the blue frontier is higher (than the green) and the enhanced portfolio with alternatives represented by the blue single point highlighted shows a move upwards and appears to offer a better profile (obviously, the allocation change is fairly small and so the corresponding portfolio change would be similarly small). This is a simple example to indicate how the selection of specific asset classes can help enhance portfolios.
The effects of adding diversified alternatives (multi-alternatives) exposure to a portfolio
Our next step is to assess whether diversifying our alternatives exposure can enhance the efficiency. That is, instead of allocations to single strategy private credit and private equity, what would happen if we were to construct a sub-portfolio of different alternatives strategies covering different types of private credit and private equity strategies. We believe diversified exposure to “multi-alternatives” has the potential to offer enhanced and more resilient portfolios.
In the revised portfolio below, we have replaced the earlier private credit exposure with a multi-alternatives income strategy, and the private equity exposure with a multi-alternatives growth strategy.

The diversified multi-alts income and growth strategies constitute the following individual strategy-types:


Note: Bloomberg Barclays US Long Treasury Total Return (LUTLTRUU IDX), ICE BofA Asian Dollar Investment Grade Index (ADIG IDX), US Corporate Total Return Value Unhedged USD (LUCRTRUU IDX), EM USD Aggregate USD Unhedged (EMUSTRUU IDX), Global High Yield Total Return (LG30TRUU IDX). S&P 500 Index (SPX IDX), MSCI Daily TR Gross EAFE Local (GDDLEAFE IDX), MSCI EM Daily TR Gross Emerging Markets EM Local (GDLEEGF IDX). Diversified Multi-Alts Growth is an internal Invesco-modeled asset comprising the following representative strategies/indices as proxies: Private Credit US Distressed, Private Equity US Early Ventures, Private Equity US Growth, Private Equity US Large Buyout, Private Equity Middle Market, Real Estate Opportunistic, Real Estate Value-Add; Diversified Multi-Alts Income is an internal Invesco-modeled asset comprising the following representative strategies/indices as proxies: Credit Suisse Leveraged Loan Index (CSLLLTOT IDX), Alternative Credit, Private Credit US Infrastructure High Yield, Private Credit US Mezzanine Corporate (Middle-Market), Private Credit US Mezzanine Real Estate, Private Credit US Senior Corporate Unlevered. Strategies/indices/proxies indicated here may not be directly investable. For illustrative purposes only. An investment cannot be made in an index
In this updated portfolio above, we have replaced our single private credit and private equity exposures with allocations to several different strategies - ranging from private equity buyout, growth, venture capital, to opportunistic and value-added real estate exposure, as well as private credit.
The allocations here are meant to be for illustrative purposes only. Bespoke multi-alternatives portfolios can be constructed by taking into consideration desired risk-reward profiles with correspondingly appropriate allocations – these are highly customizable (dependent on certain minimum allocation amounts).
The charts below (Figure 5 and 6) compare the risk-return profiles of the two portfolios above – to see what impact the addition of a diversified multi-alternatives exposure has - the aim is to assess how the risk-return profile changes as a result of adding a diversified range of asset classes.
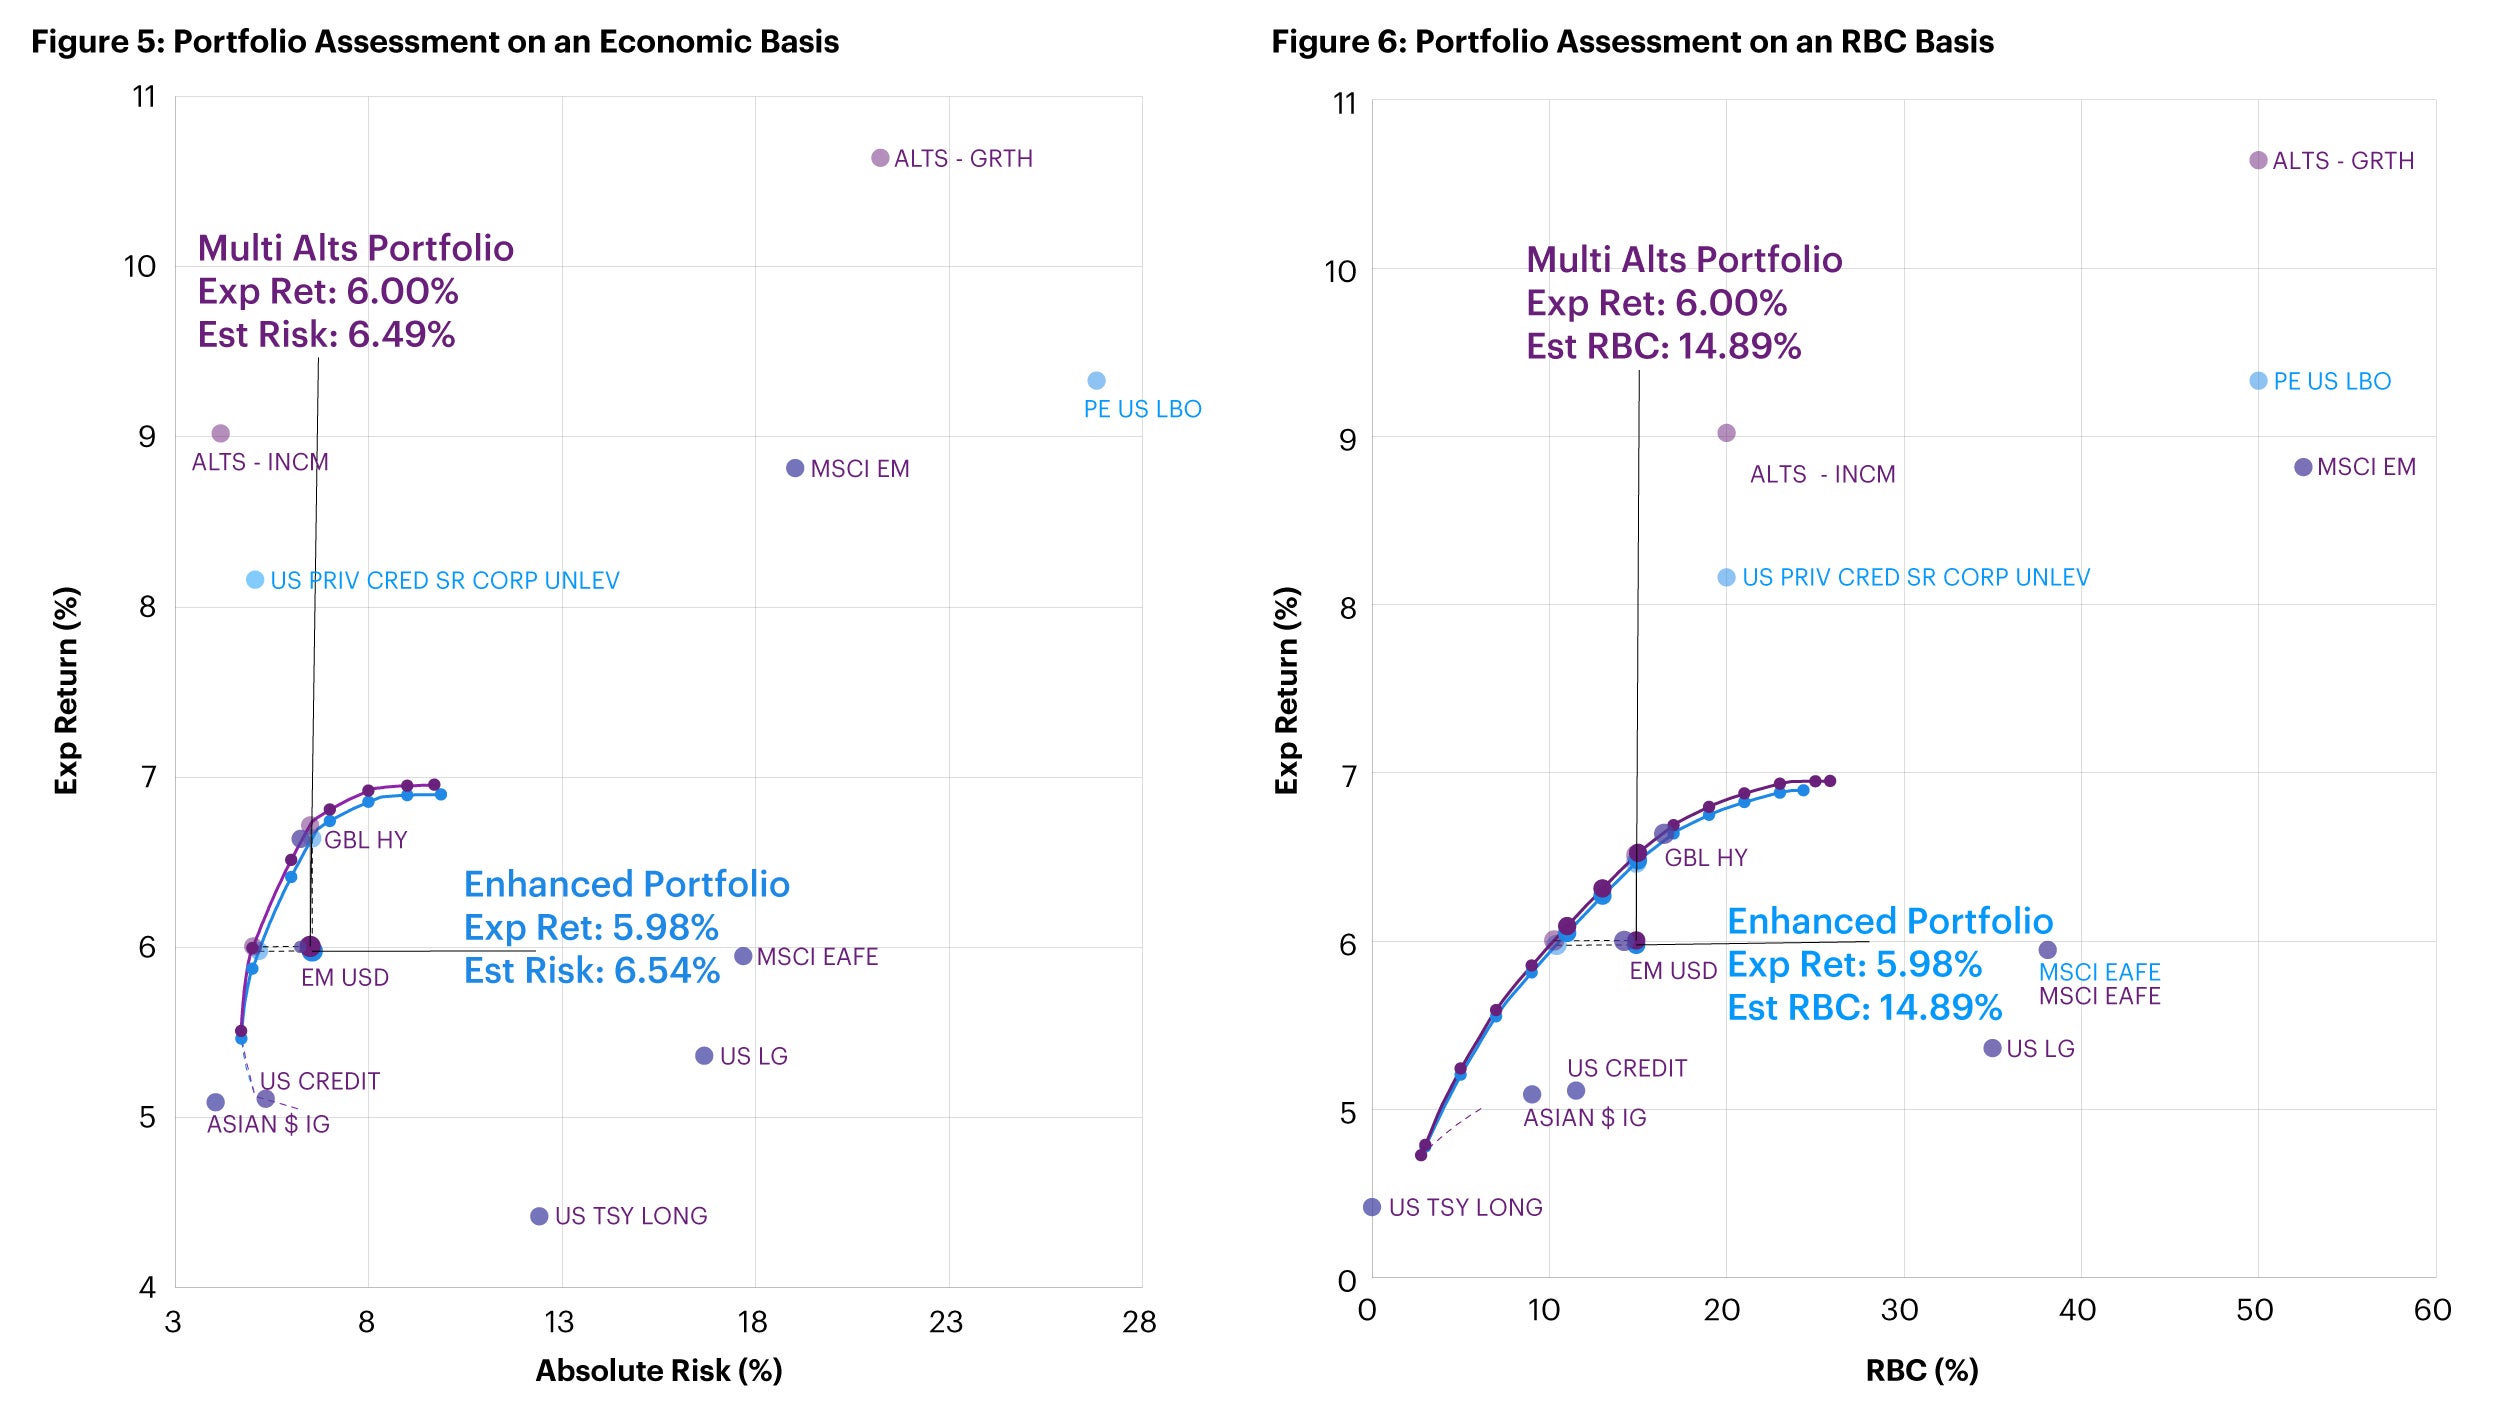
Source: Invesco analysis, 31 March 2024. For illustrative purposes only. There is no guarantee the expected return can be achieved.
Figure 5 (left) shows the portfolio characteristics on an economic basis and Figure 6 (right) shows the characteristics on a generic RBC basis (estimated spread charge for asset classes). The blue line represents the frontier with the single private credit and private equity strategies while the purple line represents the frontier with the diversified multi-alternatives strategies (the blue and purple single points represent the respective portfolio asset allocations).
We observe that by incorporating a diversified multi-alternatives exposure within our portfolio, we have been able to further enhance the efficiency of the overall portfolio – by moving our portfolio slightly up and to the left. These are very small exposures – hence, the impact is not expected to be as significant – however, the conclusion is that efficiencies can still be generated from careful asset class/strategy selection.
The chart below magnifies the comparison of the single private credit and private equity strategies with the diversified multi-alternatives strategy to illustrate the potential benefit of the enhanced profile.
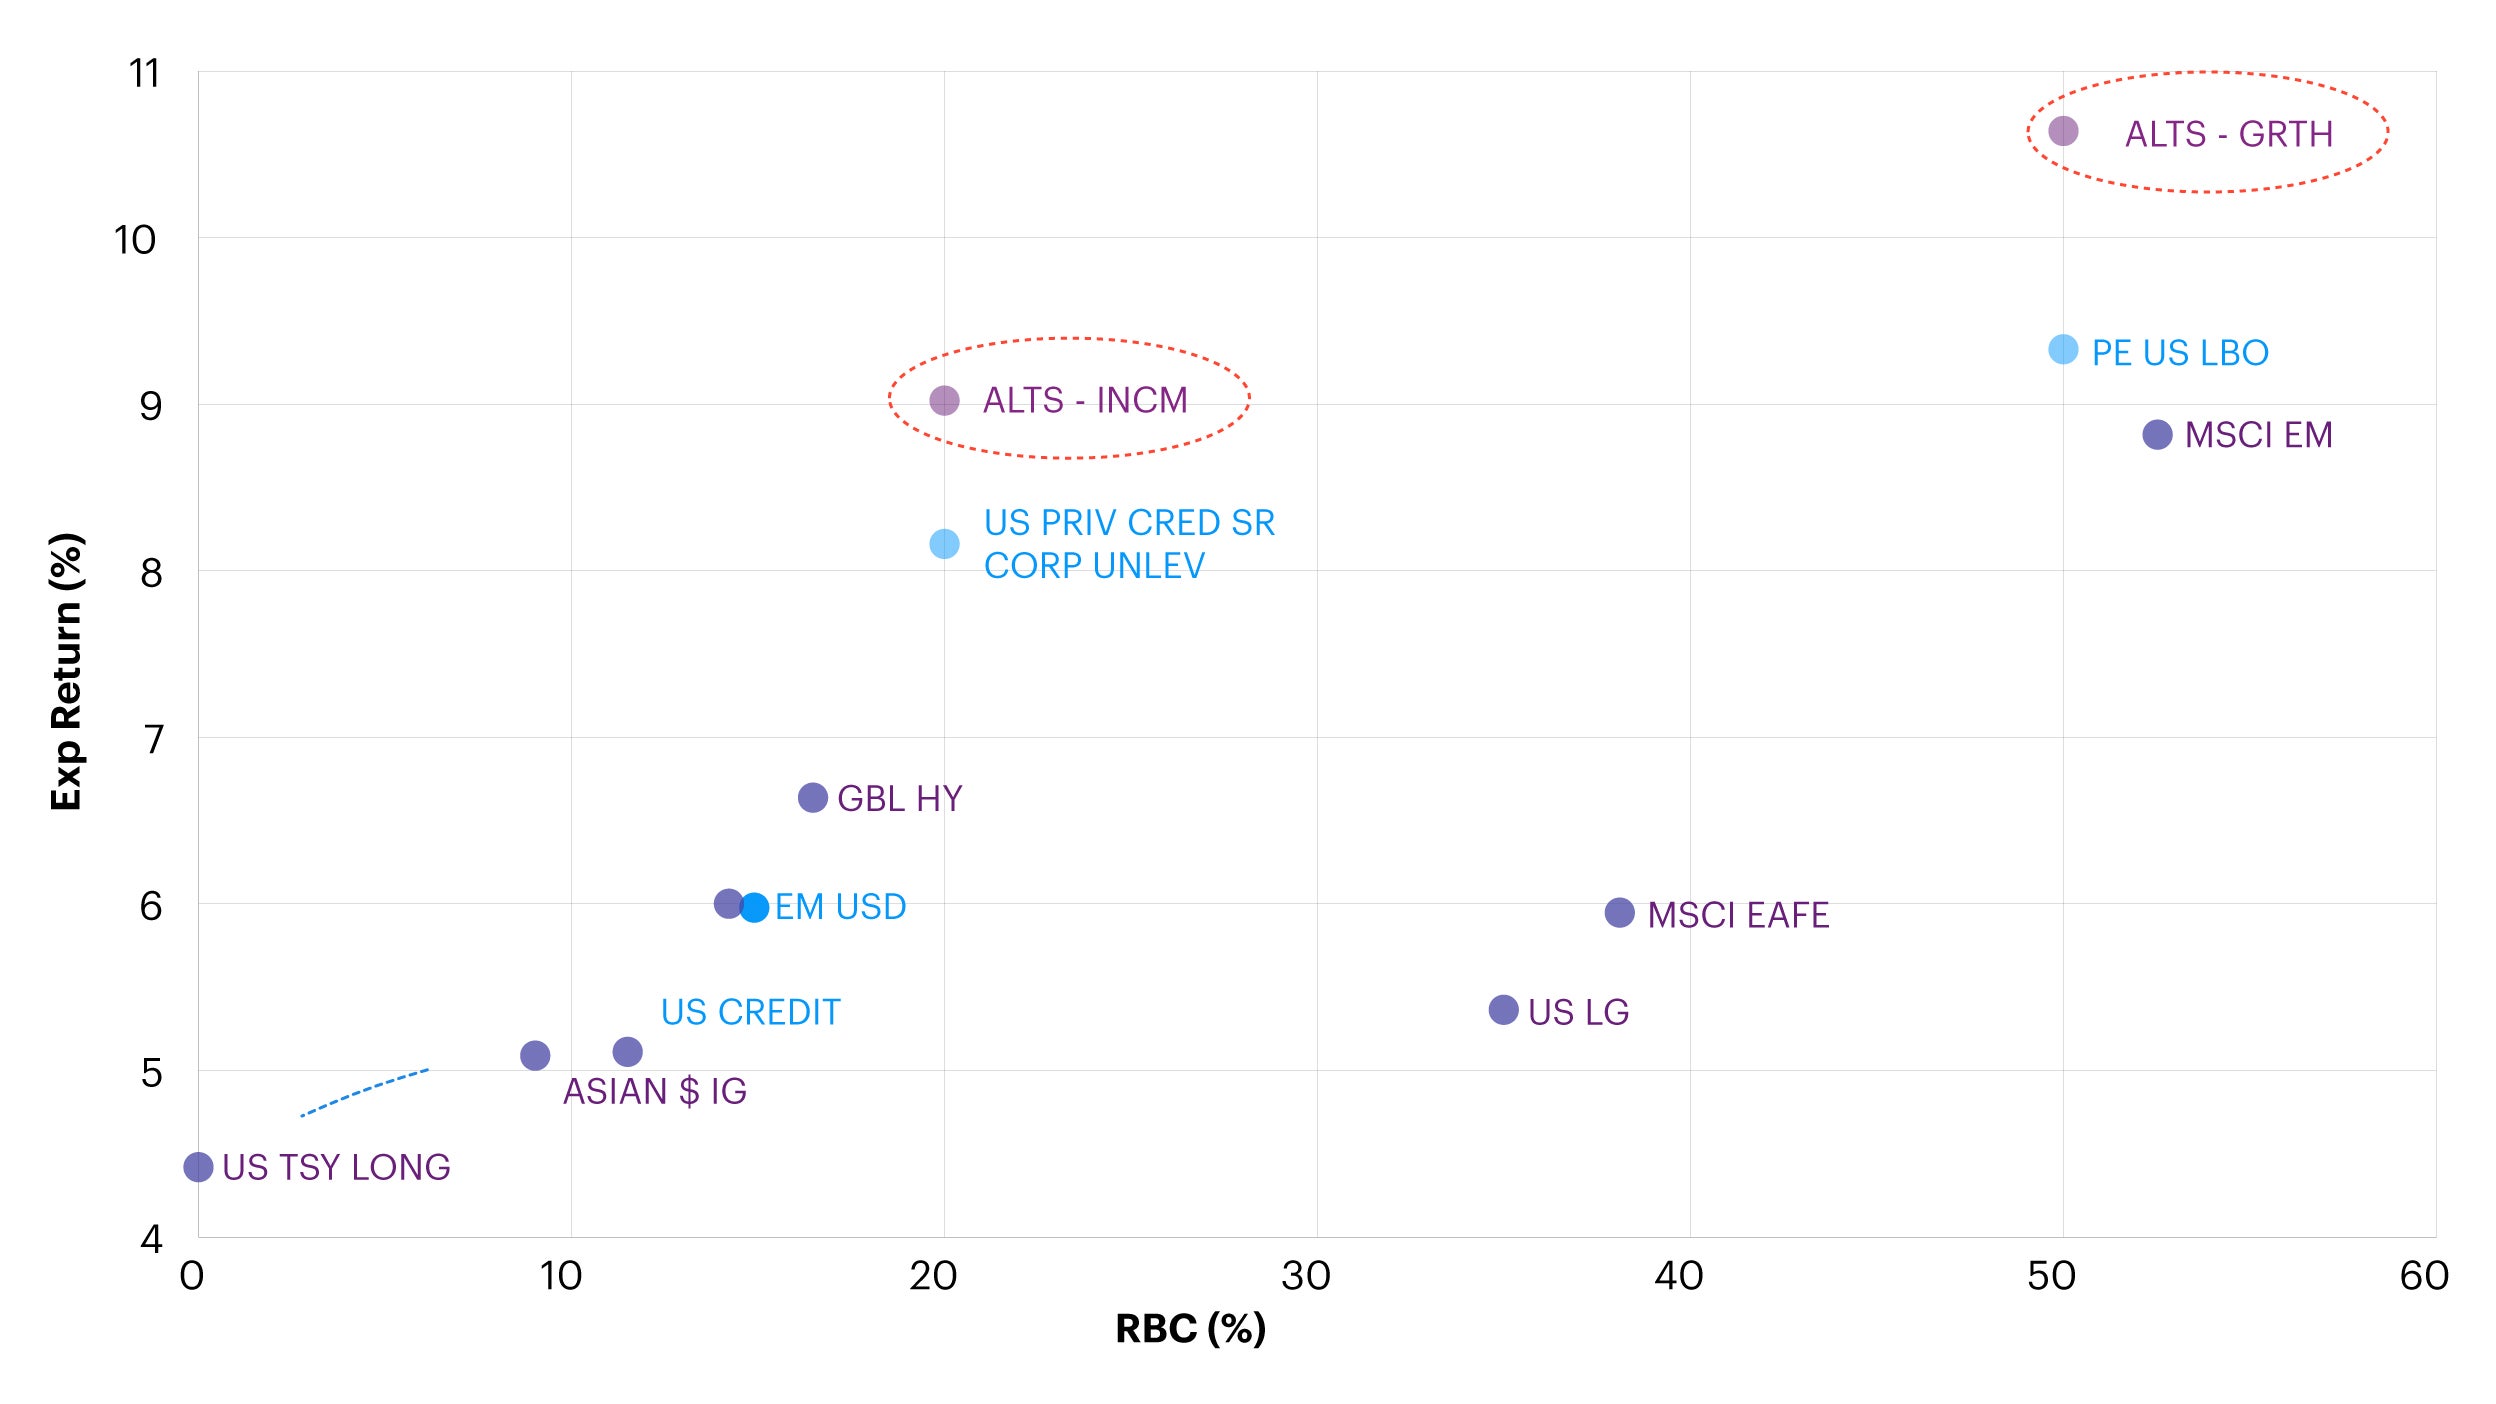
Source: Invesco analysis, 31 March 2024. For illustrative purposes only. There is no guarantee the expected return can be achieved.
Here (Figure 7) we can more clearly see the enhanced profile of the diversified multi-alternatives strategies (income and growth) compared to the asset classes they are replacing. This assessment takes into consideration aspects of expected returns and estimated RBC charges for the indicated asset classes (subject to change depending on the allocation of the underlying assets).
We believe this is an example of the types of analyses that are very appropriate and, indeed, should be part of any standard operating procedure in managing insurance portfolios.
Potential operating model
Operationalizing any such program in an effective manner is almost equally important for insurers, however implementing such a program can be challenging and complex.
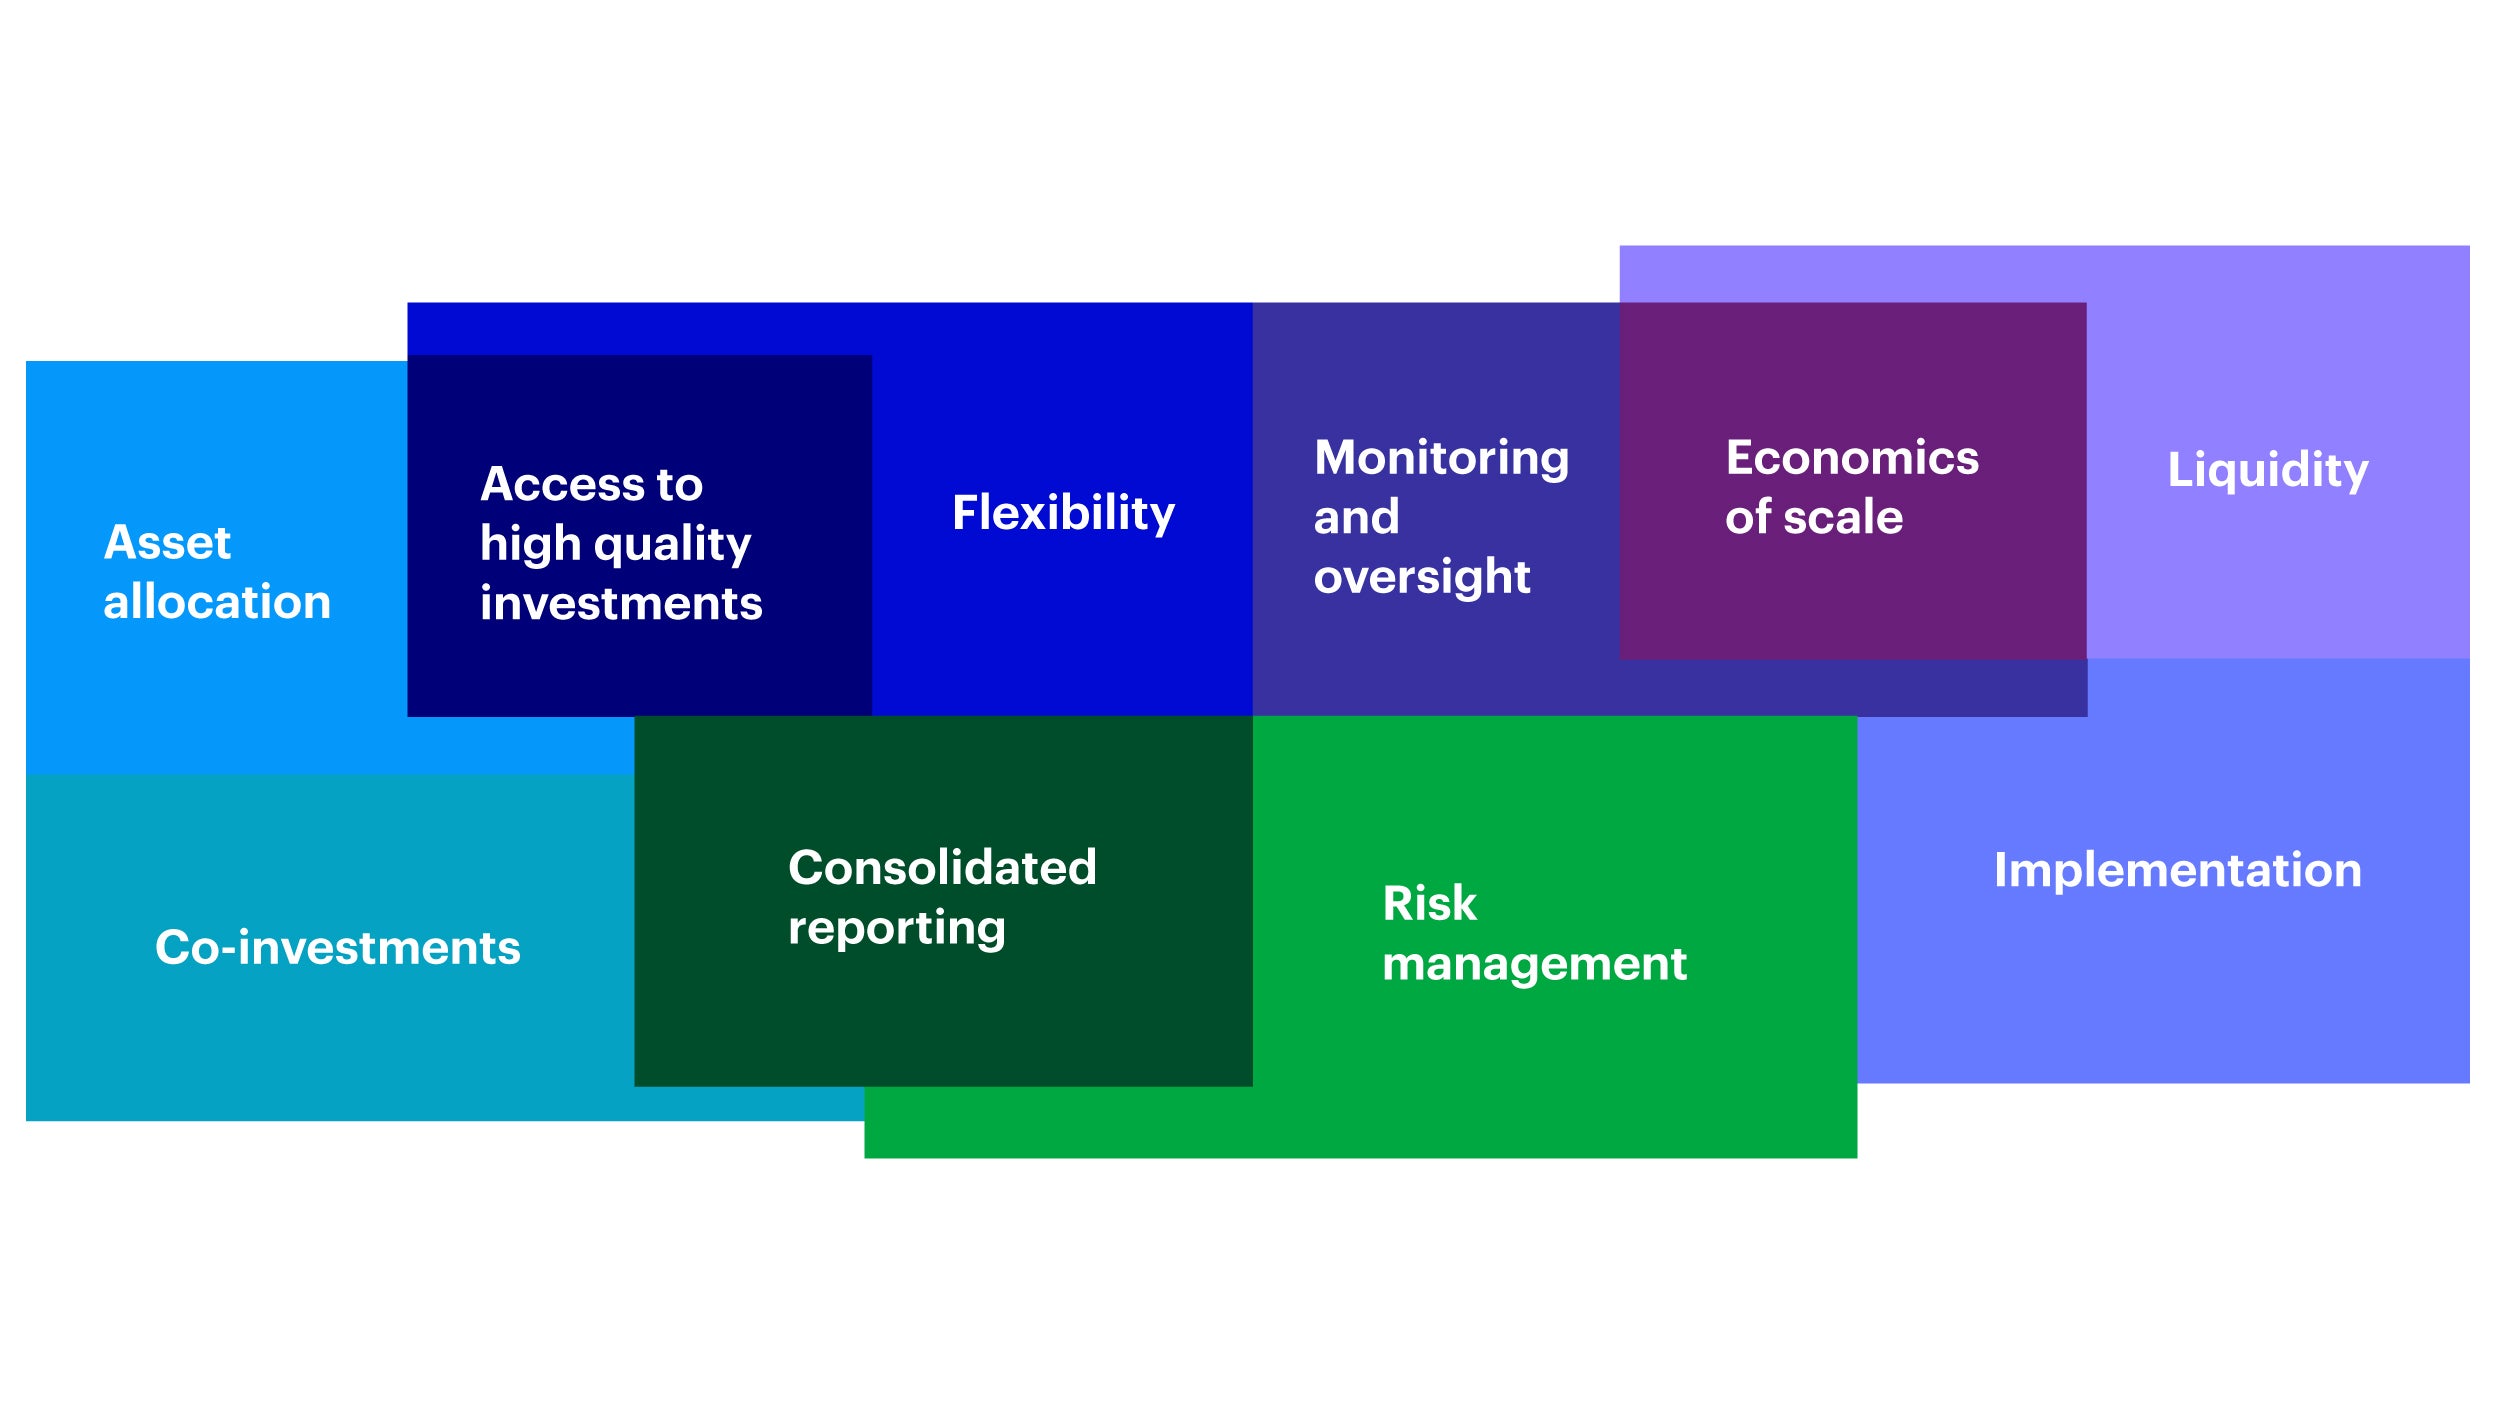
Source: Invesco. For illustrative purposes only.
Our belief is that optimal outcomes of any such program depend on a close interaction between investors and asset managers and the approach should be to deliver a portfolio that fully meets investors’ requirements over time and acts as an extension of staff with a focus on knowledge sharing.
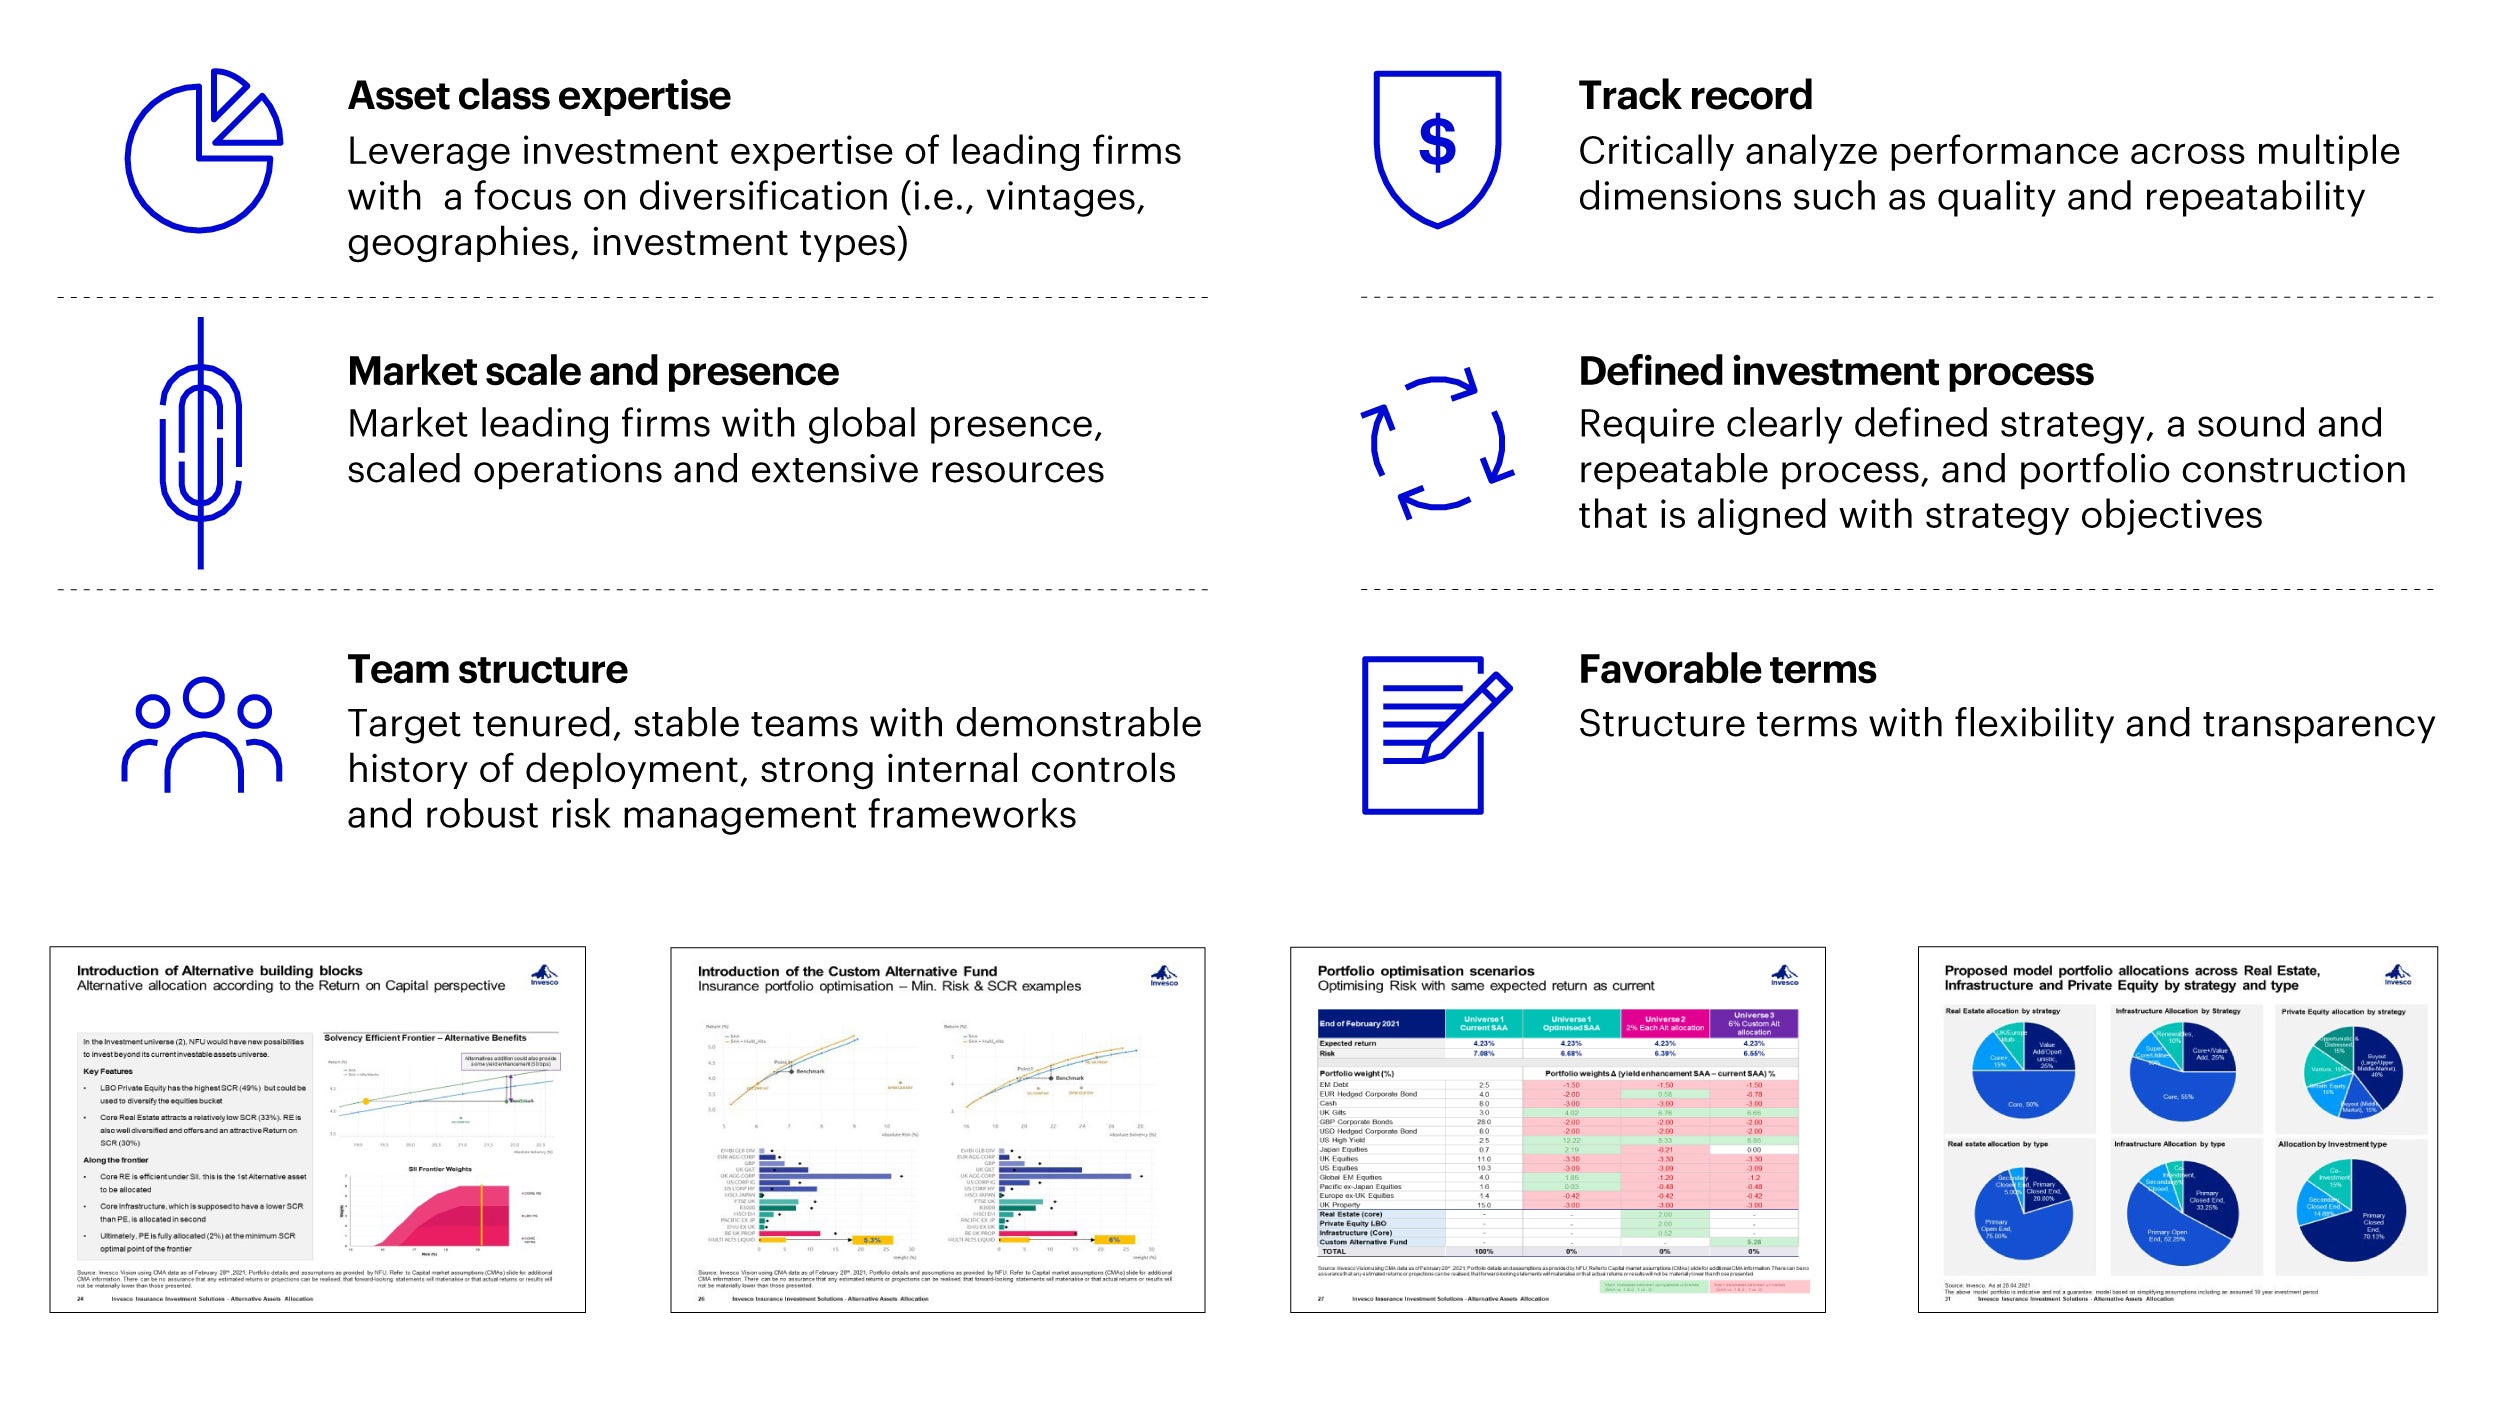
Source: Invesco. For illustrative purposes only.
Finally, we feel it remains vital to maintain oversight over several activities associated with this asset class and investors can consider an effective combination of external and internal monitoring tools to achieve the optimal process.
We believe the pragmatic process we have outlined above can meet these requirements. In our view, using this collaborative approach can lead to more robust outcomes for insurers’ portfolios.
Key takeaways
We hope the approach and examples above of enhancing insurance portfolios has been helpful. We have built upon our earlier higher-level analysis and supplemented it here by delving more deeply into specific asset classes – the ultimate aim always being to enhance the risk-return profile of the hypothetical portfolios and to make them more efficient.
We feel alternatives (illiquids/private market assets) are still quite relevant within such portfolio constructs – from both efficiency and diversification perspectives - and lend themselves well to typical life insurers’ portfolios. As we have highlighted earlier, it remains vital to assess the specific types of sub-asset classes, understand the sources of return and risk, including operational, accounting, tax considerations, liquidity requirements, and, finally, be able to manage and/or have sufficient oversight of such programs.
As always, please do not hesitate to reach out to us – your thoughts on such topics are always much appreciated.
Investment risks
The value of investments and any income will fluctuate (this may partly be the result of exchange rate fluctuations) and investors may not get back the full amount invested. Diversification and asset allocation do not guarantee a profit or eliminate the risk of loss.
Invesco Solutions (IS) develops Capital Market Assumptions (CMAs) that provide long-term estimates for the behavior of major asset classes globally. The team is dedicated to designing outcome-oriented, multi-asset portfolios that meet the specific goals of investors. The assumptions, which are based on 5- and 10-year investment time horizon, are intended to guide these strategic asset class allocations. For each selected asset class, IS develop assumptions for estimated return, estimated standard deviation of return (volatility), and estimated correlation with other asset classes. Estimated returns are subject to uncertainty and error and can be conditional on economic scenarios. In the event a particular scenario comes to pass, actual returns could be significantly higher or lower than these estimates.
Footnotes
-
1
Invesco Vision
Invesco Vision is a decision support system that combines analytical and diagnostic capabilities to foster better portfolio management decision-making. Invesco Vision incorporates CMAs, proprietary risk forecasts, and robust optimization techniques to help guide our portfolio construction and rebalancing processes. By helping investors and researchers better understand portfolio risks and trade-offs, it helps to identify potential solutions best aligned with their specific preferences and objectives.
The Invesco Vision tool can be used in practice to develop solutions across a range of challenges encountered in the marketplace. The analysis output and insights shown in the document does not take into account any individual investor’s investment objectives, financial situation or particular needs. The insights are not intended as a recommendation to invest in a specific asset class or strategy, or as a promise of future performance. For additional information on our methodology, please refer to our CMA and Invesco Vision papers.


