A macro approach to navigating the business cycle
The drivers of asset prices and how to unlock their potential

Understanding what drives asset prices
"Financial markets contain information about future economic activity, as market participants discount information affecting future fundamentals in real time. Notably, asset prices can reflect a broader set of fundamental news, such as changes in monetary conditions, fiscal policy announcements, corporate news, global financial shocks, etc."
Time Series Variation in Factor Premia: The influence of the Business Cycle, Polk, Haghbin, de Longis.. The Journal of Investment Management , Vol. 18 No. 1 (2020).
Distilling market data into actionable portfolio insights may be easier said than done
A broader approach to understanding the macroeconomic regimes may provide the ability to outperform, while mitigating risk.
The word macro is derived from the ancient Greek makros meaning “long, abnormally large, on a large scale”, therefore the macroeconomy represents a delicately intertwined web of variables that can impact asset prices.
The complexity of the global economy can be felt most acutely by those seeking to hedge its inherent risks. Often, there is a contrast between investor expectations and realities, a phenomenon that can often be attributed to allocation decisions that either came too late (or early) or even worse misreading market signals altogether. Perhaps, our focus is too unilateral, and that tunnel vision clouds our ability to assess, holistically, what broad set of market factors are at play and therefore how markets may be impacted.
A recent example highlights the caution one should place on the predictive powers of single data points and market timing. The inflation shock post-COVID caused many investors to consider inflation hedges, such as Treasury Inflation Protection Securities (TIPS) and real assets into their asset allocation mix. However, broader forces were also at play leading to unexpected or unintended outcomes for some of these asset classes. TIPS were a prime example as the embedded interest rate risk, or duration, caused the sharp move in real rates to overwhelm the inflation hedging potential and deliver a negative return to investors in 2022 despite inflation hitting a 40-year high.
Inflation shocks often retreat quickly, typically leaving sharp market impacts in their wake
Source: Bloomberg, The White House, Invesco. CPI = US Urban Consumers Price Index, year over year change, not seasonally adjusted
As market volatility re-emerges after years of policy-fueled hibernation, the topic of how best to protect portfolios from the next market shock is top of mind. Our research shows that a broad assessment of macroeconomic and market data, globally, can provide a greater chance of navigating uncertainty by leveraging its predictive power in anticipating the future state of economic growth. In other words, a better roadmap for identifying the macro landscape and positioning accordingly can prevent investors from pulling yesterday’s portfolio-protection levers to hedge tomorrow’s risks.
Invesco’s solution is a forward-looking, macro-regime framework for dynamically adjusting portfolio exposures across multiple asset classes, which takes a comprehensive approach to distilling the complexities of our economy.
Invesco’s macro regime framework defines four stages in the business cycle based on the expected level and change in economic growth
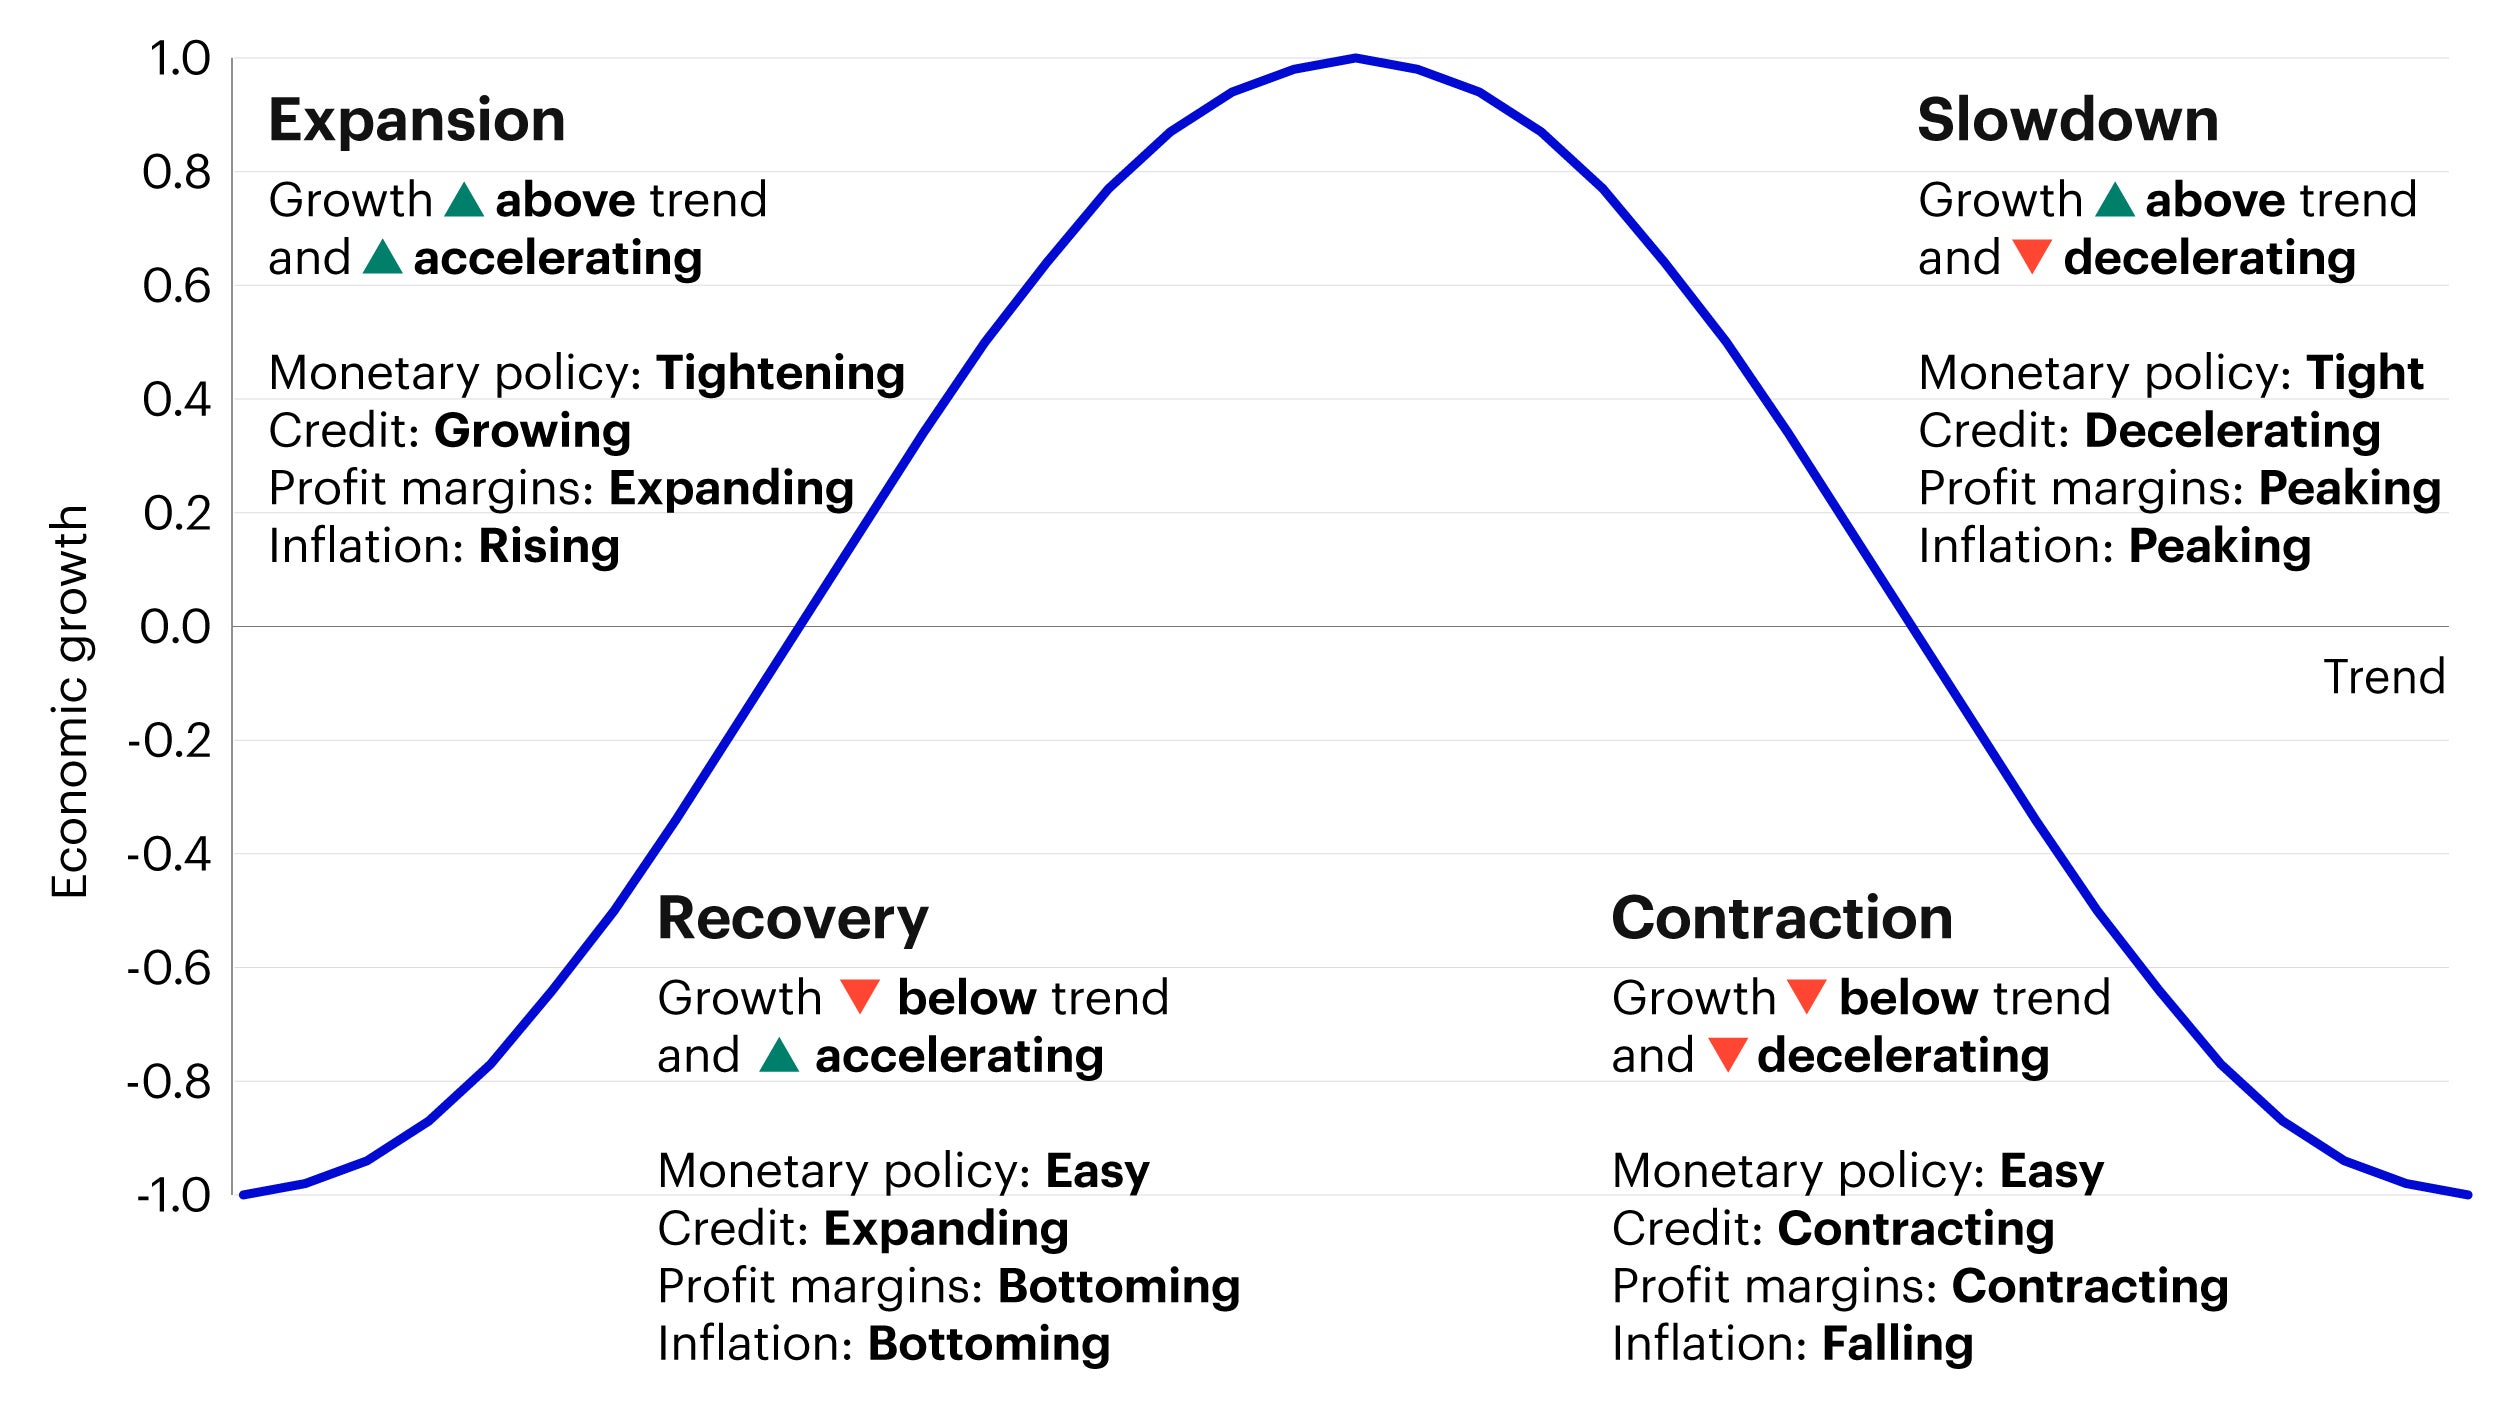
For illustrative purposes only
Better results require better tools
Traditionally, economists rely on indicators such as change in GDP growth, industrial production, or the unemployment rate to perform historical analysis of economic cycles. However, these measures may be impractical for real-time investment decisions as they are released at a lag and are subject to revisions. Plus, financial markets tend to lead real economic activity, not the other way around. By the time non-leading economic data is available, it tells us more about the past than the future direction of asset prices. By focusing on forward-looking indicators, we aim to anticipate turning points in economic activity and financial markets performance.
Leading Economic Indicators (LEI)
To overcome these problems, we constructed a leading indicator of the respective local economy using high frequency economic and financial data, available at least monthly, and not subject to revisions.
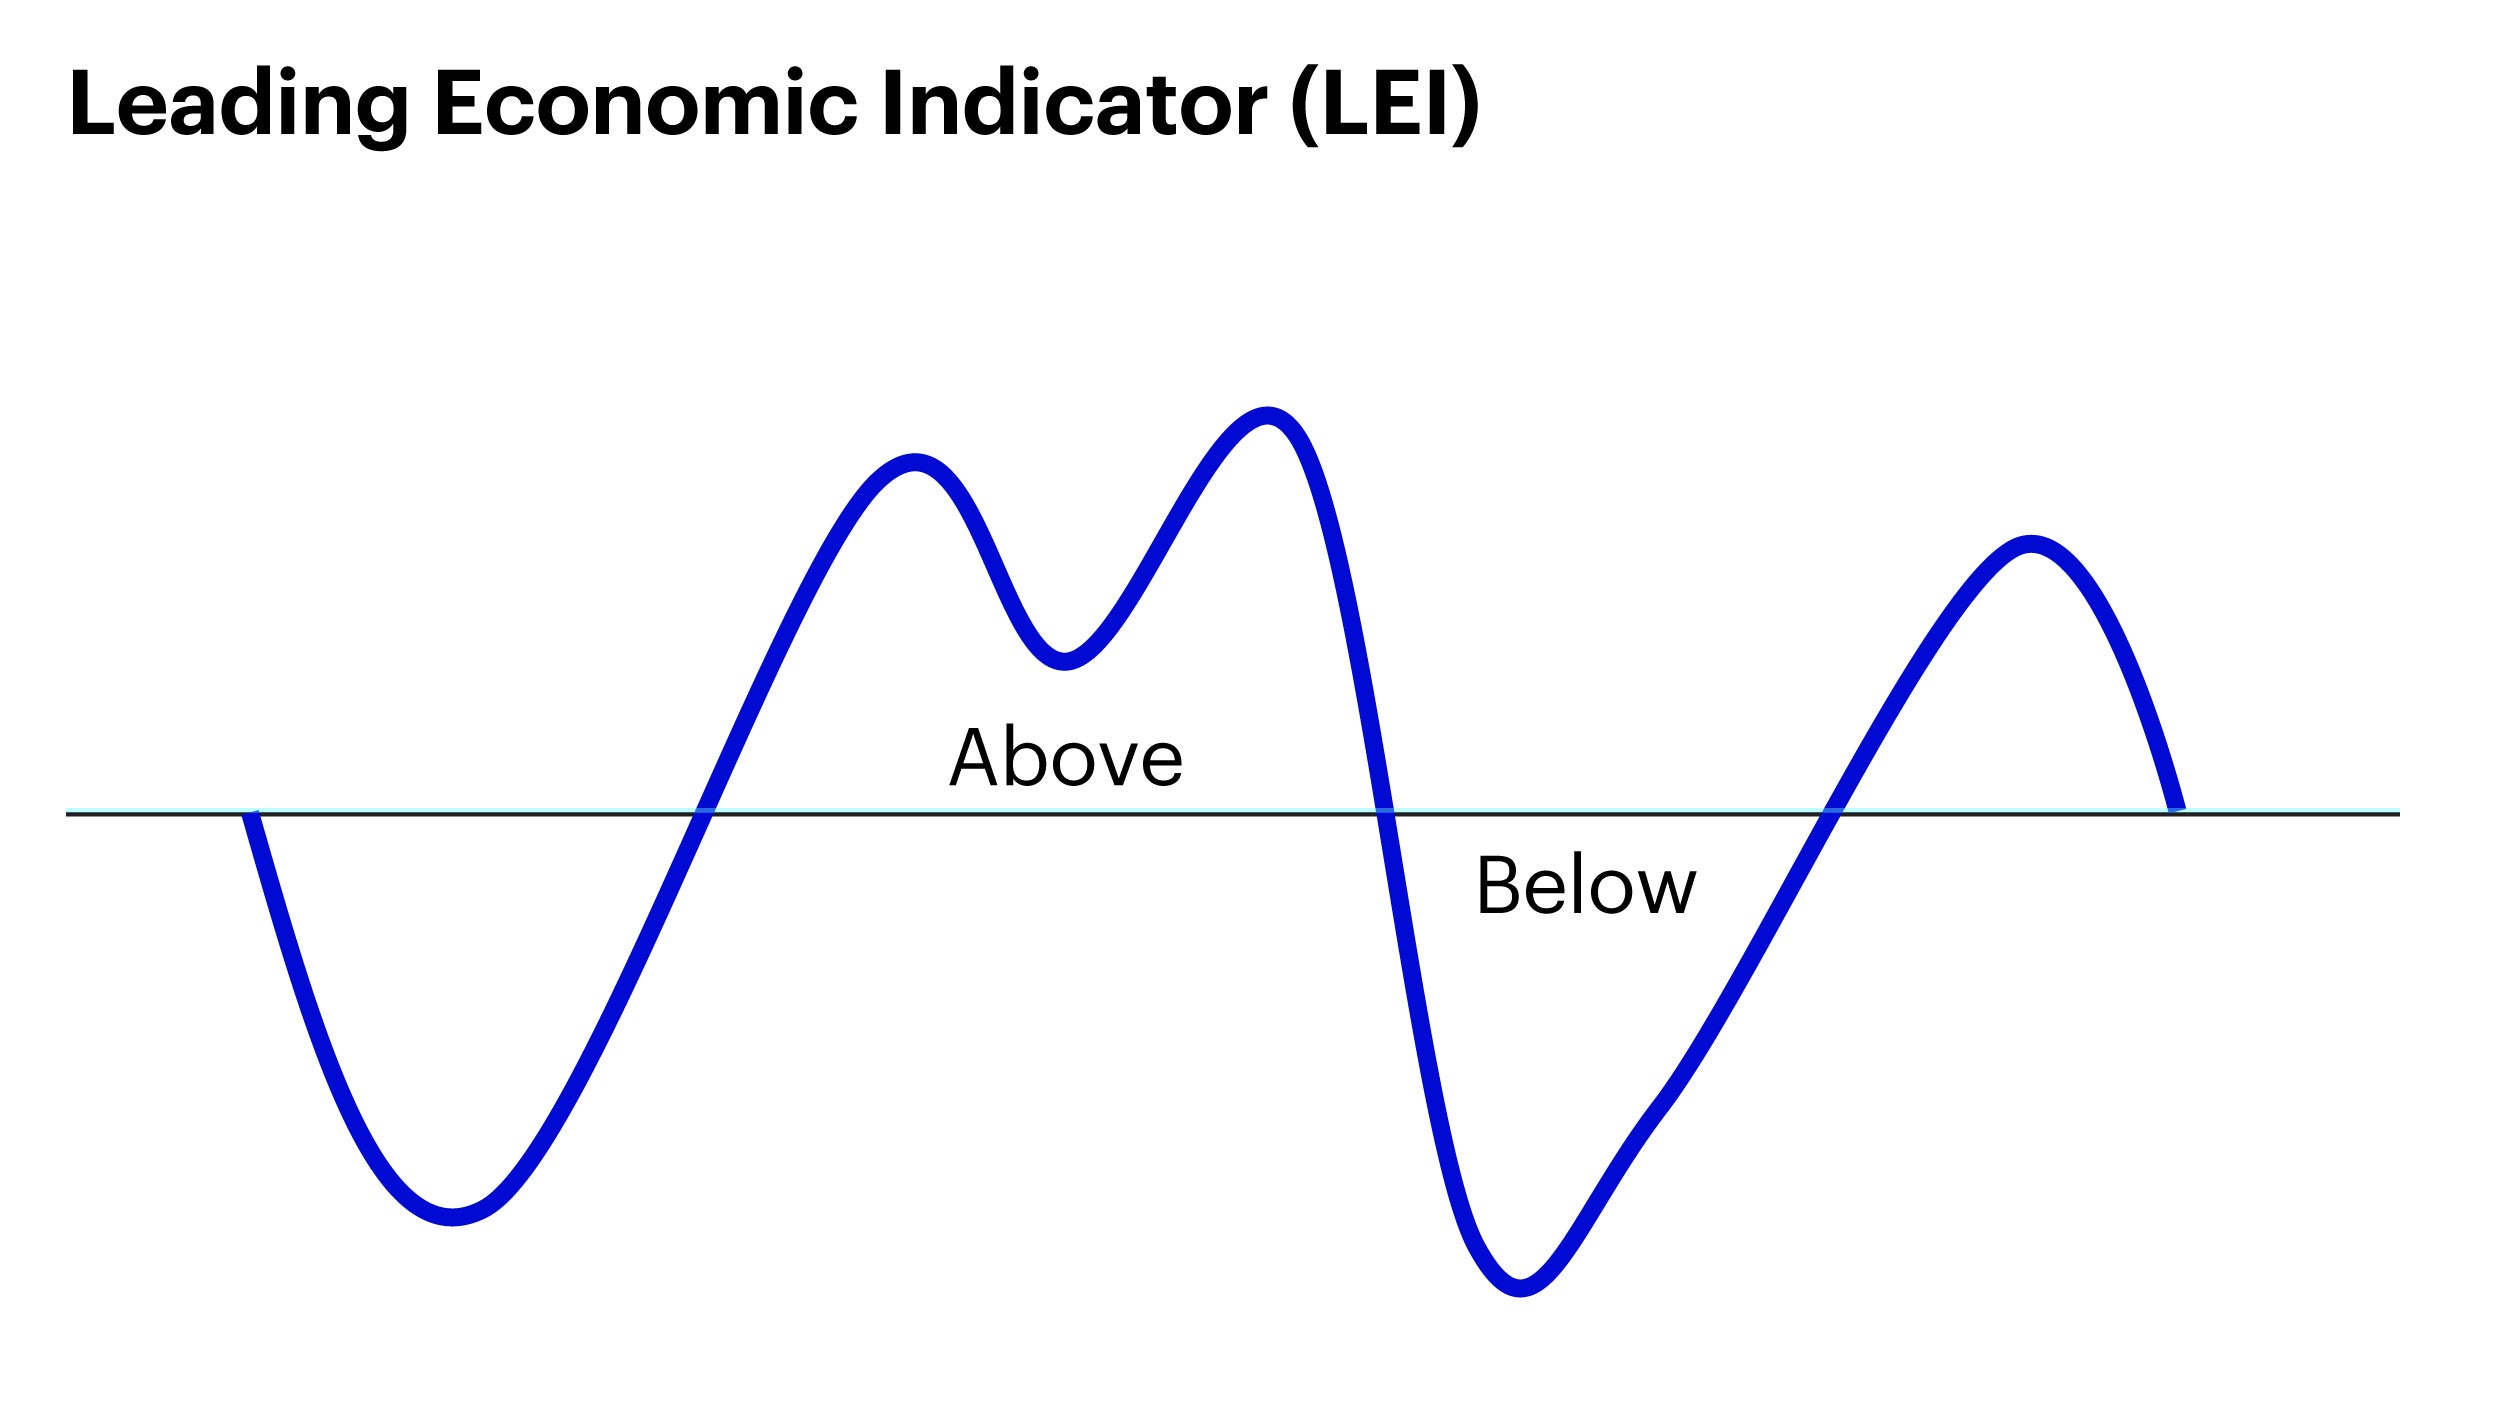
To capture the breadth of the cycle rather than relying on one specific industry or indicator, we equally weight 7-10 local indicators (region dependent) across five broad categories to create one composite leading indicator. Specifically, this Leading Economic Indicator (LEI) aims to measure the expected level of economic activity – above or below – its long-term trend.
The ability of our framework to boost its predictive power is enhanced by incorporating a second indicator that seeks to estimate future directional changes in economic growth from cyclical fluctuations in global risk appetite. While strongly correlated, the two measures often behave differently, as investor confidence is influenced by other factors not directly related to the economic cycle.
Above/below long-term trend
Forward-looking measure of the level of economic activity
Equally weighted composite of:
- Manufacturing activity/business surveys
- Consumer sentiment surveys
- Monetary/financial conditions
- Housing/construction activity
- Labor market activity
Global Risk Appetite Cycle Indicator (GRACI)
Our research indicates a high correlation between risk sentiment and changes in economic growth expectations with the premise that financial markets contain information about future economic activity, as market participants discount information affecting future fundamentals in real time. Notably, asset prices can reflect a broader set of fundamental news, such as changes in monetary conditions, fiscal policy announcements, corporate news, global financial shocks, etc. While these fundamental drivers affect economic activity with a lag, market participants continuously revisit their economic outlook and adjust their propensity to take risk accordingly.
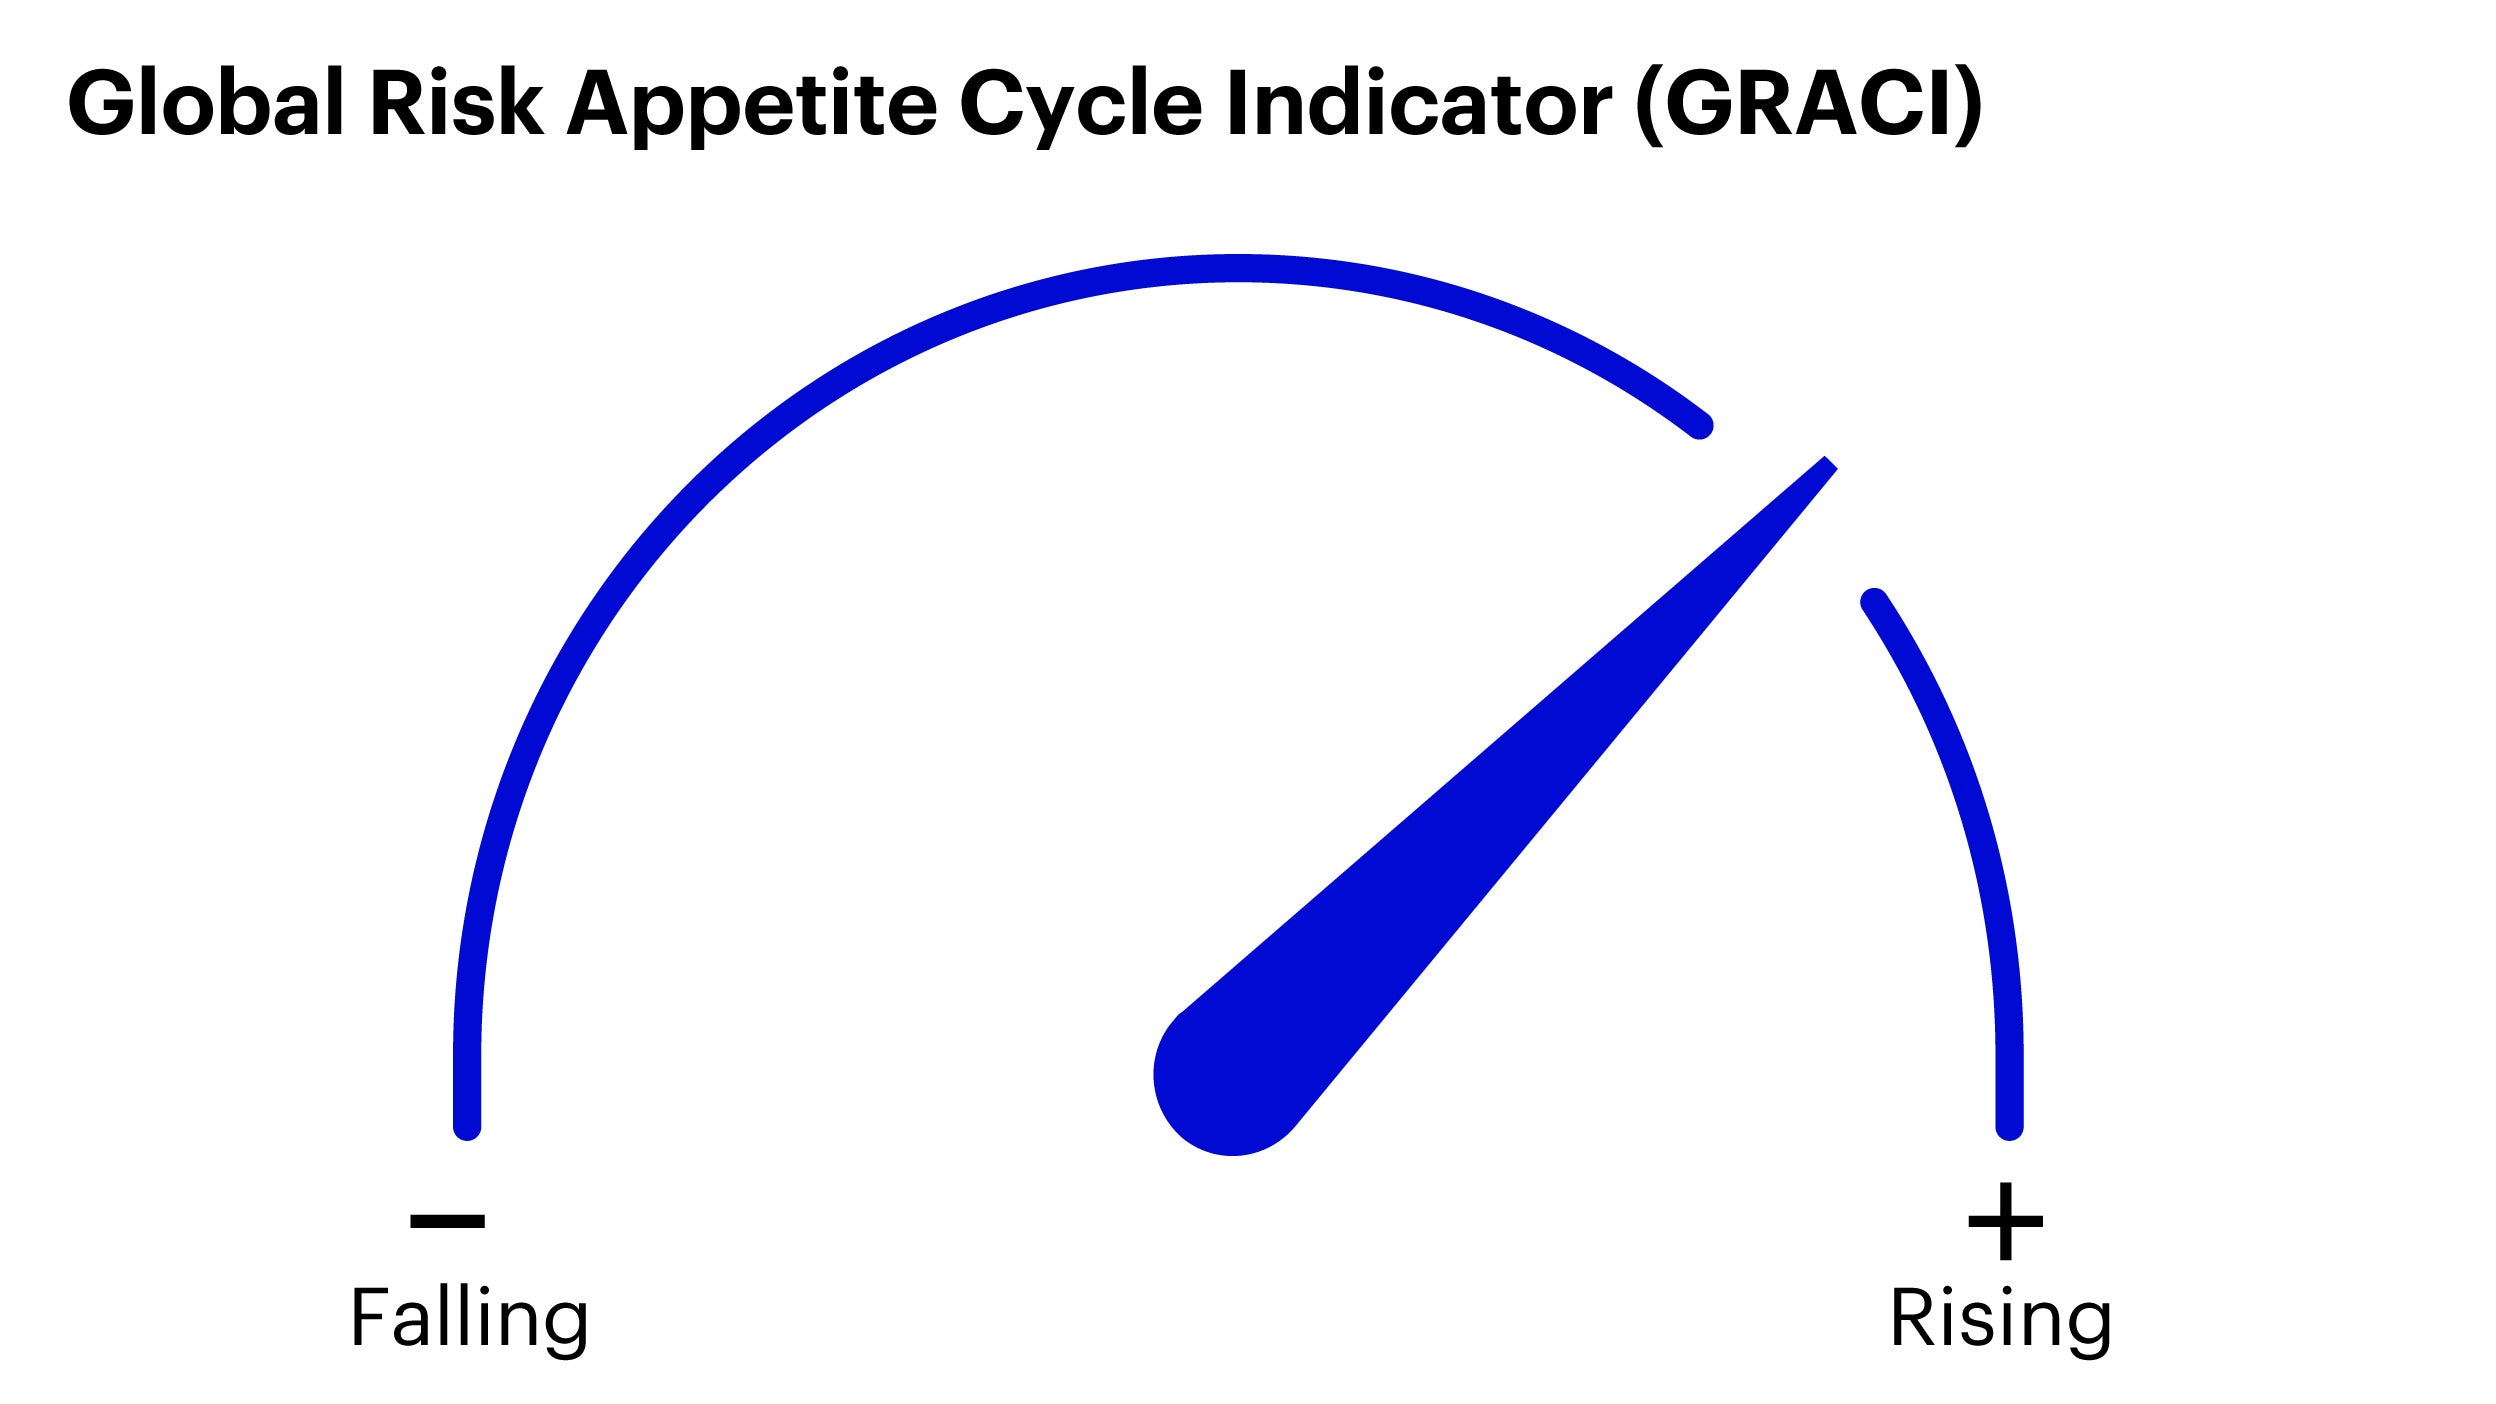
Our Global Risk Appetite Cycle Indicator (GRACI) seeks to capture this predictive signal by measuring relative risk-adjusted performance between riskier and safer asset classes (e.g., equities vs. government bonds) as measured by an equally weighted composite of approximately 80 global total return indexes. This data is used to understand if economic growth is rising or falling, completing the picture of where we are in the economic cycle.
Rising/falling growth
Measure of the market’s risk sentiment, strongly correlated with changes in economic growth expectations
Equally weighted asset universe:
- Country-level total return indexes across equity, credit and fixed income markets
- Developed and emerging markets
Predictive power
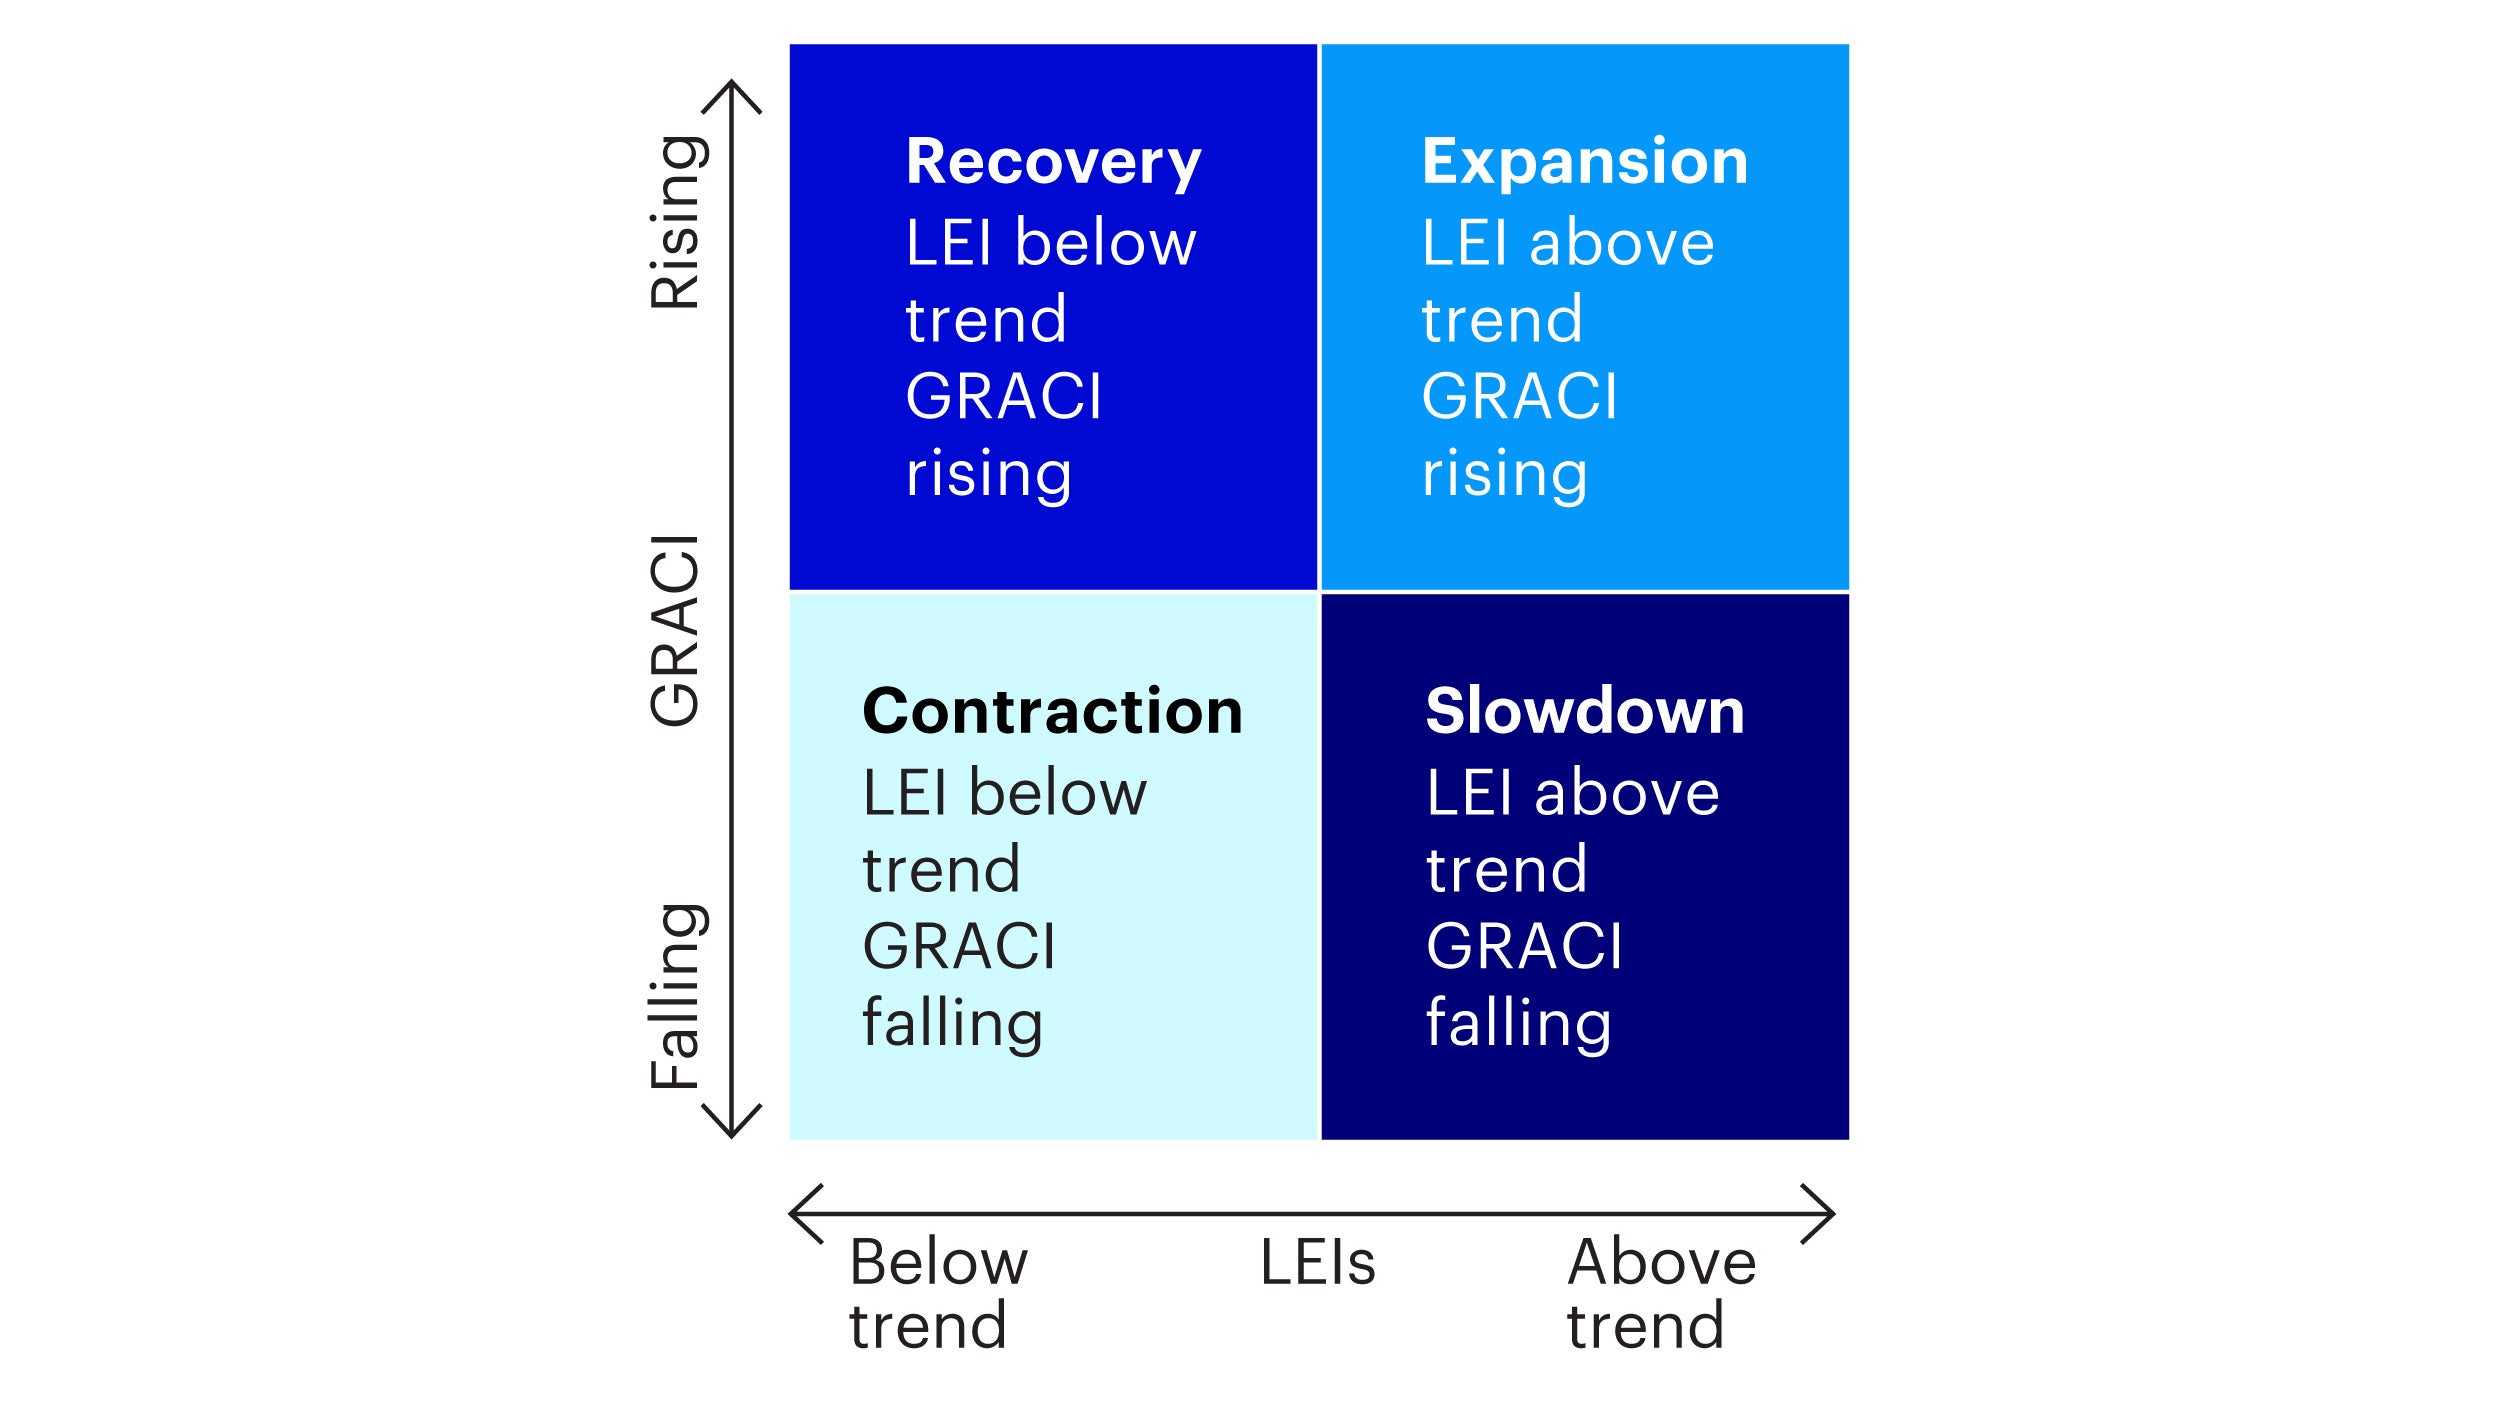
The combined signals from LEI and GRACI align to one of four economic growth environments (i.e., “macro regimes”), which guide investors to position their portfolios to take advantage of the cyclicality of assets.
The output of our US-based model is illustrated in the graphic below, where estimated macro regimes are plotted through time, and visually compared to realized US real GDP growth suggesting the predictive content of this model-based regime classification versus directional changes in realized GDP growth.
Model-predicted business cycle regimes versus realized GDP growth
Source: US GDP from the Bureau of Economic Analysis. Sample data period: January 1989 - December 2021. Business cycle regimes are computed by the authors, based on the composite business cycle regime model, using a combination of US leading economic indicators and global risk appetite indicator. US GDP data do not contribute to the calculation of the regimes, and they are illustrated for reference purposes only. Sample time-period dictated by data availability.
Since 1989, the National Bureau of Economic Research (NBER) has declared four US economic recessions, which correspond to the bottoms in US Real GDP growth which are plotted on the graph. These four turning points reflect the beginning of the subsequent economic cycle. The Invesco Macro Regime Framework’s predictions for an economic contraction and subsequent recovery are reflected in the table, corresponding to these dates.
Last four US economic recessions as indicated by the NBER1
| Date range | Invesco Macro Regime identifies a Contraction | Invesco Macro Regime identifies a Recovery, signaling a new economic cycle |
| July 1990 – March 1991 | April 1990 | April 1991 |
| March 2001 – November 2001 | February 2001 | June 2001 |
| December 2007 – June 2009 | December 2007 | February 2009 |
| February 2020 – April 2020 | February 2020 | June 2020 |
Applying the framework to a single asset class
As asset allocators, it is imperative that any framework is applicable to real-world portfolio construction decisions. The macro regime framework outlined in this paper provides investors with a monthly signal that distills the breadth of the global economy into actionable insights to allocate within public equities across the four stages of the business cycle.
Public equities remain a significant source of portfolio risk and return, making their allocations a key driver of portfolio outcomes. Given the cyclicality of factors, equity allocations can benefit from adopting a regime-based framework to rotate into cyclical (defensive) stocks as markets reward (penalize) risk taking. Our research further identified that factor investing, a taxonomy for fundamental stock characteristics, is an efficient way to gain exposure to the cyclicality of equities.
Why factors?
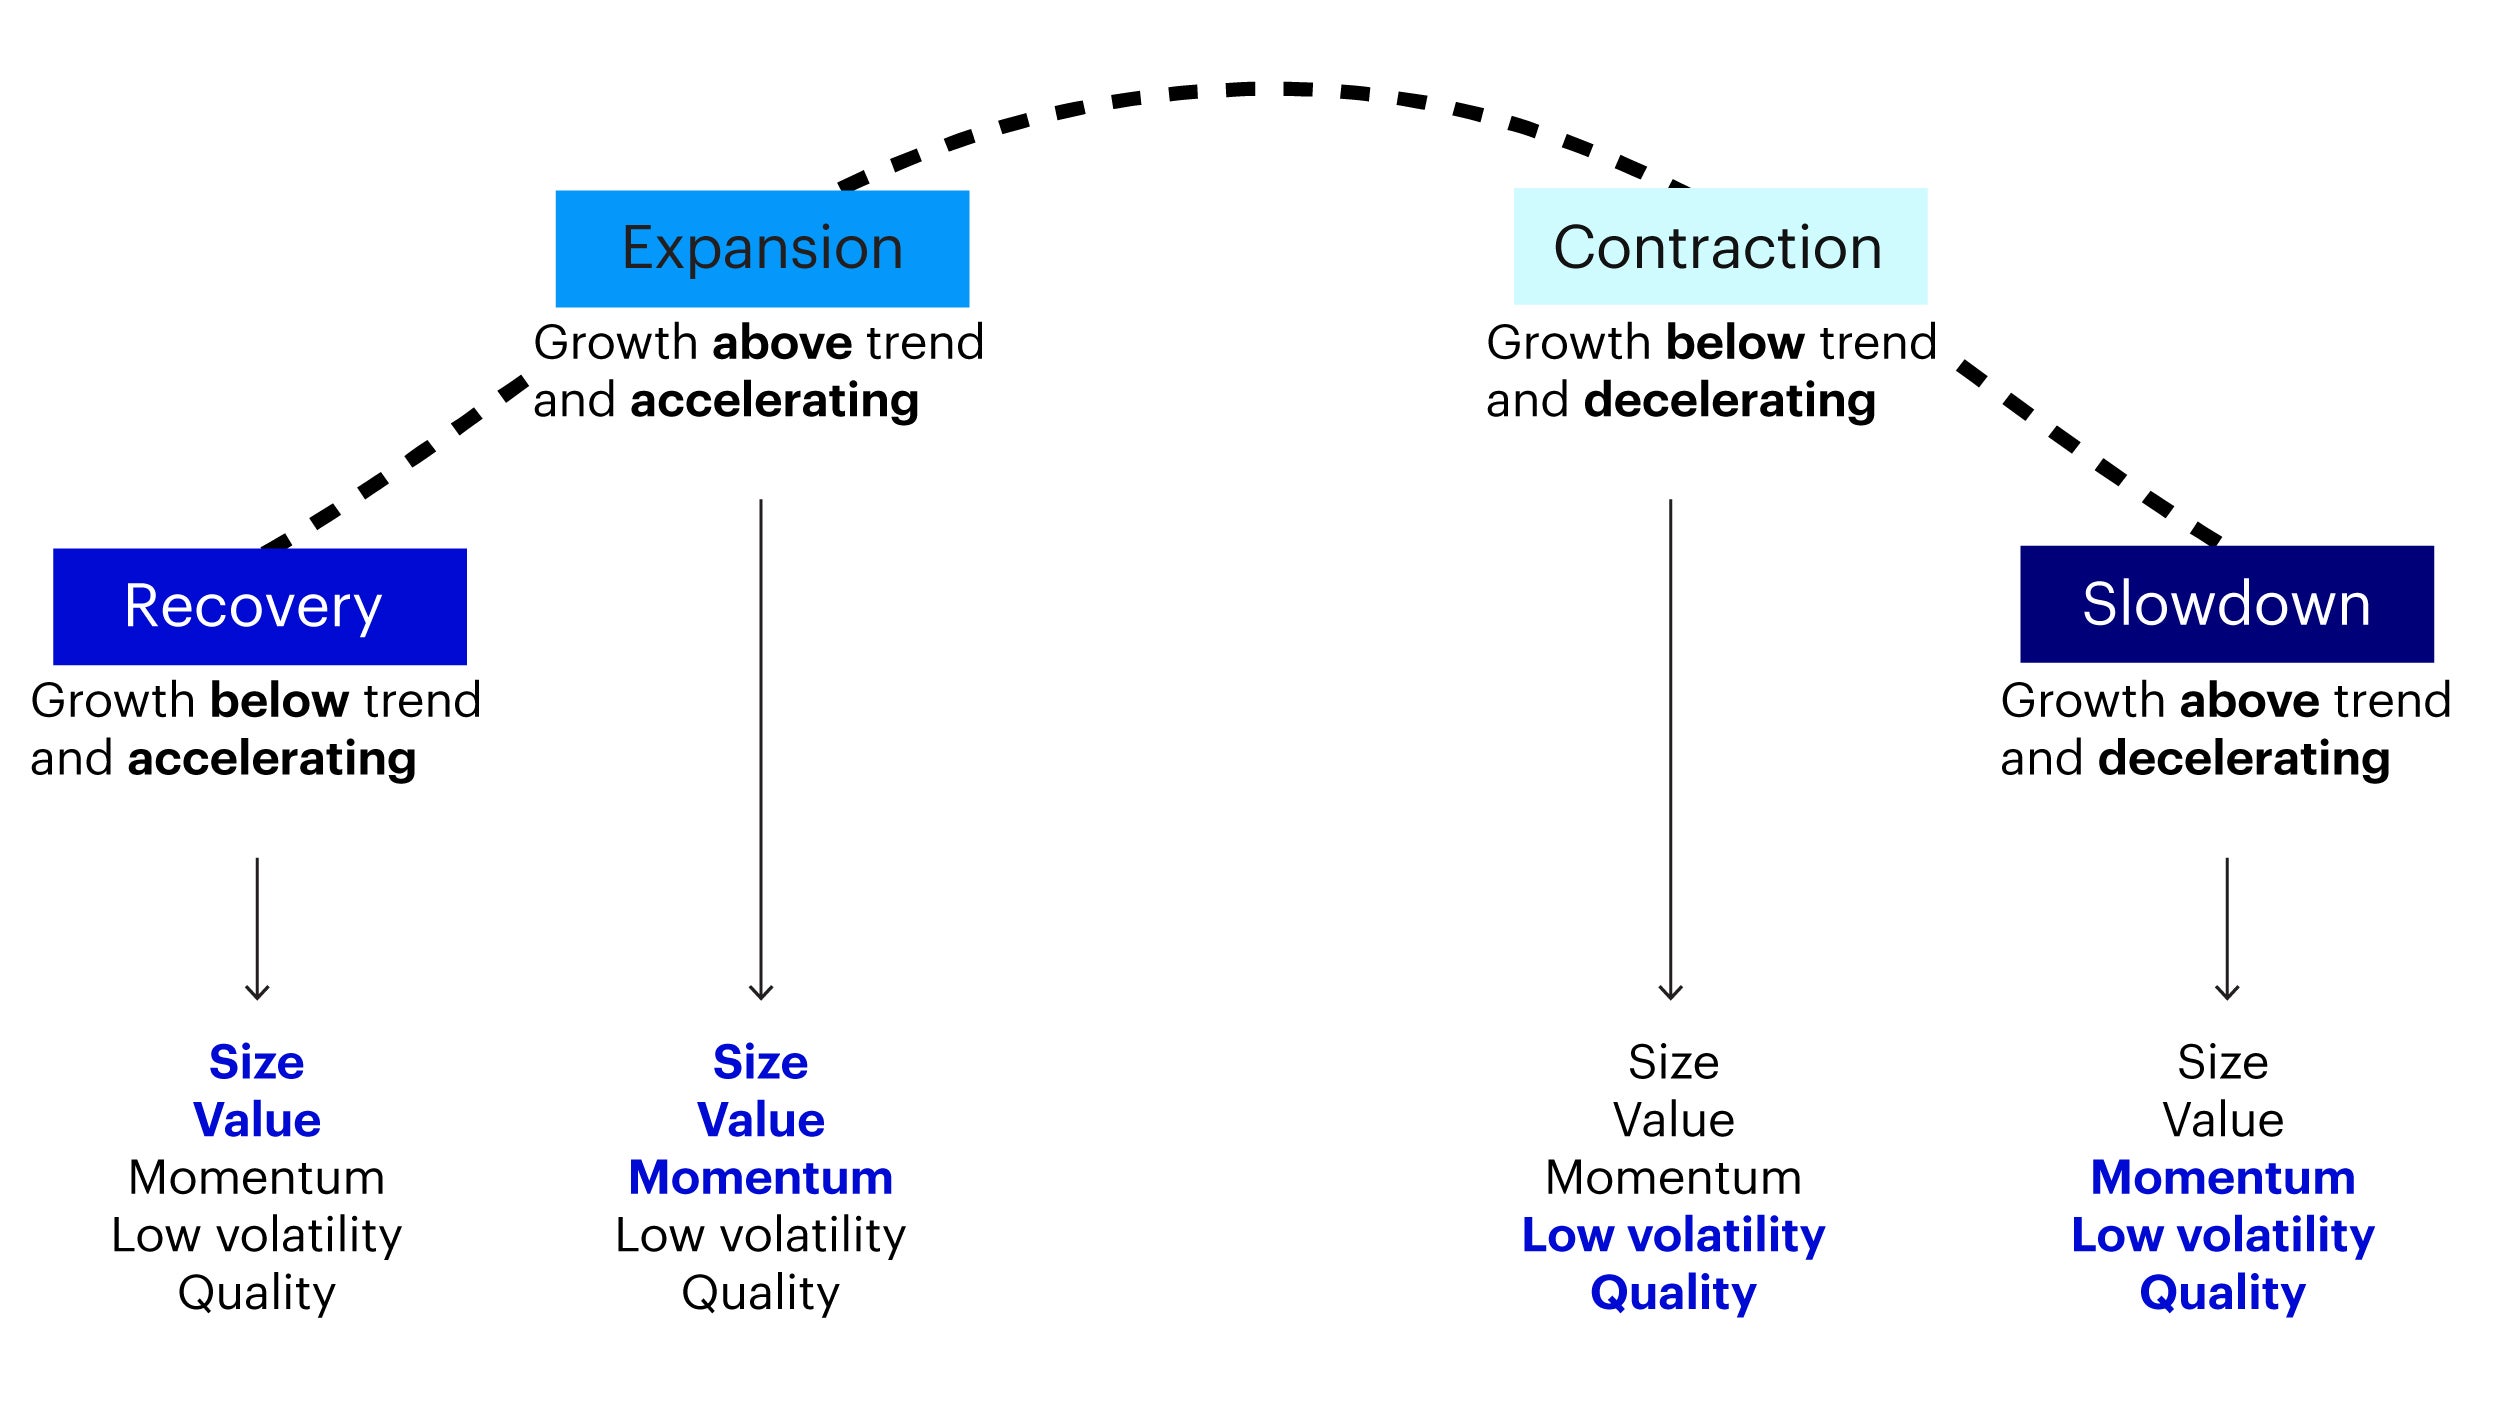
Industry research supports that style factors can be used to classify the fundamental characteristics of stocks, or more blatantly put, exploit their economic sensitivities. The understanding that specific drivers of risk will be rewarded at various stages of the business cycle is a key philosophy of our Dynamic Multifactor (DMF) approach. Based on the identified regime from the LEI and GRACI signals, DMF tilts towards historically rewarded equity factors as indicated in the chart.
Macro regimes framework
Source: Invesco Solutions. For illustrative purposes only.
Factor cyclicality
- Size and value tend to be cyclical, with higher operating leverage and more reliance on external funding
- Quality and low volatility tend to be defensive, with lower operating leverage and more reliance on internal cash flows
- Momentum is more transient, and tends to perform well in later stages of cyclical upturns and downturns
Attractive investment results with risk mitigation properties
Allowing public equity allocations to dynamically adjust in order to navigate macro-economic risks, while residing within policy, can be the impetus for better investment results.
Invesco’s Dynamic Multifactor approach aims to outperform the market-cap-weighted benchmark index over a full market cycle.2 This may be attributed to rotating into defensive positioning during times of decreasing risk appetite and into pro-cyclical positioning during times of increasing risk appetite.
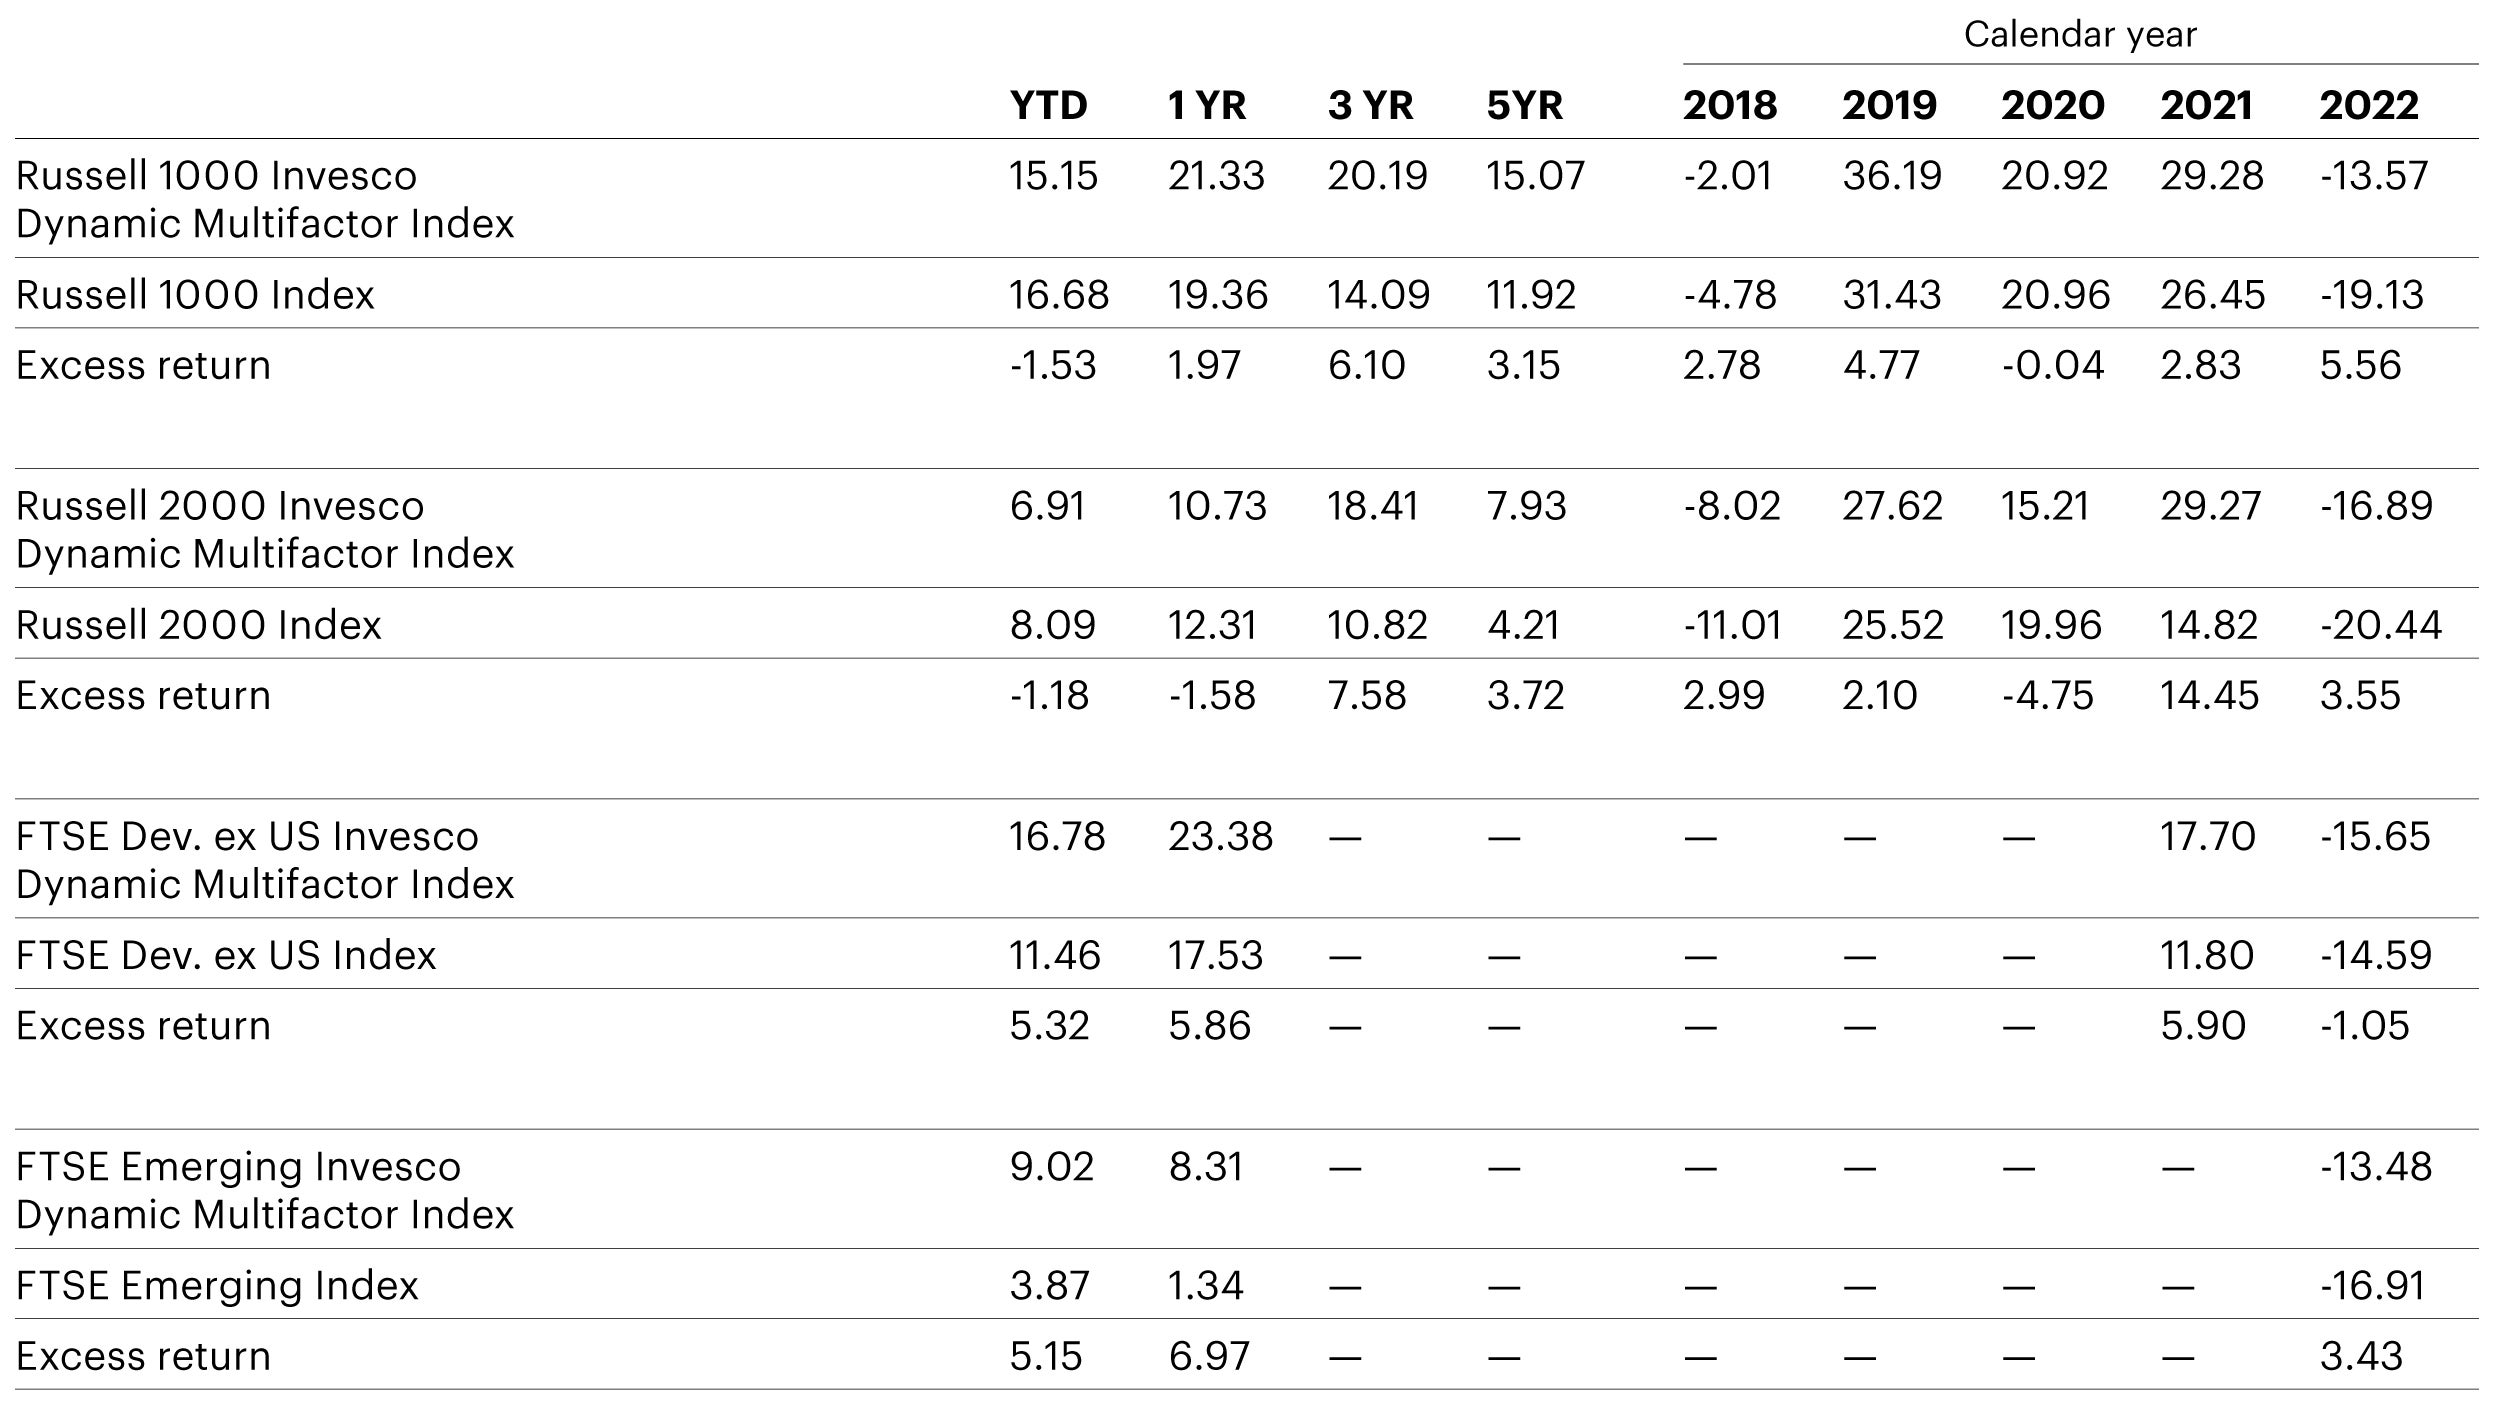
Source: Morningstar as of 6/30/2023. Past performance does not guarantee future results. Russell 1000 Invesco Dynamic Multifactor Index and Russell 2000 Invesco Dynamic Multifactor Index incepted on 10/13/2017. FTSE Developed ex US Invesco Dynamic Multifactor Index incepted on 8/17/2020. FTSE Emerging Invesco Dynamic Multifactor Index incepted on 1/29/2021. All index returns do not represent strategy returns. An investor cannot invest directly in an index.
Summary
Invesco’s macro regime framework acknowledges that markets are complex and seeks to alleviate investor’s short-term asset allocation decisions through a dynamic and flexible framework to weather the next bout of volatility or opportunity, wherever and whenever that may be.


Monthly Macro Regime updates
Sign up to receive the monthly update on our Macro Regime framework.
By providing your details here you consent to receiving marketing materials which includes our newsletters and information from Invesco globally that we think maybe of interest to you (including direct marketing). You can withdraw your consent at any time by selecting the unsubscribe option in the communication you receive or by contacting your regional sales representative. For further information on how we store and use data, please refer to our Privacy Policy.


