Diversifying traditional 60/40 portfolios: Emerging market debt

This is the fourth of a four-part blog series on diversifying 60/40 portfolios in the current macroeconomic environment. Traditional 60/40 portfolios are no longer delivering the returns investors were used to over the last decade. Our first blog outlined how rising interest rates have created long-term opportunities for investors to deploy public and private credit in 60/40 portfolios. In our second blog we covered the opportunities that exist in senior loans. The third piece looked at the diversification advantages of core fixed income. This final blog covers the merits of emerging market (EM) debt.
As we engage investors globally, but particularly in Asia, portfolio income remains paramount. However, as the topic of this conversation series implies, our focus is also to integrate diversified sources of income into a portfolio to augment an investor’s core outcomes. Through our robust capital markets assumptions research, we analyze more than 50 fixed income asset classes, across the credit, duration, and geographic spectrum. One asset class that we think has become an integral portfolio building block is emerging market debt. This asset class is unique in its market structure and issuer base as compared to other fixed income asset classes, and we believe it is essential to understand how this impacts the way we make allocation decisions.
Continued uncertainty around global monetary policy and the future path of inflation have forced investors to consider additional levers previously not thought of during the period post-2011 until the onset of the Covid-19 pandemic where tepid inflation and stable growth were the norm. We often engage investors on the topic of emerging market debt, but the complications of the asset class can sometimes lead to conflation of key matters around expected risk and return.
In unpacking the emerging market debt asset class it’s important to consider that it stretches across both investment and non-investment grade spectrum, hard and local currency issuances, and multiple geographies including Asia, Eastern Europe, Middle East, Latin America, and Africa. There are even different security types, such as traditional coupon-bearing bonds, and sukuks, which technically qualify as asset ownership to meet the needs of Shariah-compliant investors. We think it is essential for investors to understand this highly nuanced market, and most importantly how each subcomponent impacts the return, risk, and income potential of investment portfolios.
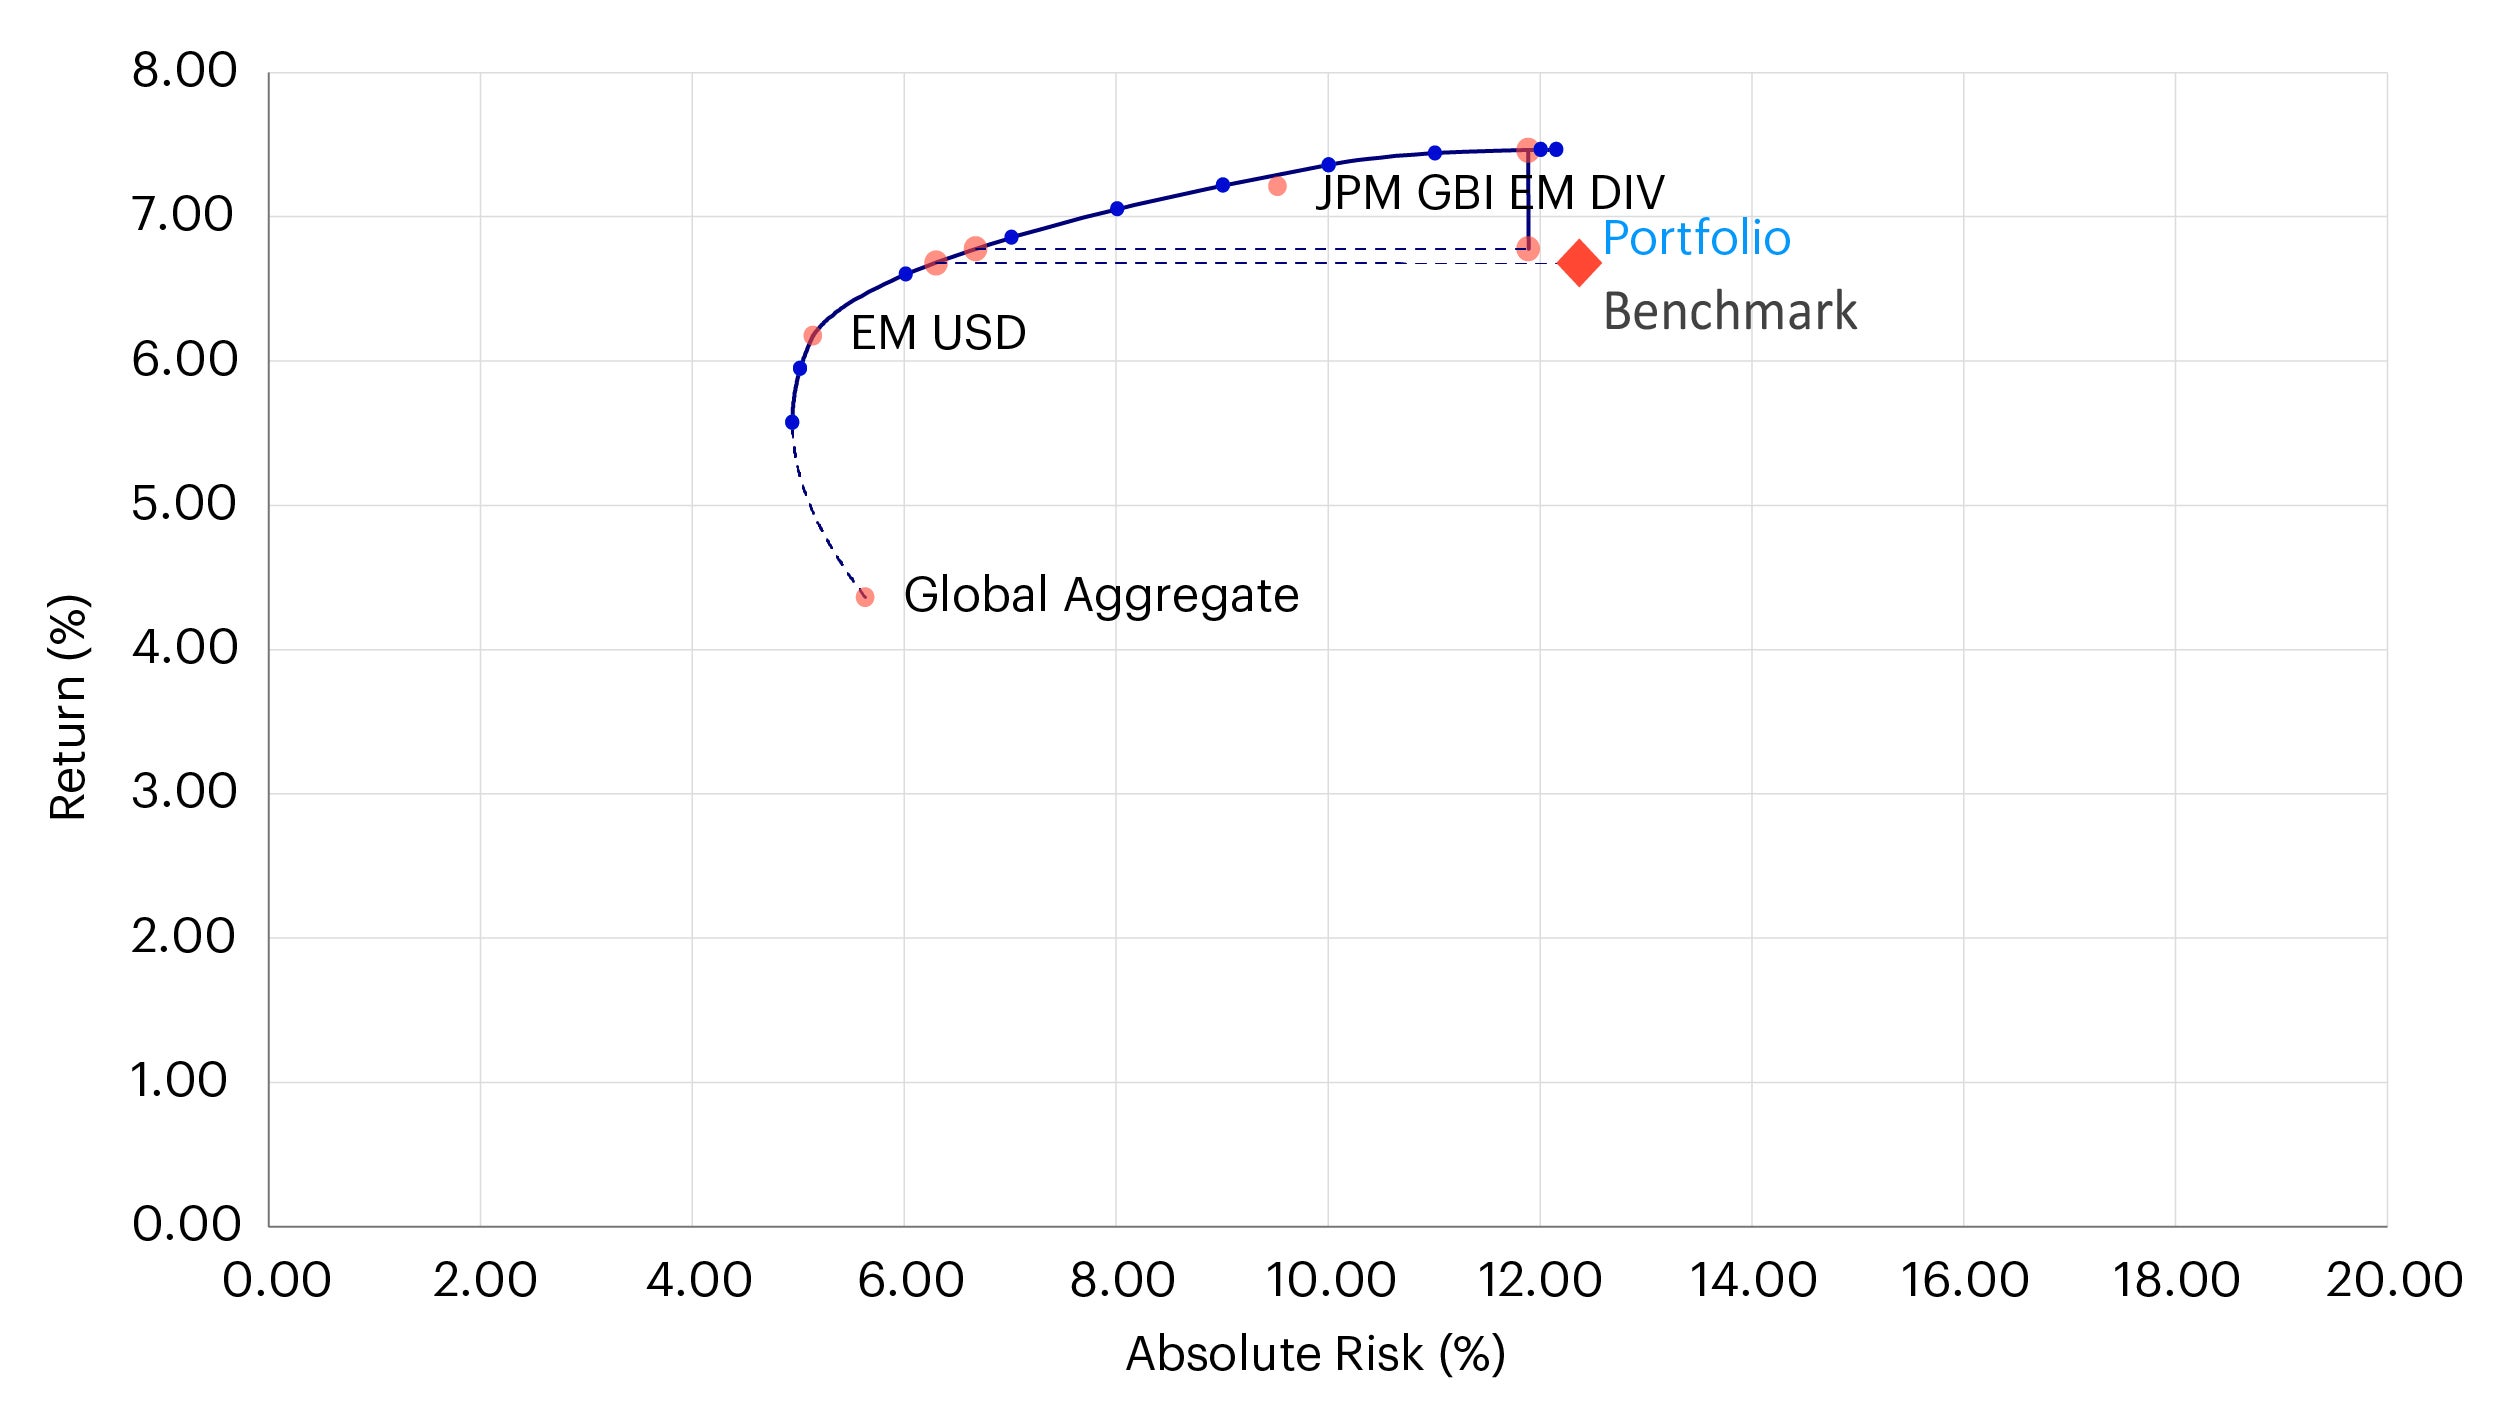
In prior blogs, we thought about asset classes by utilizing the Invesco Vision portfolio analytics tool, which we’ll continue to do for the purposes of this discussion. In our analysis, we look at both hard (i.e., US dollar) and local-currency denominated building blocks and consider the impacts on a traditional “60/40” portfolio.

Source: Invesco Vision, data as of 28 February 2023. Return estimates are based on the Q1 2023 Long-Term Capital Market Assumptions. These estimates are forward-looking, are not guarantees, and they involve risks, uncertainties, and assumptions.
| Portfolio 1 | Portfolio 1 | Portfolio 2 |
| Composition | 70% Global Equities + 30% Global Core Fixed Income | 5% Global Bonds + 25% Global High Yield + 5% Hard Currency EM Debt + 5% Local Currency EM Debt |
| Return (%) | 6.6 | 6.8 |
| Absolute Risk (%) | 12.3 | 11.8 |
Source: Invesco Vision, data as of 28 February 2023. For illustrative purposes only. There can be no assurance that any estimated returns or projections can be realized.
You will notice that the above analysis incorporated US dollar and local currency-denominated emerging markets debt at an equal level, for the illustrative purposes of the analysis. We also funded the investment equally both from equity and fixed income. In practice, we could typically employ an allocation driven by the client’s targeted investment outcomes, our long-term capital market assumptions, and tactical asset allocation views. However, looking at the analysis makes clear that employing emerging market debt, even at a 10% level, both reduces risk and increases expected return of the original “60/40” portfolio.
What are the fundamental return and risk differences between hard and local currency EM debt?
Given local currency EM debt has exposure to several underlying currencies, which are often riskier than hard currencies such as US dollar, this does add incremental risk versus hard currency debt. In terms of how much, we discuss below with outputs from Vision.
| Local currency debt | Hard currency (USD) debt | |
| CMA Return (%) | 7.2 | 6.2 |
| CMA Risk (%) | 9.5 | 5.1 |
Source: Invesco Vision, data as of 28 February 2023. For illustrative purposes only. There can be no assurance that any estimated returns or projections can be realized.
While it might be tempting to focus on hard currency EM debt simply due to the risk-reward balance, we view local currency EM debt as a key building block, as its diversification potential and equity-like return expectation (global equity expected return is also 7.2%), allow an investor to use both local and hard currency exposure to fund the allocation from equity and fixed income, as mentioned above, and improve both risk and return in the process. Overall, we see both as important tools in helping clients achieve core objectives.
What about inflation?
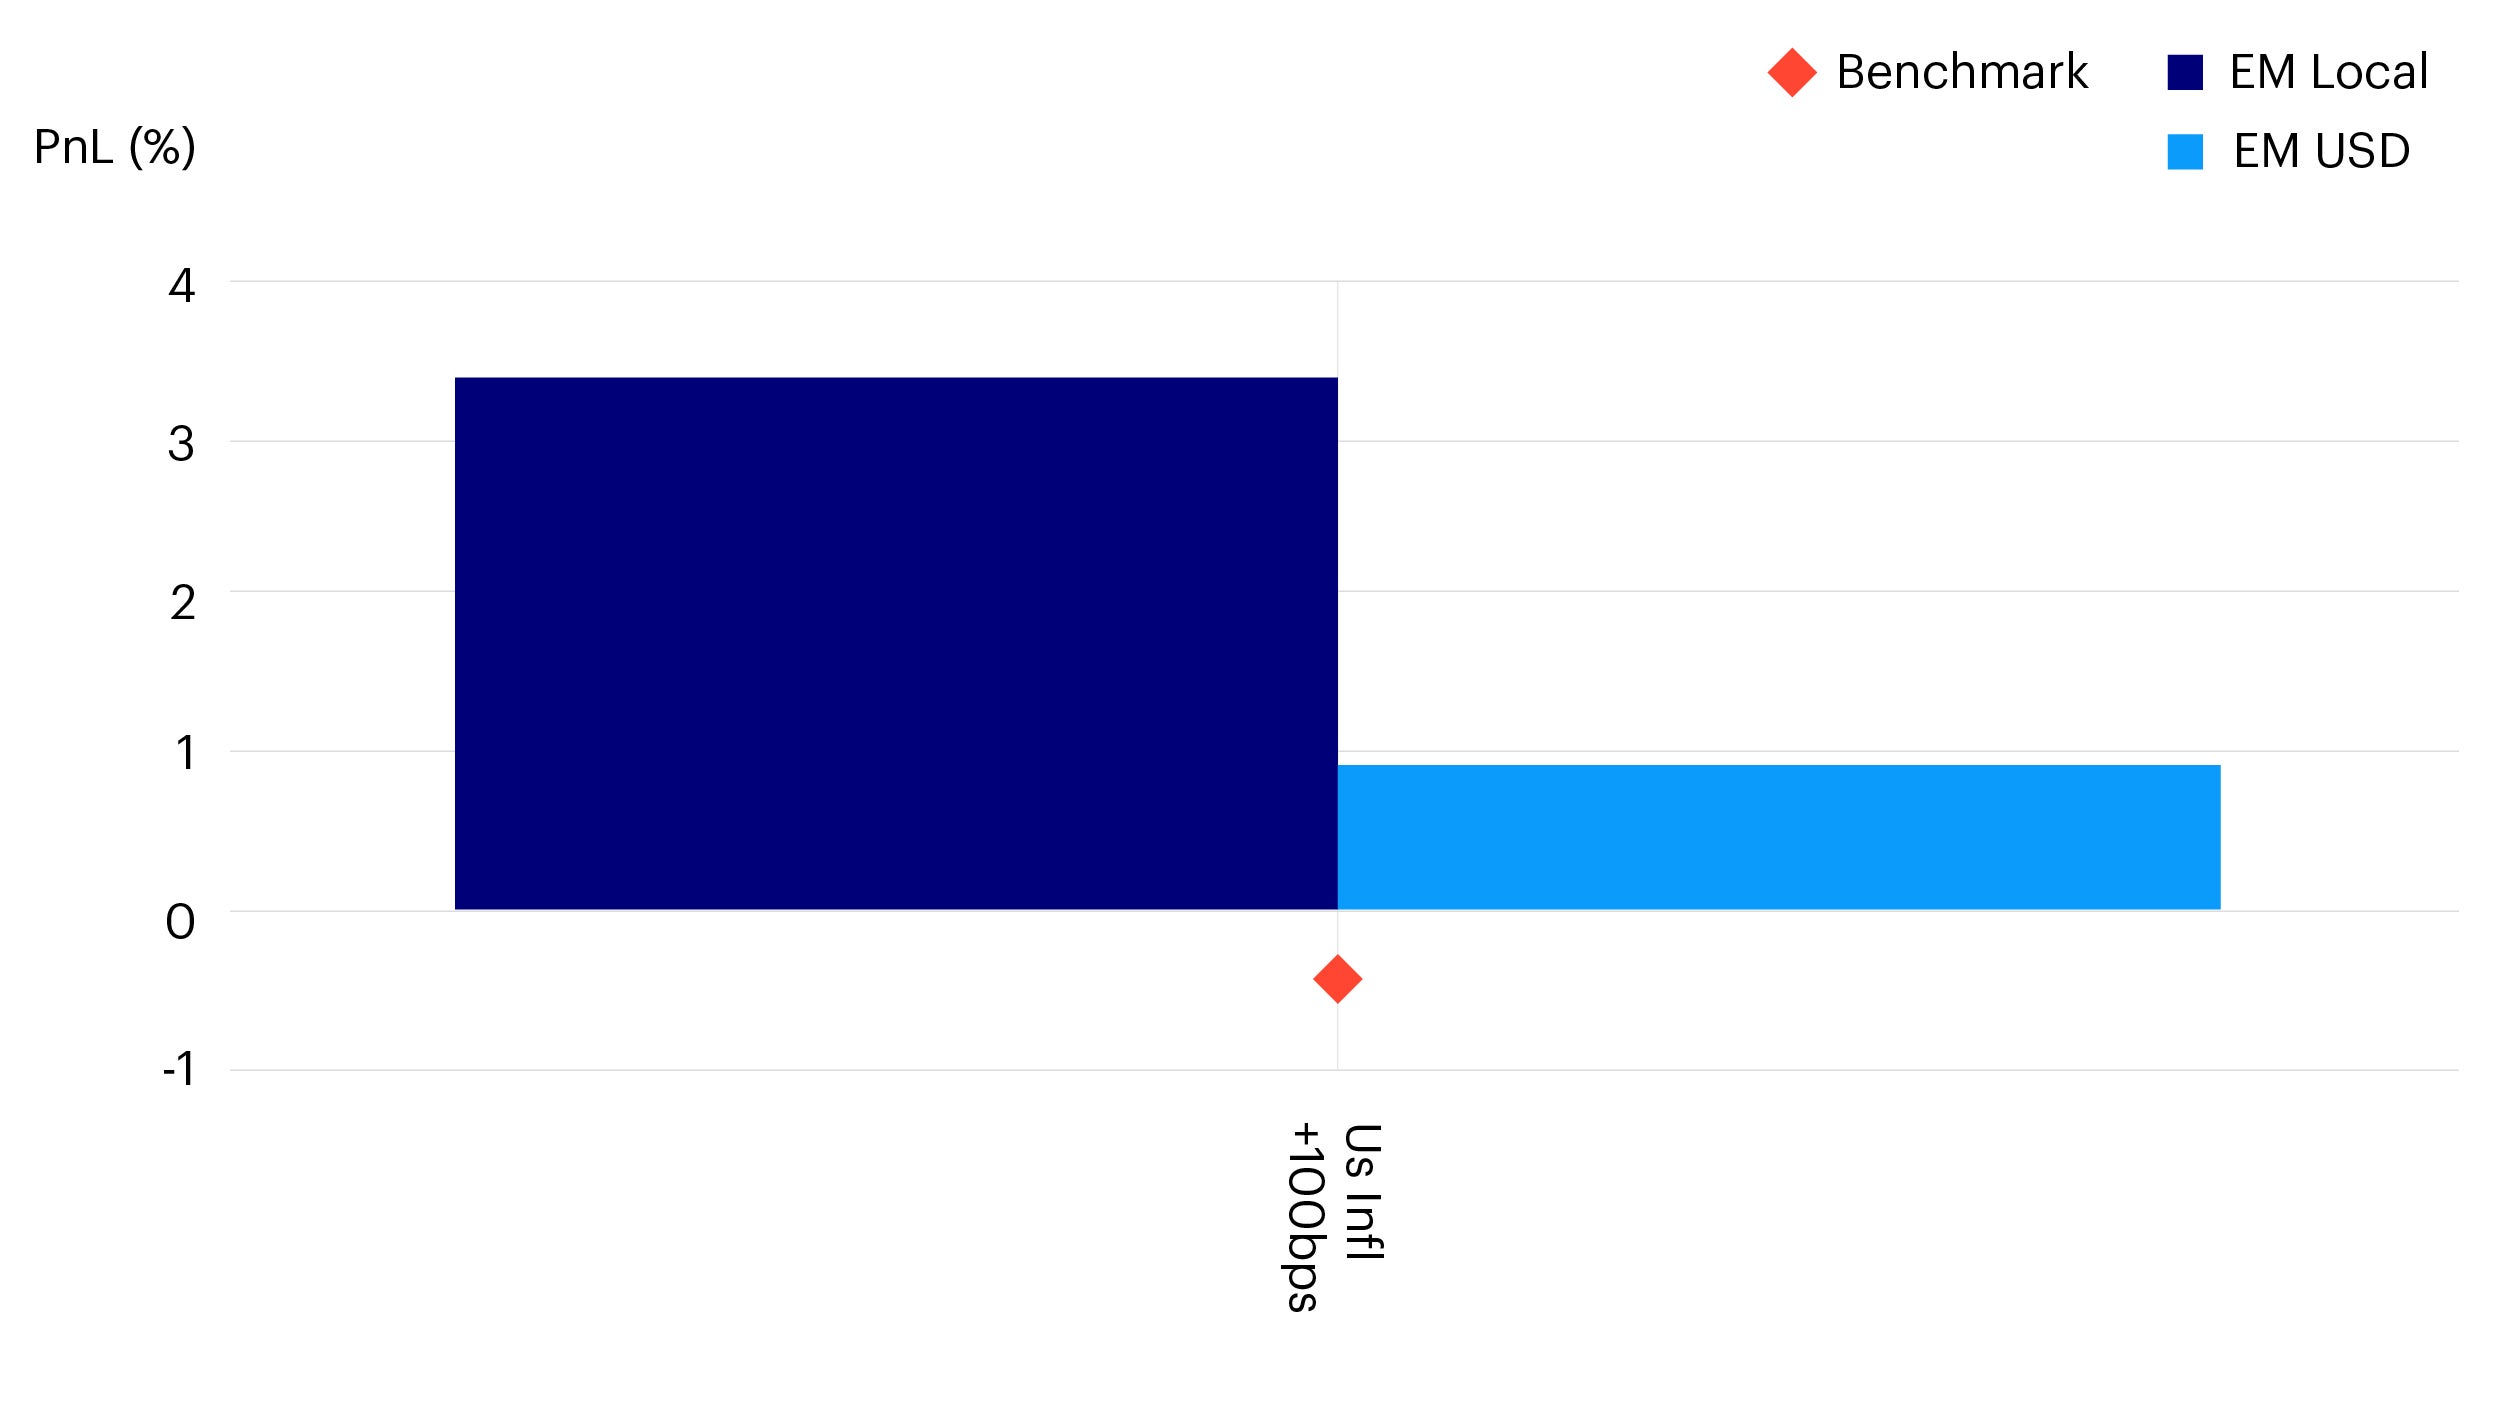
Further elaborating the need for both options, we considered how each behave in an inflationary environment, versus global bonds.

Source: Invesco Vision, data as of 28 February 2023. For illustrative purposes only. There can be no assurance that any estimated returns or projections can be realized.
While both local and hard currency EM debt have improved inflation mitigation properties as compared to the benchmark (i.e., global core bonds), the local currency building block intuitively reacts much more favorably to a U.S. Consumer Price Index shock than the hard currency version. So, while hard currency EM debt does have lower volatility, there are specific regimes where owning local currency EM debt provide substantial benefits, in addition to overall higher expected returns.
In sum, we believe that continuing to expand the investment opportunity set will benefit investors in a more challenging environment. This includes emerging market debt and its multiple subcategories, which can improve the portfolio across multiple dimensions – return, risk, and income. However, it’s important to consider the nuances of this asset class and how it can be a multi-faceted precision tool to achieve investment objectives if deployed efficiently. Given the geographic and issuer level divergence across the space, it’s also worth considering actively managed solutions, which allow for managers to make both market and security-level decisions to avoid unintended risks and harvest unique opportunities. It’s also worth considering additional custom approaches, as Asian investors often have more EM debt exposure than their U.S. or European counterparts, but typically concentrated in their local or regional market. This necessitates an approach that diversifies local and regional exposure and doesn’t create unintended concentration.
Investment risks
The value of investments and any income will fluctuate (this may partly be the result of exchange rate fluctuations) and investors may not get back the full amount invested.
When investing in less developed countries, you should be prepared to accept significantly large fluctuations in value.


