The Big Picture - Global Asset Allocation 2022 Q2

Key takeaways
The year started with central banks turning hawkish, followed by Russia’s invasion of Ukraine, both of which destabilised financial markets. Many cyclical assets are now cheaper than when we last wrote and we are adding to equities within our Model Asset Allocation (going Overweight). Given the uncertainties, we wish to maintain some balance and have also added to investment-grade (IG) taking it to the maximum allowed, while reducing real estate to Neutral and high-yield (HY) to Underweight. We maintain a regional preference for UK and emerging market (EM) assets.
Model asset allocation
In our view:
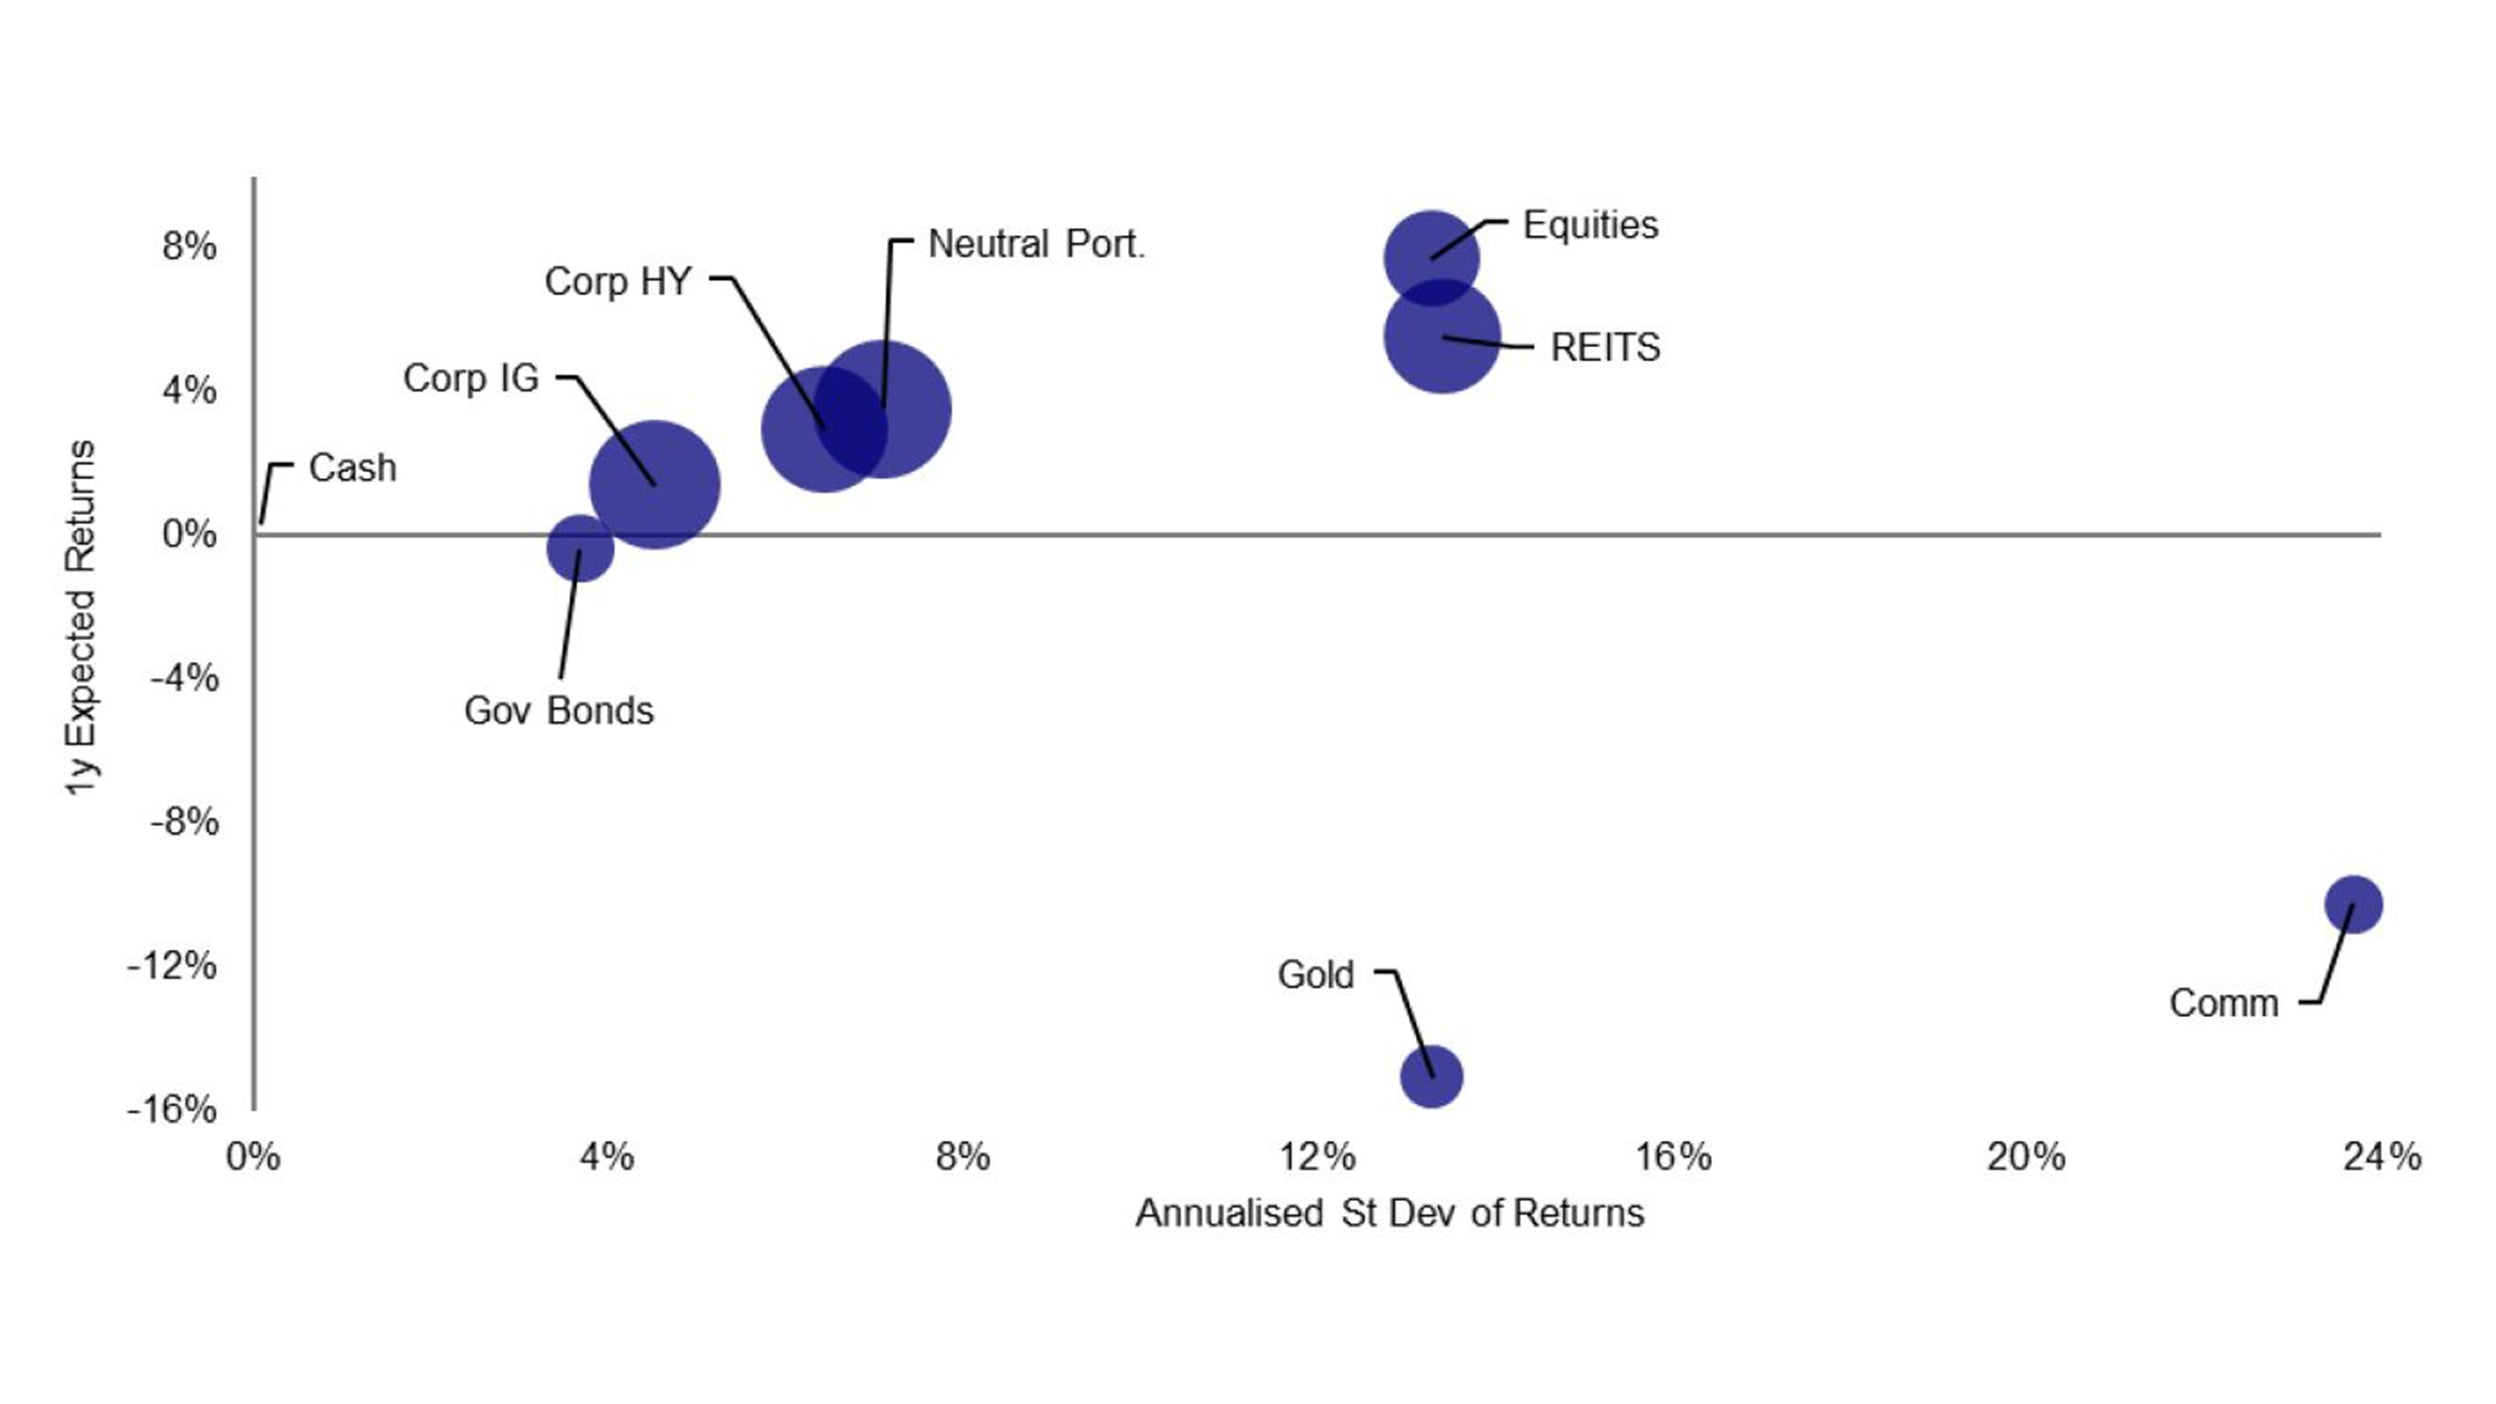
- Equities offer the best returns after recent losses. We go Overweight.
- Corporate investment-grade (IG) now benefits from higher yields. We increase to Maximum.
- Real estate (REITS) offers good returns but is no longer on the efficient frontier. We reduce to Neutral.
- Corporate high-yield (HY) may suffer higher defaults. We reduce to Underweight.
- Government debt outlook is improved but still negative. We remain at the Minimum.
- Cash returns are low but stable and de-correlated (it is our diversifier of choice). We stay at Maximum.
- Commodities have risen sharply and may consolidate lower. We remain at zero.
- Gold contains a geopolitical risk-premium and is threatened by rising yields. We remain at zero.
- Regionally, we favour the UK and EM (and are Underweight US assets)
Our best-in-class assets (based on 12m projected returns)
- UK equities
- EM real estate
- EM IG
- USD cash

Based on annualised local currency returns. Returns are projected but standard deviation of returns is based on 5-year historical data. Size of bubbles is in proportion to average pairwise correlation with other assets. Cash is an equally weighted mix of USD, EUR, GBP and JPY. Neutral portfolio weights shown in Figure 3. As of 9 March 2022. There is no guarantee that these views will come to pass. See Appendices for definitions, methodology and disclaimers. Source: BAML, MSCI, GSCI, FTSE, Refinitiv Datastream and Invesco


