Applied philosophy - The land of the rising prices

Eastern members of the European Union have been struggling with some of the highest levels of inflation in Europe. The last time a comparable inflationary surge happened was during the era of transition after the fall of communism in the 1990s. We compare the main drivers of inflation across the two periods and what that could imply for equities and government bonds.
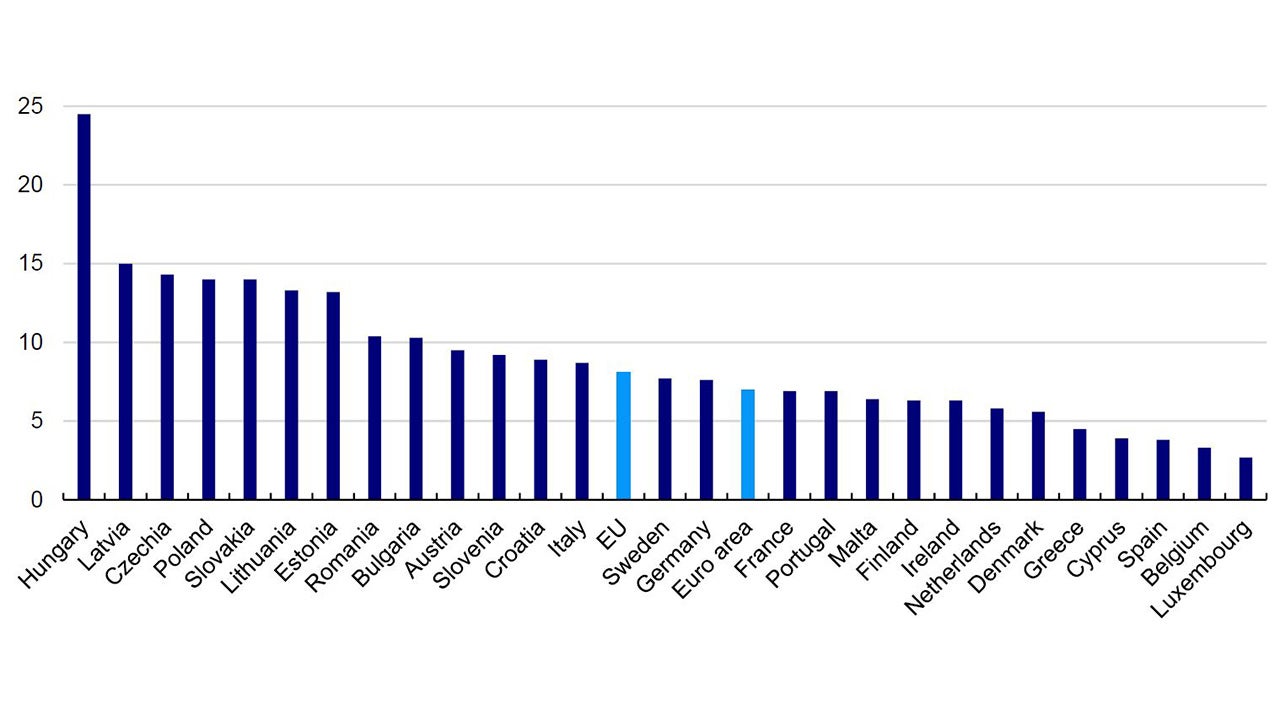
The post-COVID bout of inflation seems to be ebbing in most countries around the world. In fact, only 28 countries out of the 143 available to us on Refinitiv Datastream registered new peaks in annual consumer price inflation during 2023. The countries in question are all emerging economies mostly from Africa. Broadly, those countries with the lowest GDP per capita have faced the highest inflation rates. This trend seems to be reflected in the European Union, where only two countries that were not formerly part of the Soviet bloc, Austria and Italy, had higher inflation rates than the European Union aggregate for April 2023 (Figure 1).
Eastern members of the European Union (EU) may even have flashbacks to the 1990s and not just because its fashion has returned, and cassette tapes are gaining popularity. Runaway inflation was a direct consequence of the transition from a closely controlled economy under communism to free market capitalism. Can that period teach us anything about the likely path of inflation?

Note: Data as of 19 May 2023. The chart shows the annual change in harmonised consumer price index as reported for April 2023 vs April 2022.
Source: Eurostat and Invesco
Eastern European countries have found themselves having to deal with pressures that have not completely faded from their collective memories and were fresher than for Western countries, where the inflationary shocks of the 1970s and 80s may seem like the distant past. In contrast to their current struggles, communist countries entered the 90s after a slowdown in growth and high inflation driven by the shortages of the late-1980s (Kolodko 1993). Although these economic stresses were major contributors to the collapse of their political systems, the transition to a market economy exacerbated them in ways that took a significant amount of effort and time to bring under control. The steep learning curve contributed to major differences in how they coped with those stresses. The other complicating factor was the slowdown in developed world growth at the same time.
On the surface there are similarities with the post-COVID era: major demand-supply imbalances caused by (re-)opening of economies after a period of strict controls. The price signals that come from supply constraints cause a reorientation of demand. Of course, it would be a stretch to equate the two experiences especially as they happened under different circumstances.
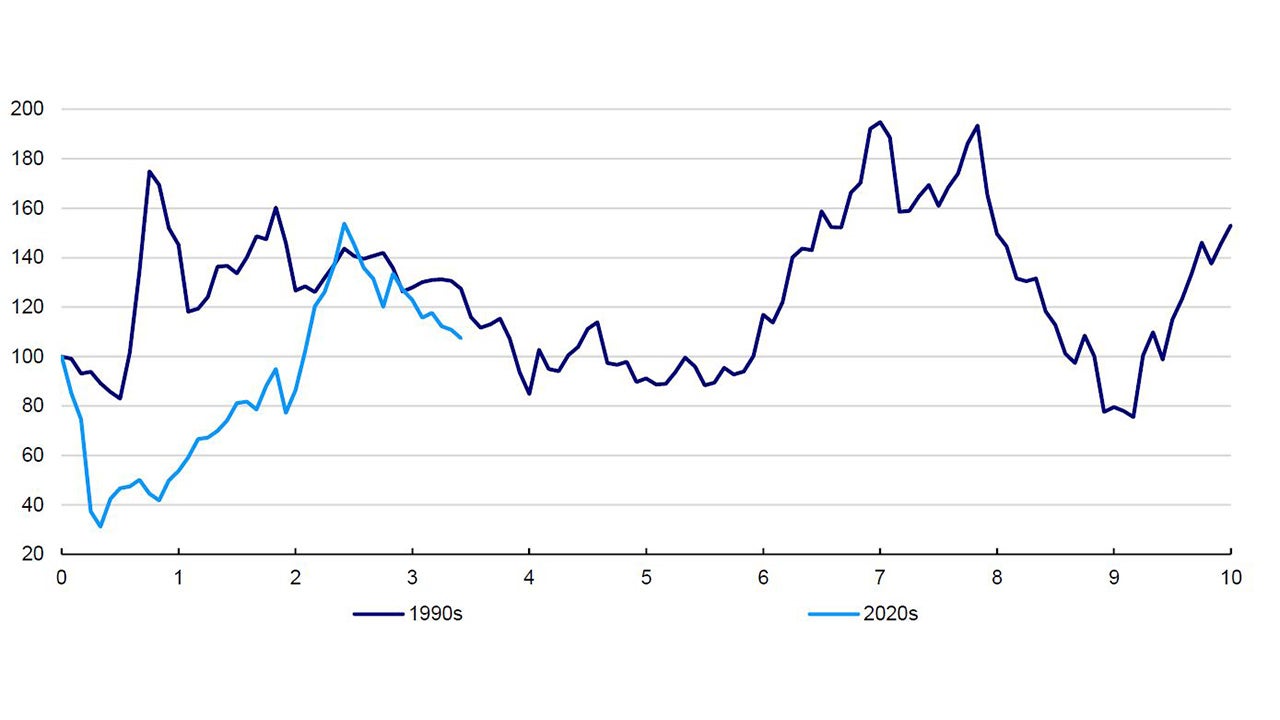
Another similarity is a spike in energy prices caused by war: in 1990 between Iraq and Kuwait, in 2022 between Russia and Ukraine (see Figure 2). The response to this exogenous shock has been familiar: the temporary support in 2022-23 to tide the economy over until energy prices return to “more affordable” levels carries echoes of the subsidisation of energy consumption during the era of central planning. Interestingly, the response to a surge in energy prices has been broadly similar in most EU member states in 2022, although the magnitude of assistance was different in each country. According to the Bruegel Institute, almost all EU members reduced the tax burden on energy for consumers, introduced some form of windfall tax on the profits of energy companies and provided support to businesses and vulnerable groups. They also capped retail prices, but only five members (France, Malta, Portugal, Slovenia and Spain) regulated wholesale prices.
Finally, both periods are characterised by some form of monetary overhang. In the case of the 1990s, the monetisation of fiscal deficits, along with price controls, contributed to an overload of money in these economies that could not be spent on goods or services, whose supply was limited (Roaf et al., 2014). The support provided during COVID-related lockdowns – both monetary and fiscal – had a similar impact. It also supercharged asset price inflation, which created wealth that could not be spent on services during lockdowns. This generated inflation first in goods, where supply chain disruptions added to the impact, and then services after economies re-opened and pent-up demand drove a surge in demand.

Notes: Data as of 19 May 2023. Past performance is no guarantee of future results. We use monthly data from the GSCI Energy Total Return index between 1 January 1990 and 1 January 2000 for the 1990s series and 1 January 2020 to 12 May 2023 for the 2020s series. Both series are rebased to 100 on 1 January 1990 for the 1990s series and 1 January 2020 for the 2020s series. The x axis shows the number of years from the start of the decade.
Source: Refinitiv Datastream and Invesco
However, a significant difference is that in the post-communist transition the production of goods for which there was little demand was deliberately reduced, which was a major cause of the decline in GDP growth, while COVID-19 lockdowns mostly impacted the service sector. There is also a difference in timing: in the 1990s, Eastern European countries had to deal with a severe stagflationary environment, whereas the post-COVID inflationary surge was partly driven by the jump in growth after reopening. Arguably, another difference is that the reorganisation of the economy in the 1990s was structural and permanent, while in the early-2020s, we had a temporary pause in certain activities, while the main underpinnings of the economy remained the same, in our view. Nevertheless, the labour force adjusted in both cases, which in the 1990s, according to Kolodko (1993), came neither immediately, nor automatically, thanks to a still underdeveloped market allocation mechanism.
This time, some of the labour market shifts may have been voluntary, but the adjustments will still take time even if the dislocation is shorter. In theory, wage growth may entice some workers back to where the biggest shortages are, while the drop in real income may also force a reorientation towards better-paying jobs. Exacerbating these issues for some countries are high rates of emigration of young workers to Western Europe. Nevertheless, we think the adjustment will take less time than in the 1990s due to the fact that Eastern EU members now have free market capitalist economies and mostly independent central banks, and therefore the required changes will not be as significant as 30 years ago.
How quickly inflation rates normalise in the region and where they settle depends on a lot of factors, although we think commodity prices, currency movements and labour market developments will remain the most important.
Food and energy comprise a relatively high proportion of the inflation baskets of CEE countries. The average weight of food, non-alcoholic beverages and energy among Eastern EU members is 32% compared to 24% for the whole EU (using 2023 weights from Eurostat). A decline in energy prices from their most recent peaks in 2022 reduced their contribution to inflation. However, food price inflation has stayed high despite a decline in agricultural commodities year-to-date and may remain elevated while supply disruptions continue caused by the war in Ukraine and extreme weather patterns.
Currency movements have also helped this year as the and euro, the Czech koruna, the Hungarian forint and the Polish zloty all strengthened against the US dollar (the latter three also against the euro). This should reduce the burden of imported inflation, especially in small and open economies. In any case, we think this trend will continue, especially against the USD, unless the global economy enters a more severe slowdown than we currently expect.
The hollowing out of the labour market may appear to be the largest obstacle to achieving inflation targets in the region, especially in light of shrinking working age populations, emigration and given the uncertainty around the situation of Ukrainian refugees and their participation in the labour market. However, most of these issues also coincided with low inflation rates in the 2010s. Therefore, we think that the dissipation of reopening-related sectoral disruptions will prove to be more important and will allow inflation to moderate.
Luckily, current inflation rates in the region are nowhere near the levels reached during the 1990s (Figure 3). Central bank policy rates could also stay lower than their 90s peaks, although we think they are restrictive enough to contribute to a rise in unemployment rates as GDP growth slows, with a deteriorating external environment adding to that trend.

Notes: Data as of 19 May 2023. Using annual data between 1980 and 2023 for the year-over-year change in the annual average consumer price index from the International Monetary Fund’s World Economic Outlook Database. The following countries are included in the median rate: Hungary, Poland and Romania from 1980, and then Bulgaria from 1981, Croatia, Latvia and Slovenia from 1993, Estonia and Slovakia from 1994 and Czechia and Lithuania from 1996. Data points for 2022 and 2023 are IMF estimates.
Source: International Monetary Fund and Invesco
Thus, if inflation continues to moderate globally and in Eastern members of the EU, it will allow central banks to lower interest rates, which would boost both government bonds and equities, in our view. We remained constructive on broader EM equities and sovereign bonds in our latest The Big Picture mainly due to their more attractive valuations relative to developed markets and also as a source of diversification, in case the global economy performs better than we expect.
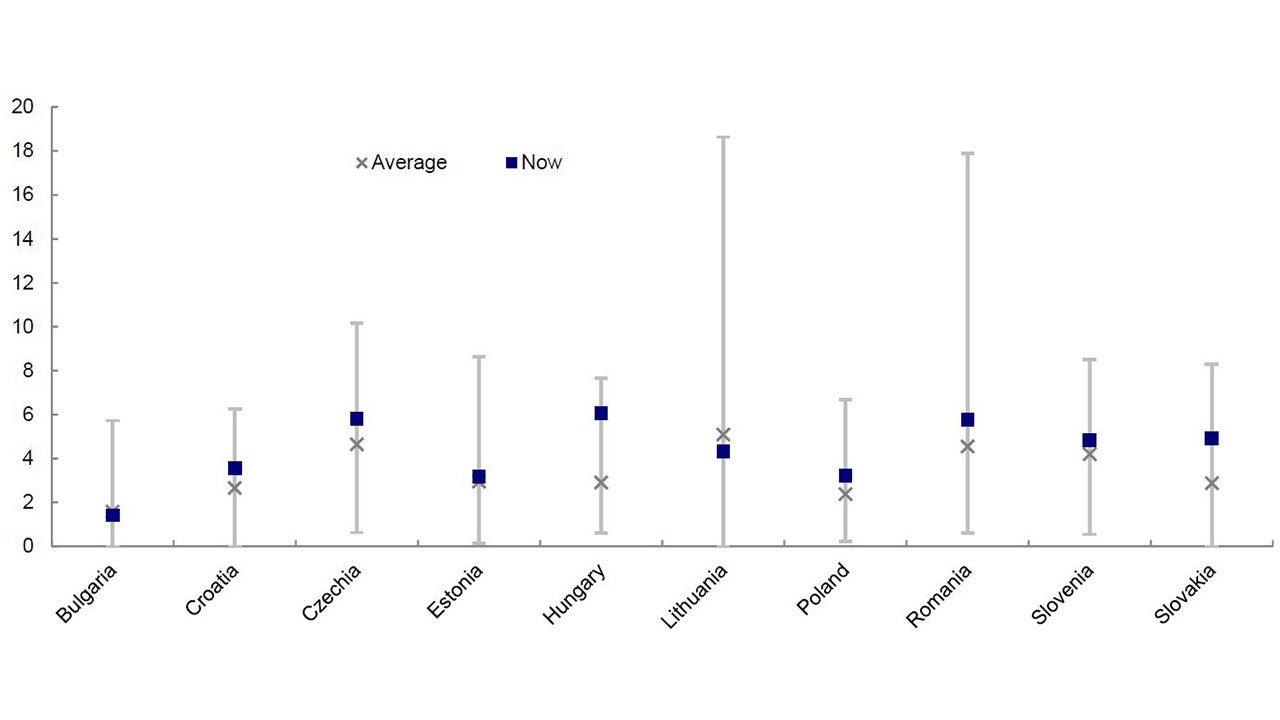
We also wrote last year about where we find value within EM equities (see here for the full analysis) and we concluded at the time that the three Eastern European members of the MSCI Emerging Market index (Czechia, Hungary and Poland) looked attractive relative to their historical averages based on their dividend yields. This remains the case despite strong returns in the last 12 months in local currency terms, comfortably outperforming broader EM equities based on Datastream Total Market Indices. In our larger universe, only Bulgaria and Lithuania have dividend yields below their historical averages (see Figure 4), while five countries yield close to or above 5%: Czechia, Hungary, Romania, Slovenia and Slovakia.

Data as of 19 May 2023. We use daily dividend yields from Datastream Total Market indices. Averages include data for the whole series starting on 2 October 2000 for Bulgaria, 3 October 2005 for Croatia, 27 January 1994 for Czechia, 5 June 1997 for Estonia, 21 June 1991 for Hungary, 1 April 1998 for Lithuania, 1 March 1994 for Poland, 29 December 1997 for Romania, 31 December 1998 for Slovenia and 1 March 2006 for Slovakia.
Source: Refinitiv Datastream and Invesco
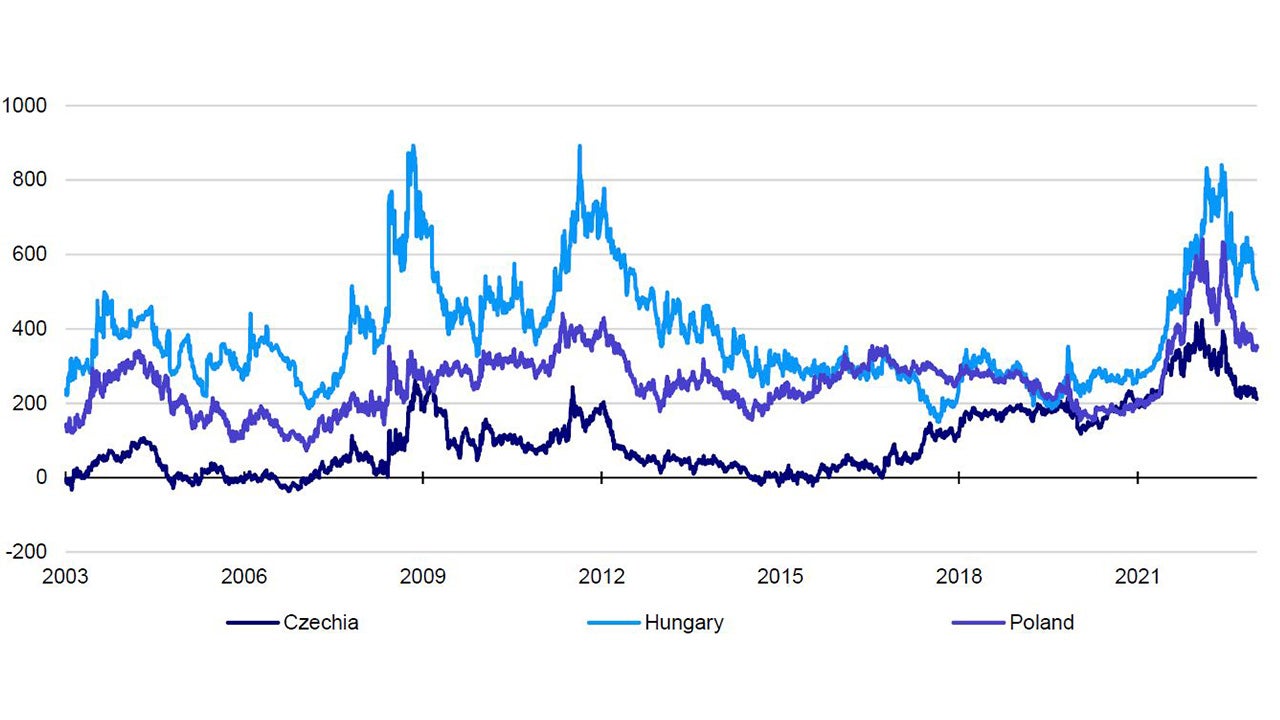
The government bonds of the three MSCI EM member countries (Czechia, Hungary and Poland) also look attractive to us despite rallying from their most recent lows in mid-October. Yields are above their 20-year averages and at 4.5% for fiscally prudent Czechia, 5.9% for Poland and 7.4% for Hungary offer enough pick-up compared to German bunds to compensate for more elevated levels of risk, in our view. Spreads versus Bunds are also above 20-year averages, which together with our expectation of their exchange rates strengthening as risk-appetite improves and inflation differentials decline, implies that they have further potential to outperform (Figure 5).
We think that Eastern members of the EU have come a long way since the turbulent 1990s. Although the current inflationary surge may have parallels with that period of transition, its magnitude is different and could be resolved faster than 30 years ago. Based on our assumptions for the global economy avoiding a deep recession and inflation continuing to moderate, we find the region’s equities and sovereign debt attractive even within a broader EM universe.

Notes: Data as of 19 May 2023. Past performance is no guarantee of future results. The chart shows daily data between 19 May 2003 and 19 May 2023. We use Datastream 10-year benchmark government bond index redemption yields. We calculate spreads by deducting 10-year German Bund yields from each country’s government bond yield.
Source: Refinitiv Datastream and Invesco
References
-
1
Grzegorz W. Kolodko: From Recession to Growth in Post-Communist Economies: Expectations versus Reality, Communist and Post-Communist Studies, Vol. 26, No. 2 (June 1993), pp. 123-143.
-
2
James Roaf, Ruben Atoyan, Bikas Joshi, Krzysztof Krogulski: 25 Years of Transition – Post-Communist Europe and the IMF, Regional Economic Issues Special Report, 2014


