Why fixed income ETFs in the current macro environment?

We are fast approaching the last quarter of 2024, and the Federal Reserve (Fed) recently cut rates by 50 basis points. As of the time of writing, 10-year US treasuries were yielding 3.7% and 1-year US treasuries were yielding 4.5%.1
Time for cash repositioning
A staggering $6.3 trillion is parked in money market funds2 as investors have benefited from short-term interest rates climbing rapidly in the post pandemic era. However, with the larger than expected recent Fed cut, we believe the global easing cycle is now underway putting the move out of cash allocations and into duration extension in the spotlight.
It is worth looking at the returns of the ICE BofA US 3-Month Treasury Bill Index relative to the Bloomberg US Aggregate Bond Index over a short and longer-term time horizon to illustrate this trend. We see that the return on cash instruments (10.6%) was higher than that of broad fixed income allocations (6.51%) during the period between July 2022 (when the tightening cycle was just starting) and September 2024. However, this relationship changes dramatically if we consider the period between July and September 2024 (1.29% for cash instruments versus 6.02% for broad fixed income).
Figure 1 – Comparison of cash instruments and broad fixed income return over a short and longer-term time horizon
Index |
Total return (July 2022 - September 2024) (%) |
Total return (July 2024 - September 2024) (%) |
ICE BofA US 3-Month Treasury Bill Index (USD) |
10.60 |
1.29 |
Bloomberg US Aggregate Bond Index (USD) |
6.51 |
6.02 |
Source: Bloomberg, data as of September 23rd, 2024. An investment cannot be made directly into an index. Past performance does not guarantee future results.
Incorporating fixed income ETFs into portfolios
We believe fixed income exchange traded funds (ETFs) can provide investors with precision tools to solve for a variety of outcomes including controlling for portfolio duration or interest rate sensitivity, credit quality and yield to maturity in a transparent, liquid and low-cost vehicle.
Investors could utilize ETFs to efficiently adjust their fixed income portfolio sleeves and position them to capture opportunities whilst also managing for risk as we gradually enter a lower interest rate environment.
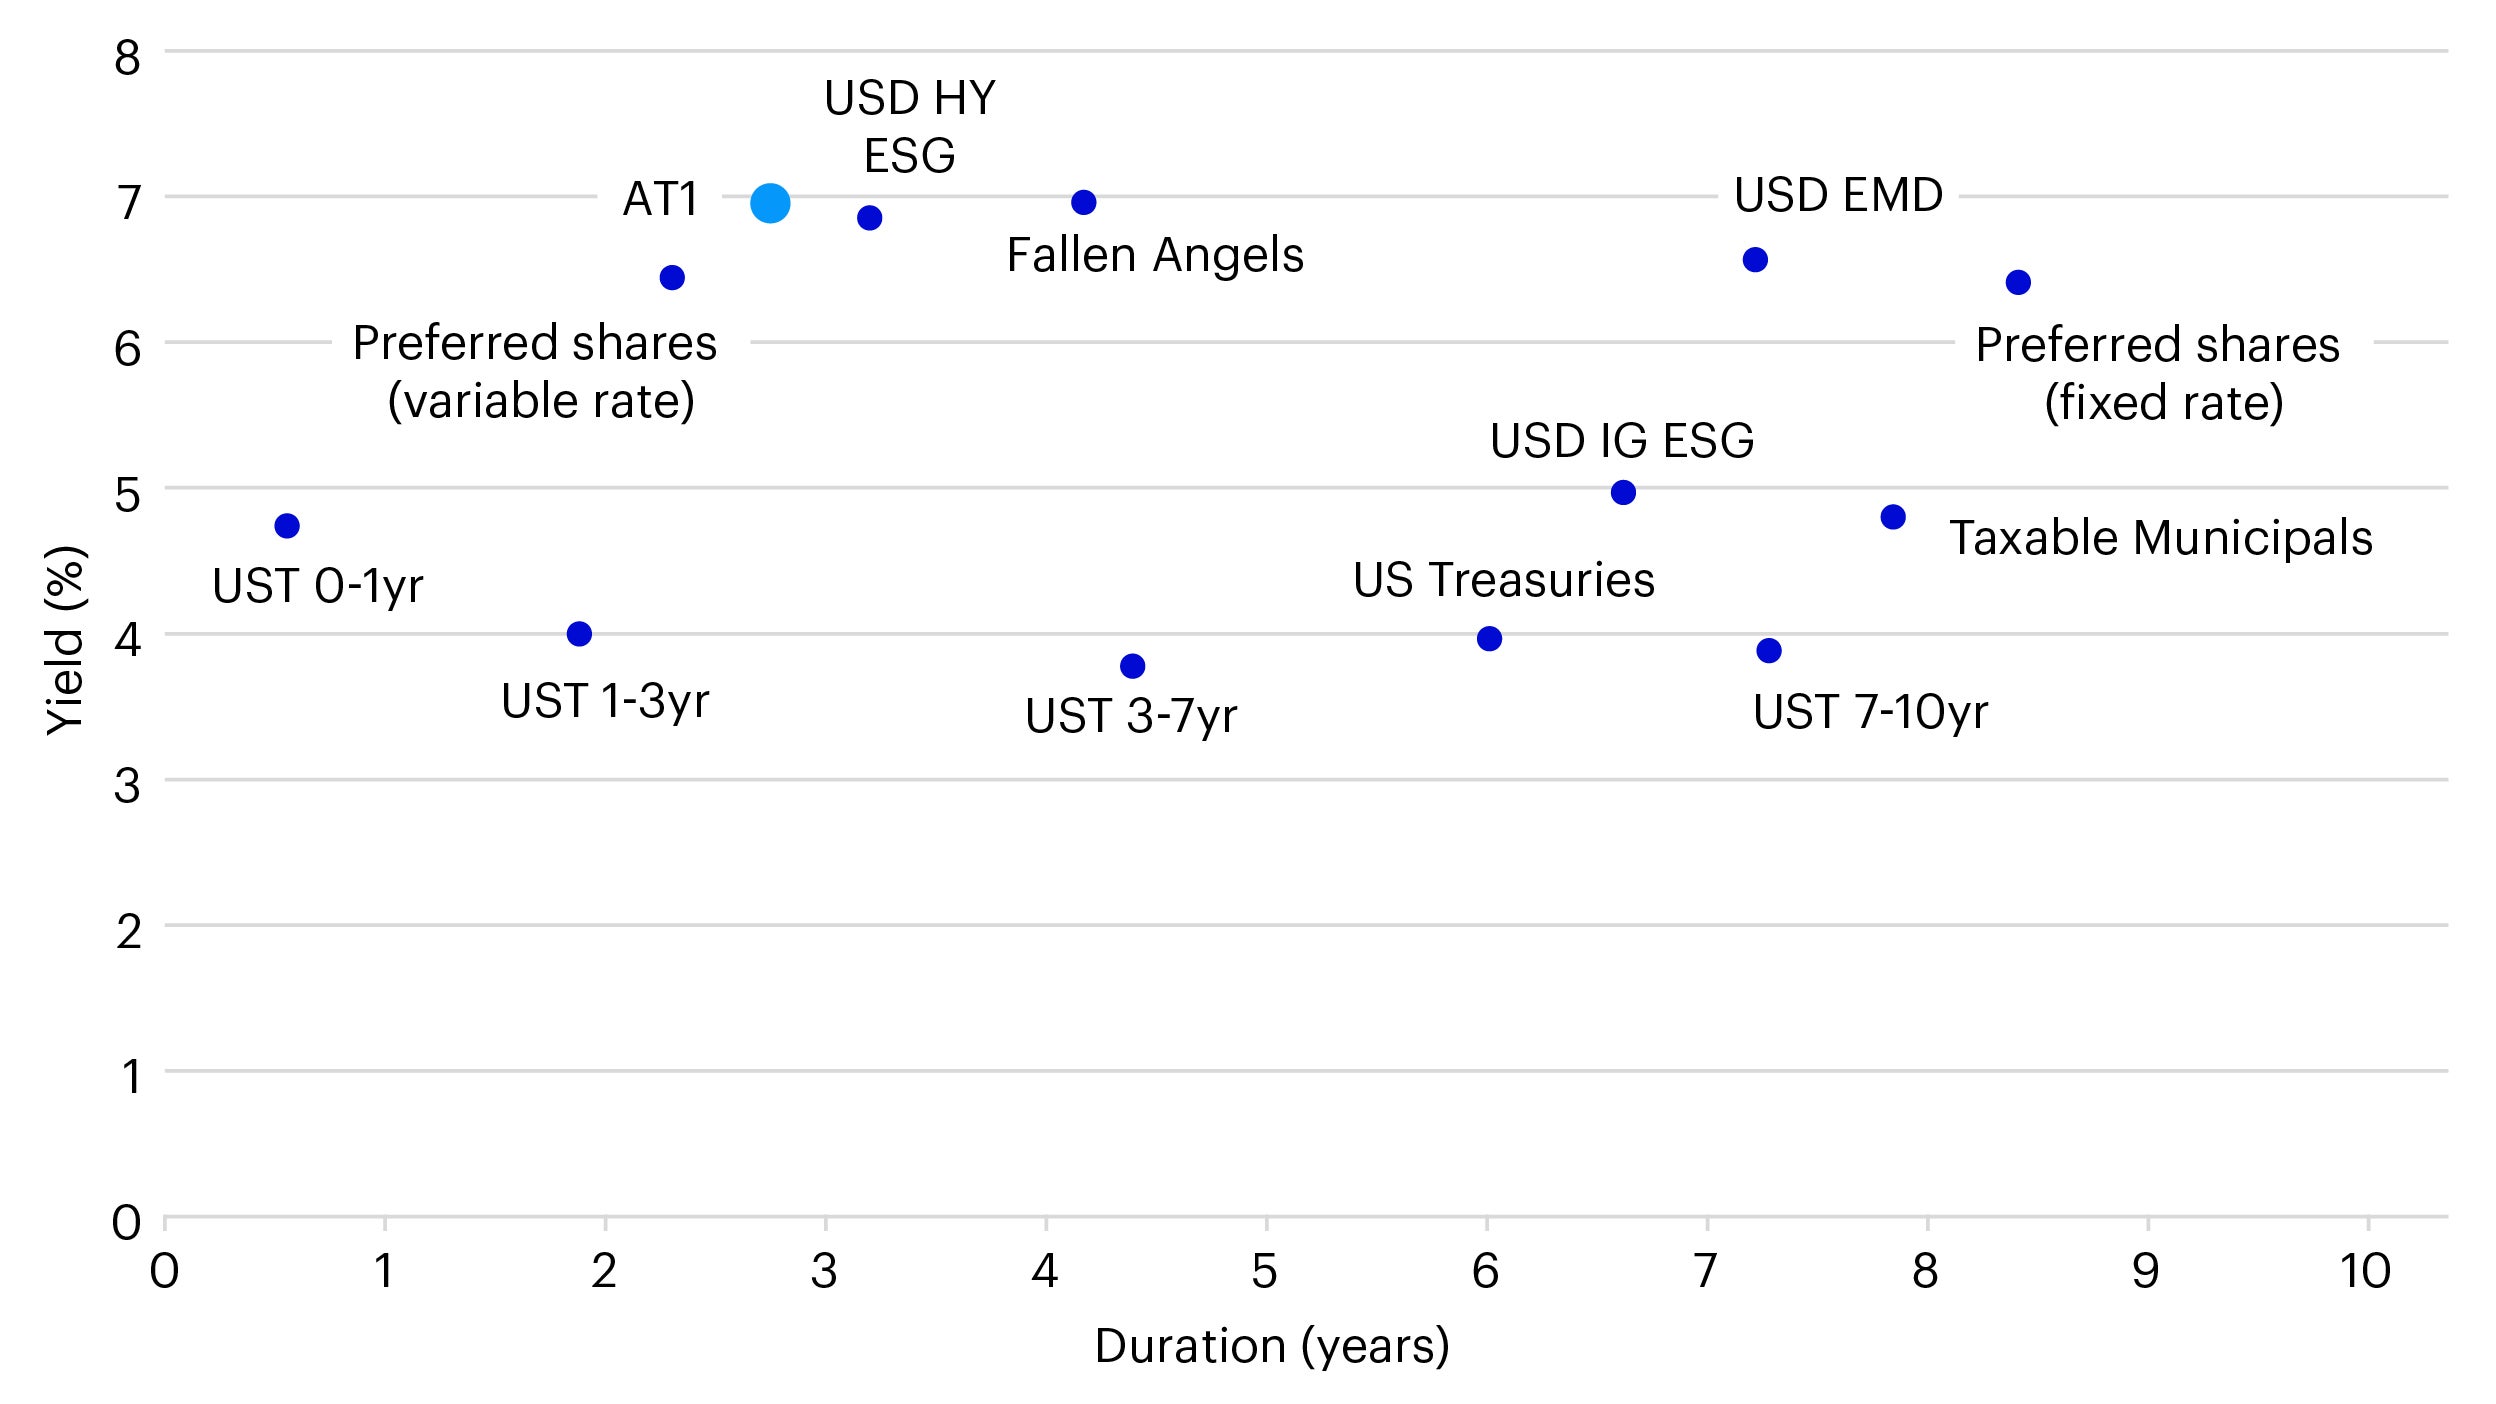
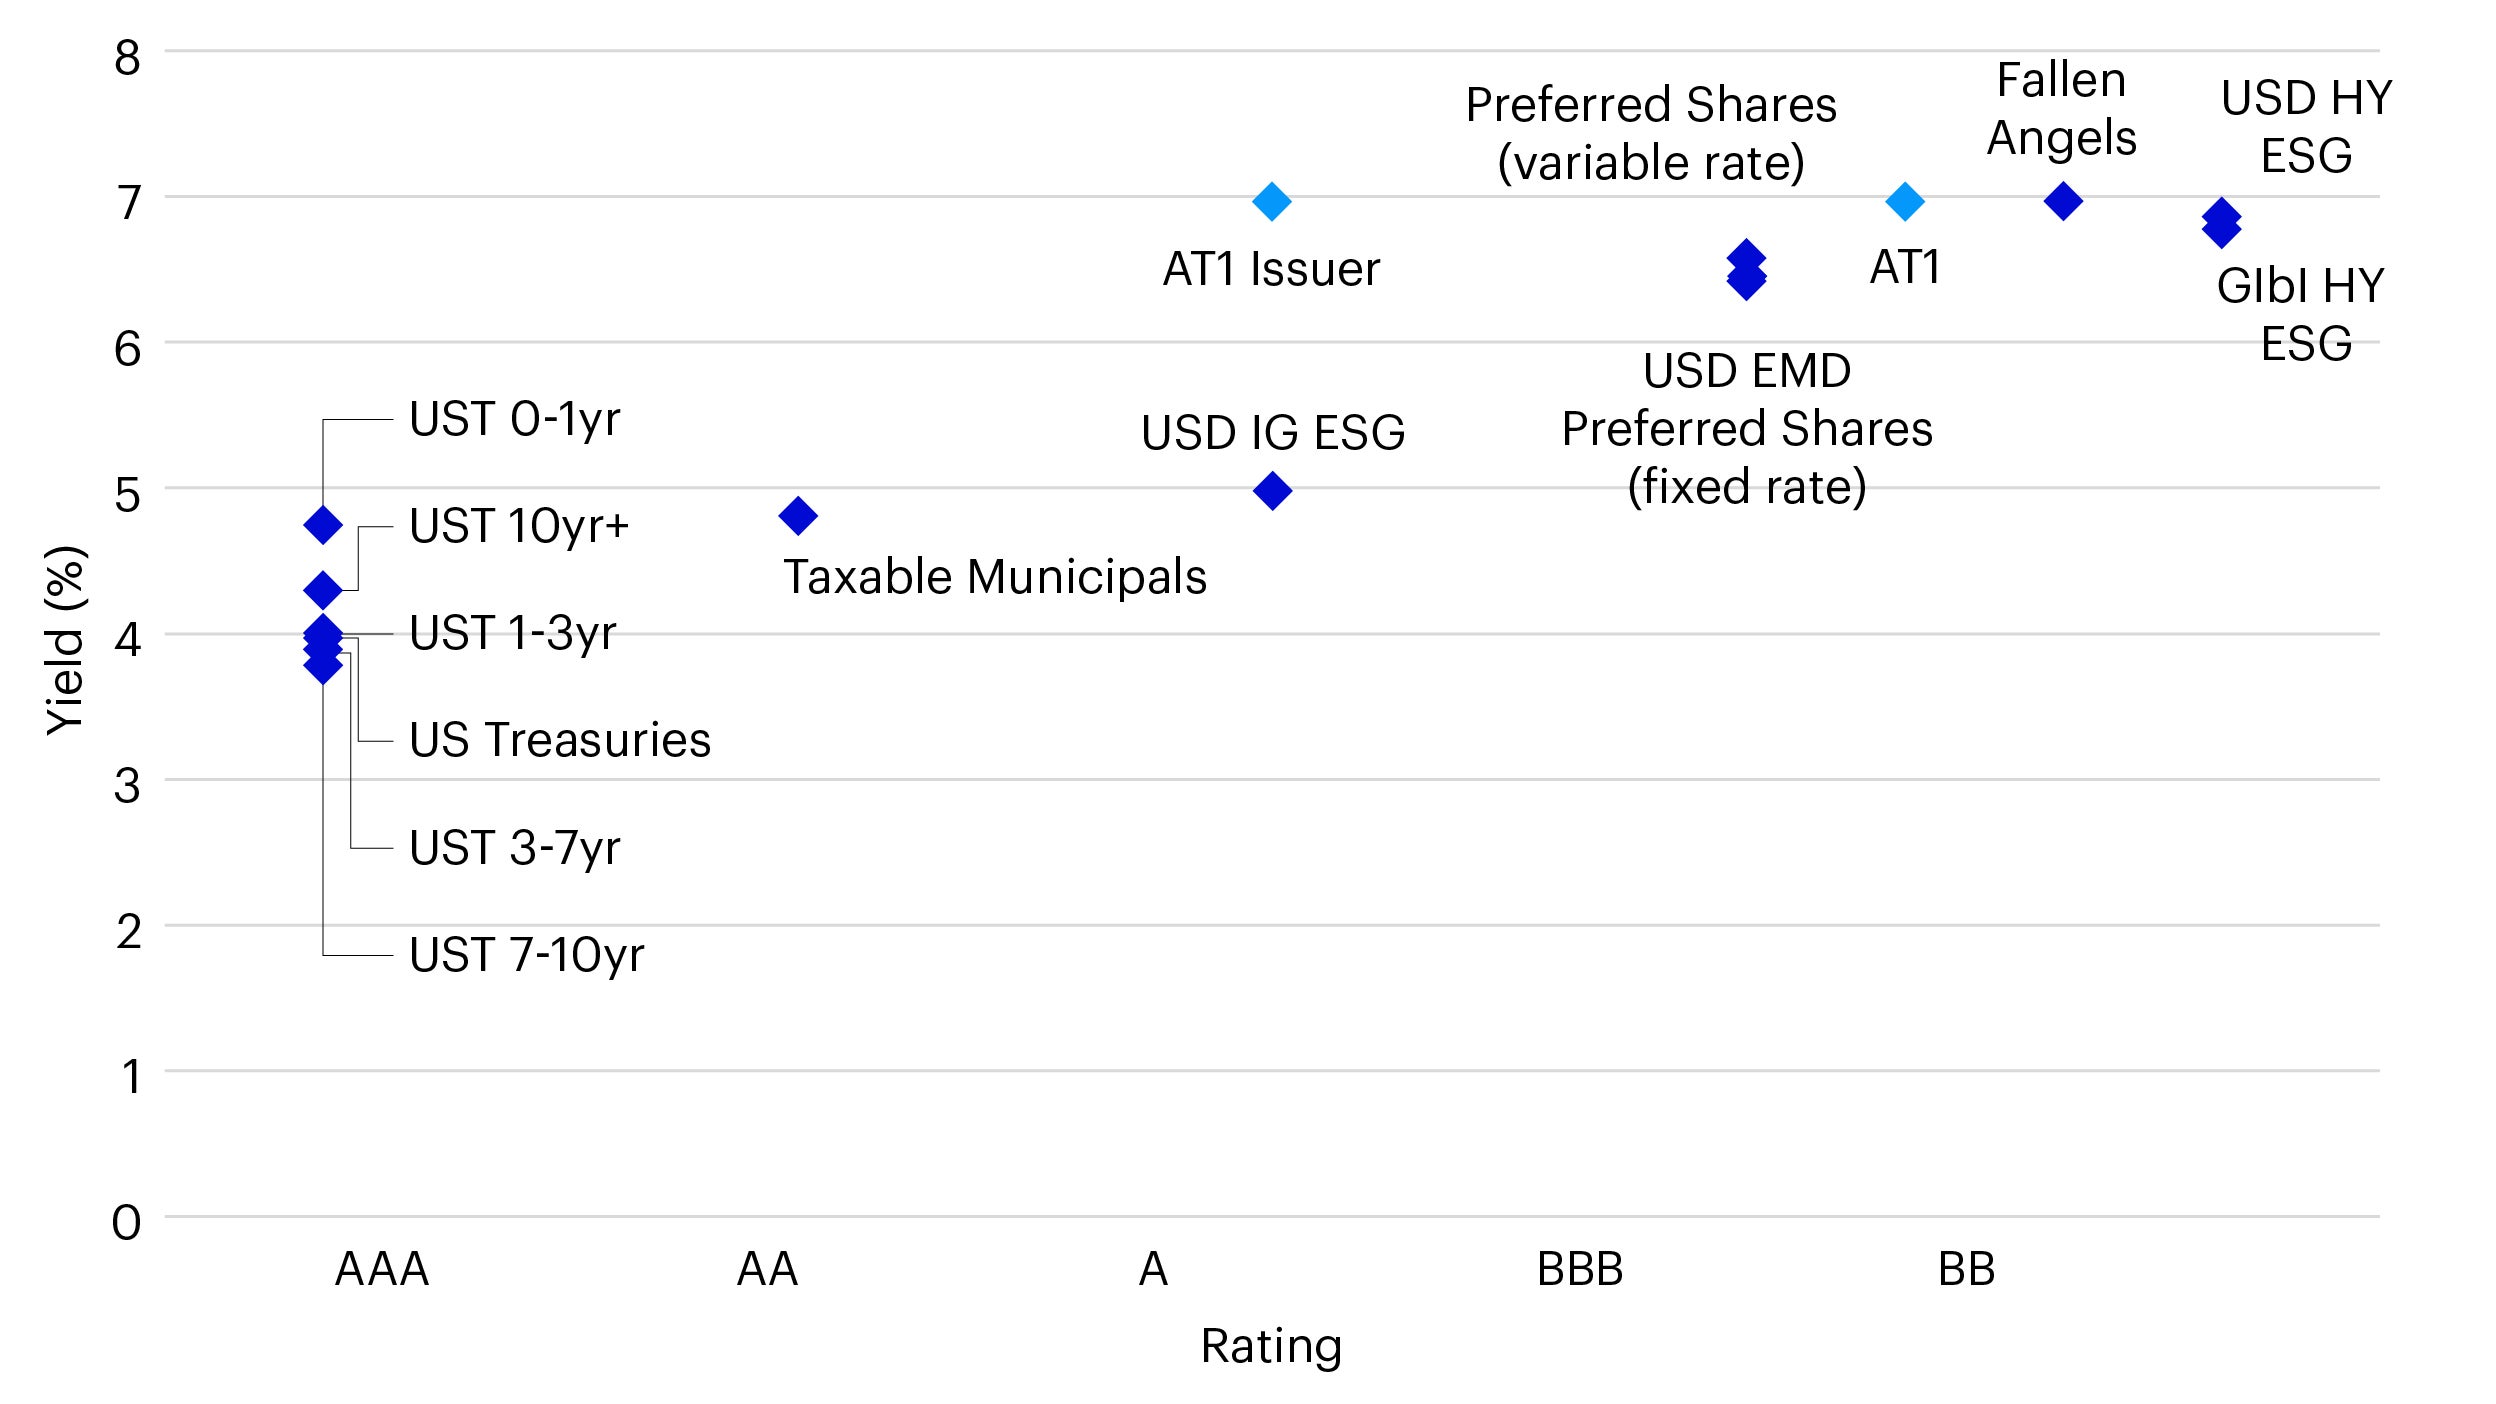
In the charts below we indicate how various areas of fixed income could help investors meet their preferred yield, duration and quality outcomes (Figure 2 and 3). We then delve into the specific opportunities we think investors can access via ETFs as we enter 2025, including USD investment grade (IG) and high yield (HY) bonds, municipal bonds, and preferred shares and AT1s.

Source: Bloomberg, Aladdin, Invesco as at 30 Aug 2024. Please refer to Appendix for the proxies used for these fixed income instruments. Past performance does not guarantee future results.

Source: Bloomberg, Aladdin, Invesco as at 30 Aug 2024. Please refer to Appendix for the proxies used for these fixed income instruments. Past performance does not guarantee future results.
USD investment grade (IG) credit
The USD IG credit market has grown significantly over the past decade and IG issuances by corporates have risen from 57% to 70% of all bond issuances.3 The average daily trading volume in the USD IG market has increased by 125% to reach US $34.5 billion and the total notional value of the USD IG bond market has grown by 75%, now standing at US $10 trillion as of September 8, 2024.4
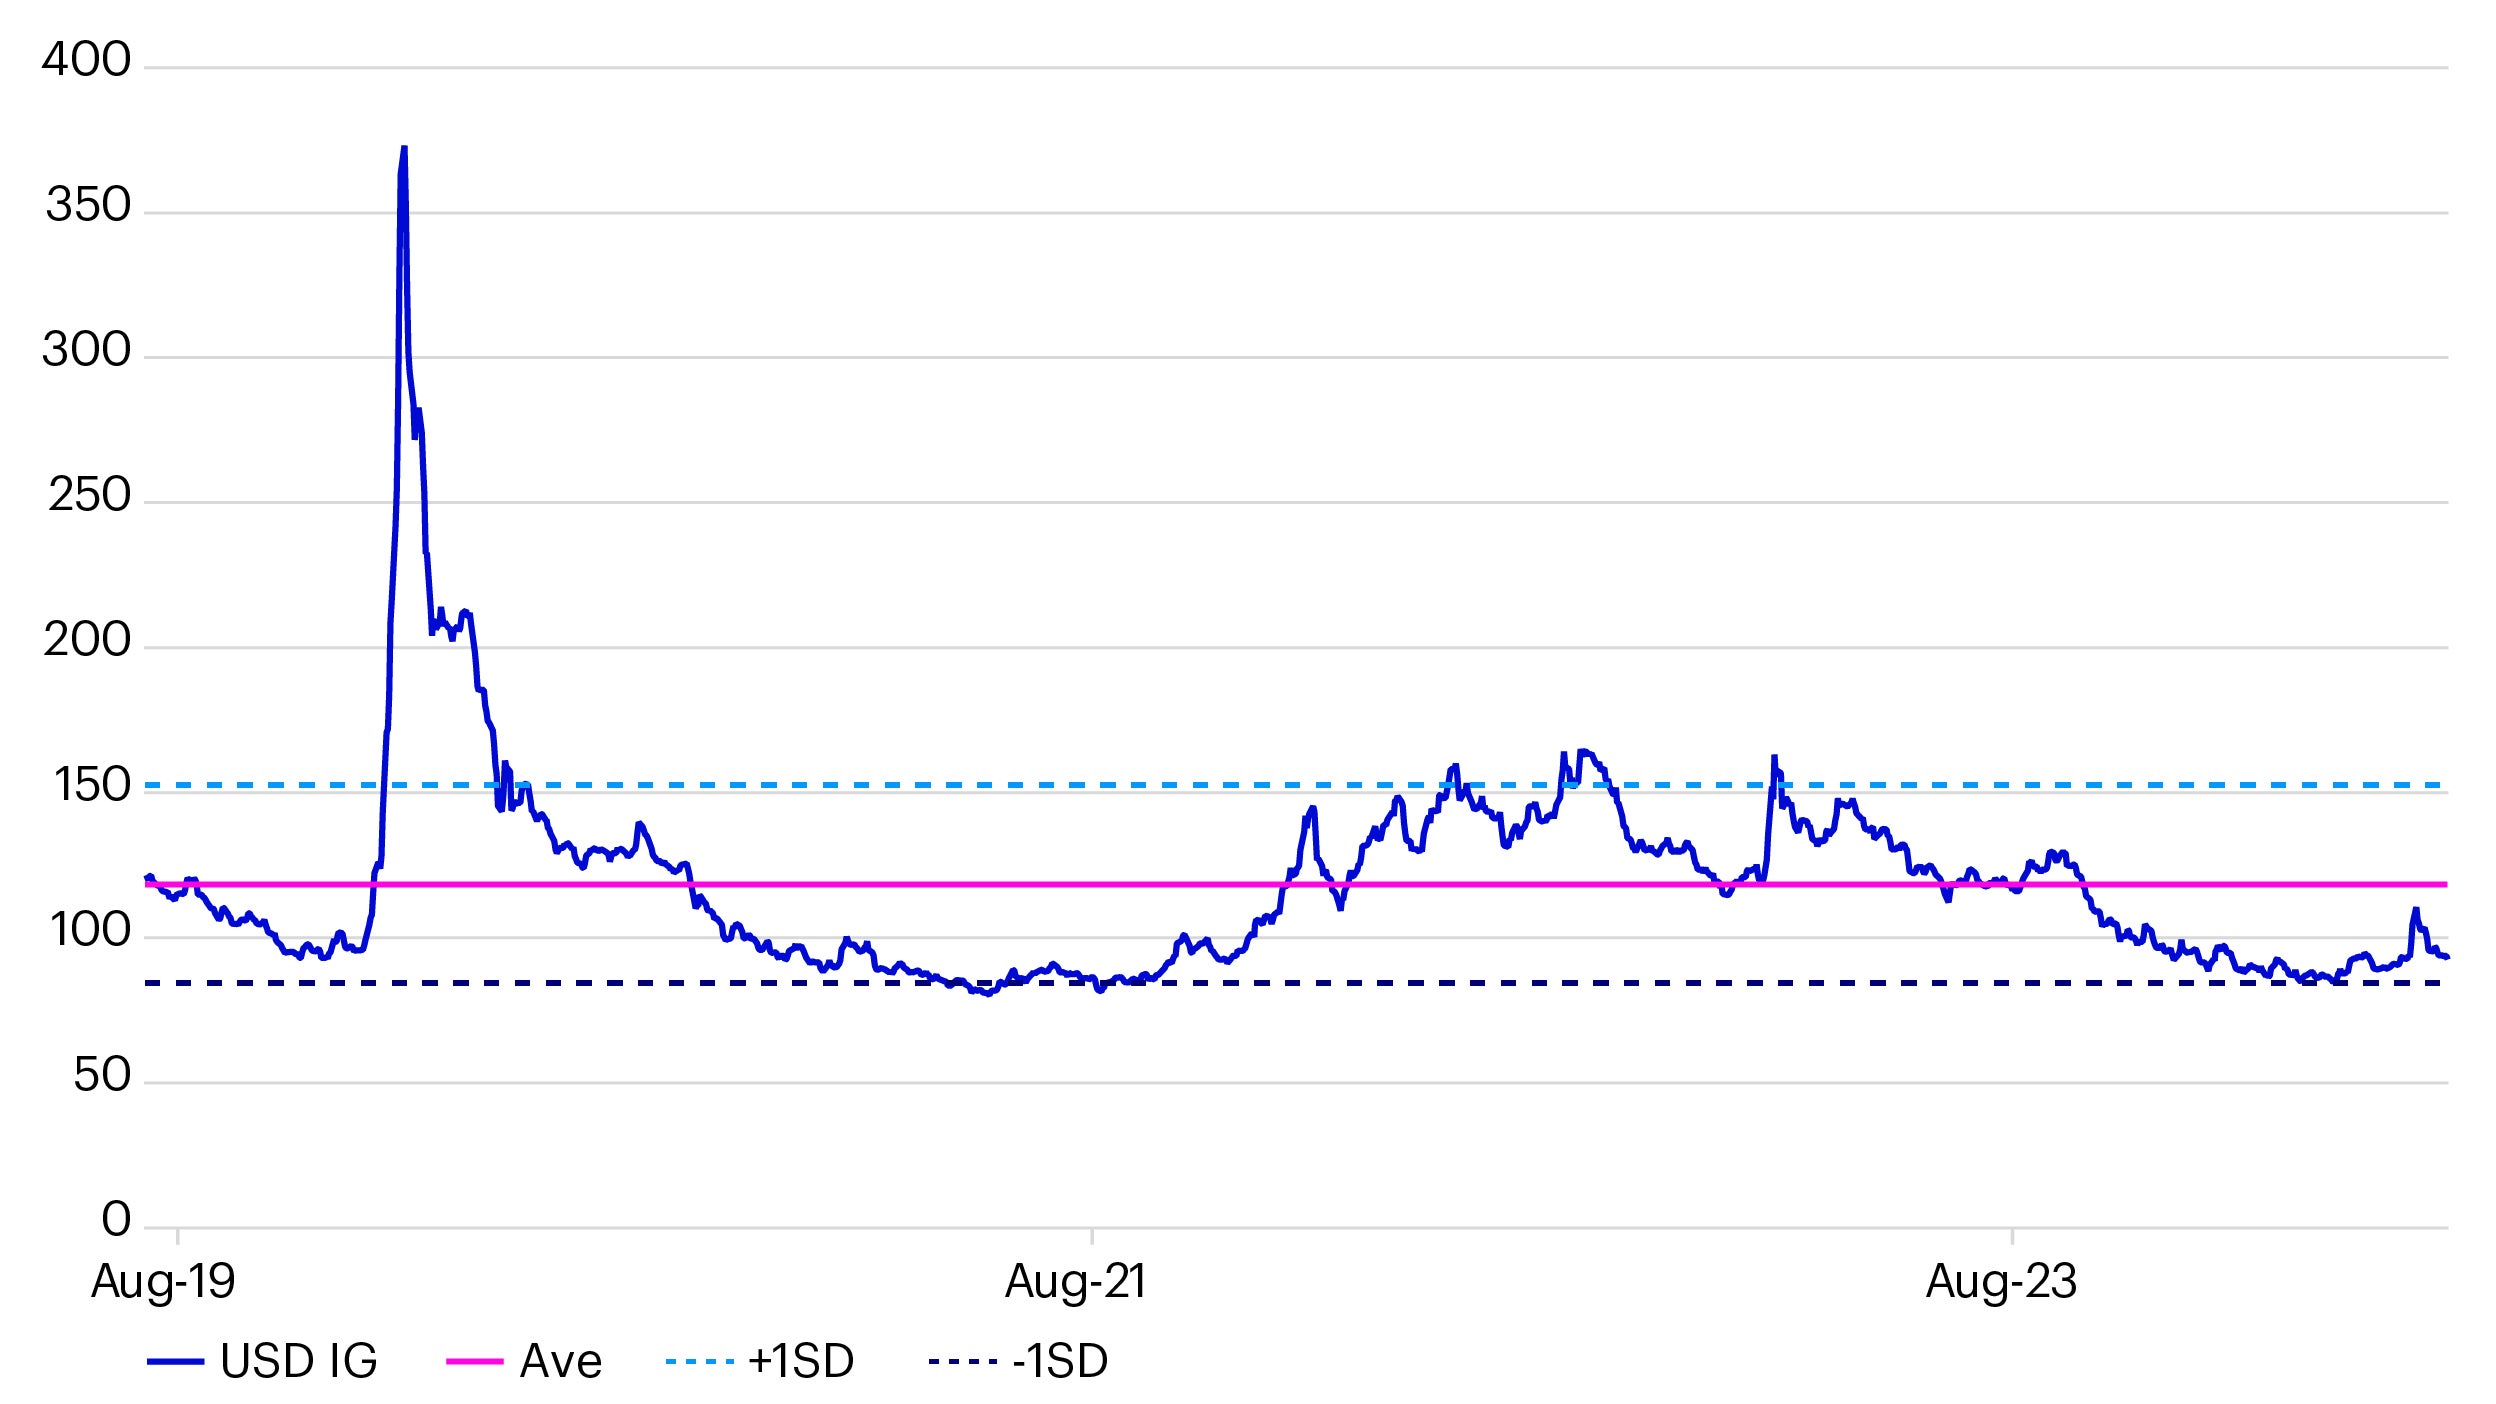
Despite tight spreads, we believe all-in USD IG yields are still reasonably attractive. Many issuers have already prefunded, with US $1.1 trillion of issuance being well absorbed by the market year-to-date5. Going forward we expect the new issuances to normalize in Q4 2024 due to seasonality, earnings blackouts and the US elections, as well as further potential Fed rate cuts.
Historically, IG issuance has not been significantly affected by the first rate cut in an easing cycle as issuers tend to benefit from lower funding costs ahead of the actual rate cut event. Further, we note that the 12-month supply of IG bonds modestly declined after the start of previous Fed easing cycles (excluding 2019)6 and this cycle we expect the pattern to repeat. Net supply in Q4 is expected to be negative and spreads are likely to remain tight due to technical factors, creating a positive environment for the IG asset class.7

Source: Blomberg, Invesco, data as of 30 Aug 2024.
High Yield (HY) and fallen angels
Inflation is slowing toward the Fed’s target as the economy moderates with further potential rate cuts on the horizon. We expect this macro moderation to be positive for high yield bonds. Solid fundamentals also support high yield bonds as this causes default rates to fall and credit metrics to improve, with ratings upgrades exceeding downgrades.
Much like IG, spreads for USD HY bonds are tight but all-in yields remain relatively attractive. We believe investors can benefit from accessing high yield exposures via “fallen angels”, bonds which were previously rated investment-grade but were subsequently downgraded to high yield.
Municipal bonds
US municipal bonds offer a way to supplement yields while maintaining high credit quality. About 70.4% of the ICE BofA US Taxable Municipal Index is rated AAA/AA by S&P, while less than 10% of the broad US IG universe has the top rating.8 We believe taxable municipals, secured with the same revenue streams and tax pledges as tax-exempt bonds, can provide an attractive solution for investors looking to add duration and quality to their portfolios.
Preferred shares and AT1s
We believe investors can take views along the capital structure to diversify their drivers of yield via subordinated credit such as US Additional Tier 1 capital bonds (AT1s) and US fixed rate preferred shares. Preferred shares can also allow investors to gain duration exposure.
Fixed rate preferred shares have returned 16% since September 2023 while AT1s have returned 35% since the announcement of the write down of Credit Suisse AT1s in March of the same year.9
Like broader credit market trends, preferred yields remain near multi-year highs. Subsequently, new preferreds are being issued with relatively high fixed coupons. Based on a soft-landing scenario, new issues (and the broader preferred shares sector) are likely to experience price support and potential price appreciation if rates and yields move meaningfully lower.
Year to date total returns for preferred shares at the time of writing was 9% versus 4% for USD IG & 6% for USD HY bonds.10
Barbelling US treasuries and laddering USD IG credit
One strategy that could be interesting to investors is to overweight US treasuries (UST) in the front end of the curve as the market digests rate cuts and pair that with a full curve UST exposure for a measured yield and duration profile of their desire.
Investors could also consider taking a laddered approach to USD IG credit by utilizing term maturity ETFs that deliver baskets of USD IG bonds all maturing in the same year. For example, we see strong interest across USD IG in 2026, 2027 and 2028 maturities.
Example of a diversified fixed income portfolio
As the Fed’s rate-cutting cycle begins, investors can consider adjusting their fixed income sleeves to take advantage of changing yields and spreads across various asset classes. The below sample asset allocation illustrates how fixed income ETFs can help investors achieve a range of yield and duration outcomes. We believe areas such as USD IG credit, USD HY bonds, municipal bonds, preferred shares, and AT1s all offer unique opportunities that can be accessed via liquid, transparent and low-cost ETFs.
Fixed income building blocks |
Yield/duration |
Yield |
Duration |
Allocation to short end of the curve (%) |
Sample allocation (%) |
|---|---|---|---|---|---|
US Treasury 0-1 Year KRD |
8.9% |
4.5% |
0.5 |
100 |
25 |
US Treasury Full Curve |
0.6% |
3.6% |
6.1 |
N/A
|
10 |
US Municipal Bonds |
0.6% |
4.6% |
7.9 |
15 |
|
US IG 2026 Term Maturity |
2.7% |
4.3% |
1.6 |
5 |
|
US IG 2027 Term Maturity |
1.7% |
4.2% |
2.5 |
2.5 |
|
US IG 2028 Term Maturity |
1.3% |
4.3% |
3.3 |
2.5 |
|
US High Yield Fallen Angels |
1.6% |
6.7% |
4.2 |
15 |
|
US Fixed Rate Preferred Shares |
0.8% |
6.3% |
8.2 |
15 |
|
USD AT1s |
2.4% |
6.7% |
2.8 |
10 |
|
| Total | 100% |
100% |
|||
| Yield to Maturity | 4.5% |
5.2% |
|||
| Effective Duration | 0.5 |
4.3 |
|||
Source: Invesco as at 19 September 2024 in USD. Illustrative only and not financial advice. Weights are heuristic in nature and have not been optimized. The US Treasury 0-1 Year Key Rate Duration (KRD) has been proxied by the Bloomberg US Treasury Coupons Index, the US Treasury Full Curve by the Bloomberg US Treasury Index, the US Municipal Bonds by the ICE BofA US Taxable Municipal Index, the US IG 2026 Term Maturity by the Bloomberg 2026 Maturity USD Corporate Bond Screened Index, the US IG 2027 Term Maturity by the Bloomberg 2027 Maturity USD Corporate Bond Screened Index, the US IG 2028 Term Maturity by the Bloomberg 2028 Maturity USD Corporate Bond Screened Index, the US High Yield Fallen Angels by the FTSE Time-Weighted US Fallen Angel Bond Select Index, the US Fixed Rate Preferred Shares by ICE BofA Diversified Core Plus Fixed Rate Preferred Securities Index, and the USD AT1s by the iBoxx USD Contingent Convertible Liquid Developed Market AT1 (8% Issuer Cap).
Appendix
We outline the below proxy indices by acronym:
Asset class name |
ETF ticker |
Index name |
|---|---|---|
UST 0-1yr |
TREI |
Bloomberg US Treasury Coupons Index |
UST 1-3yr |
TRE3 |
BBG US Treasury 1-3 Year Index |
USD 3-7yr |
TRE7 |
BBG U.S. Treasury 3-7 Year Index |
US Treasuries |
TRES |
BBG Treasury Index |
UST 7-10yr |
TREX |
BBG Treasury 7-10 Yr Index |
USD HY ESG |
UHYD |
BBG MSCI USD High Yield Liquid Corporate ESG Weighted SRI In |
USD IG ESG |
PUIG |
BBG MSCI USD Liquid Corporate ESG Weighted Index |
Taxable Municipals |
MUNI |
ICE BofA US Taxable Municipal Index |
Preferred shares (variable rate) |
VRPS |
ICE Diversified Variable Rate Preferred & Hybrid Securities Index |
Preferred shares (fixed rate) |
PRFD |
ICE BofA Diversified Core Plus Fixed Rate Preferred Daily Rebal Index |
USD EMD |
PEMD |
BBG EM Sovereigns Index |
Glbl HY ESG |
GBHY |
Bloomberg MSCI Global High Yield Liquid Corporate ESG Weighted SRI Bond Unh |
AT1 |
EU_PWR_IHS |
Markit iBoxx USD Contg Convtbl Lqd Devpd Market AT1(8/5% Issuer Cap) |
AT1 Issuer |
N/A |
The top-level issuer rating of the banks in Markit iBoxx USD Contg Convtbl Lqd Devpd Market AT1(8/5% Issuer Cap) index |
HYFA |
EU_PWR_CG |
FTSE Time-Weighted US Fallen Angel Bond Select Index |


