Nasdaq 100 Index – Commentary - October -2023

Market Recap
After a rally in equities failed to move major indices above recent highs, equities finished the month of October in the red. This marked the third consecutive month of declines for equities. The -2.1% monthly move for the S&P 500 Index did not fully illustrate the volatility that was experienced by investors. The VIX Index, which is a gauge of volatility, rose above 20 for the first time since May. October saw the Nasdaq-100 rise 3.6% then fall to -4.1%, before settling down 2.0%.
Rising interest rates continued to be a primary driver of the markets as investors saw the 10-year US Treasury rise to levels not seen since 2007. The market saw investors increase selling activity in the 10-year Treasury which caused the price to fall and, in turn, caused yield to rise.
With Federal Open Market Committee (FOMC) not meeting this month, investors focused on economic releases. Readings during the month illustrated the “sticky” nature that inflation currently has. The Consumer Price Index (CPI) was reported on the 12th and showed a year-over-year reading of 3.7%, higher than the 3.6% expectation. The month-over-month reading was reported above the 0.3% expectation at 0.4% and equated to an annualized reading of 4.8%. The month-over-month reading did fall from the previous month’s reading of 0.6%. The largest contributor to the month-over-month number was an increase to the cost of services, followed by energy.
This year’s third quarter reading of GDP was reported during the last week of the month and showed that the US economy grew at an annualized rate of 4.9%. This was higher than the 4.5% estimate that the street was expecting. The reading of 4.9% was a positive sign and showed that the chance of recession may be lower. However, the market reacted negatively to the announcement in a “good news is bad news” fashion. Investors have been looking for slowing growth, a cooling job market and lower inflation as signals to future FOMC rate decisions. The higher-than-expected GDP number led investors to believe that the economy was not slowing at the pace needed to prevent future rate hikes.
Index performance
Past performance does not predict future returns.
| 1M | YTD | 1Y | 10Y(ann.) | |
|---|---|---|---|---|
NASDAQ-100 |
-2.0% | 32.3% | 27.1% | 16.5% |
| S&P 500 | -2.1% | 10.2% | 9.6% | 10.5% |
Relative |
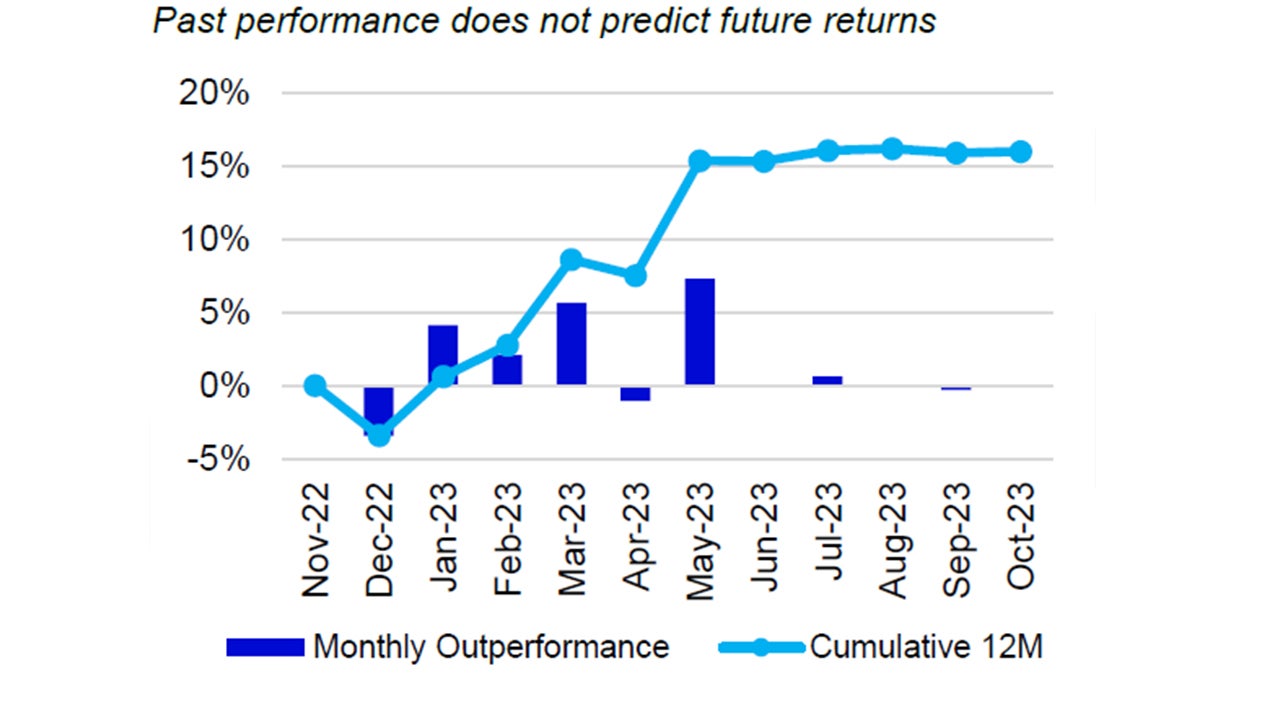
0.1% | 20.0% | 16.0% | 5.3% |
Source: Bloomberg as of 31 Oct 2023.
An investment cannot be made directly into an index.

Source: Bloomberg as of 31 Oct 2023.
An investment cannot be made directly into an index.

Data: Invesco, FactSet as of 31 Oct 2023. Data in USD
Nasdaq 100 Performance Drivers
October’s performance attribution of the Nasdaq 100 (NDX) vs the S&P 500 Index
From a sector perspective, Basic Materials, Utilities and Technology were the best performing sectors in NDX and returned 7.43%, 2.57% and -0.89%, respectively. During the month, these three sectors had average weights of 0.28%, 1.25% and 57.89%, respectively. The bottom performing sectors in NDX were Energy, Health Care and Real Estate with average weights of 0.68%, 6.99% and 0.27%, respectively. Energy returned -6.86%, Health Care returned -5.94% while Real Estate returned -4.53%.
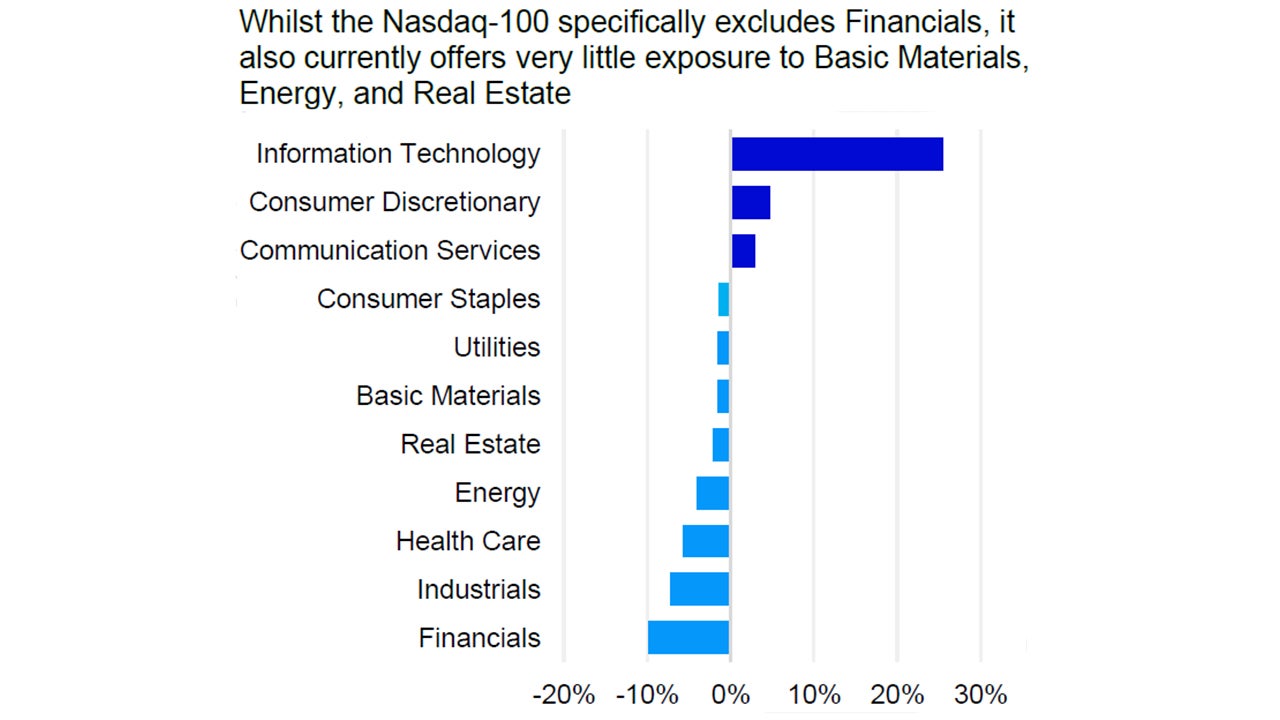
NDX’s outperformance vs. the S&P 500 was driven by its underweight exposure in the Energy sector. The index’s overweight exposure to the Technology sector along with its lack of exposure to Financials also contributed to relative performance vs. the S&P 500. The Consumer Staples sector detracted the most from relative performance and was driven by its underweight exposure and differentiated holdings. Health Care and Telecommunications also detracted from relative performance.
Top NDX Contributor: Microsoft announced strong results for their previous quarter as revenue came in nearly $2 billion above expectations, $56.51 billion vs. $54.54 billion. Adjusted earnings-per-share also surprised to the upside at $2.99 vs. the average analysts’ estimate of $2.65. After several quarters of showing slowdown, Microsoft’s Intelligent Cloud division, which contains Azure, showed year-over-year growth of 19.36% and brought in $24.26 billion in revenue. The software company also spoke of growth in artificial intelligence through the Microsoft CoPilot AI add-on along with their partnership with OpenAI.

Data: Invesco, FactSet, as of 31 October 2023 Data in USD. Sectors: ICB Classification. All figures in percentage terms. Market allocation effect shows the excess contribution due to sector/market allocation. A positive allocation effect implies that the choice of sector weights in the portfolio added value to the portfolio contribution with respect to the benchmark and vice versa. Selection effect shows the excess contribution due to security selection. A positive selection effect implies that the choice of stocks in the portfolio added value to the portfolio contribution with respect to the benchmark and vice versa. Total effect is the difference in contribution between the benchmark and portfolio.

Source: Bloomberg, as of 31 Oct 2023. Past performance does not predict future returns. Top and bottom performers for the month by relative performance.

Past performance does not predict future returns.
Data: Invesco, Bloomberg, as of 31 Oct 2023. Data in USD.
Investment Risks
The value of investments and any income will fluctuate (this may partly be the result of exchange rate fluctuations) and investors may not get back the full amount invested.


