Nasdaq 100 Index – Commentary

Accessing Innovation in the US
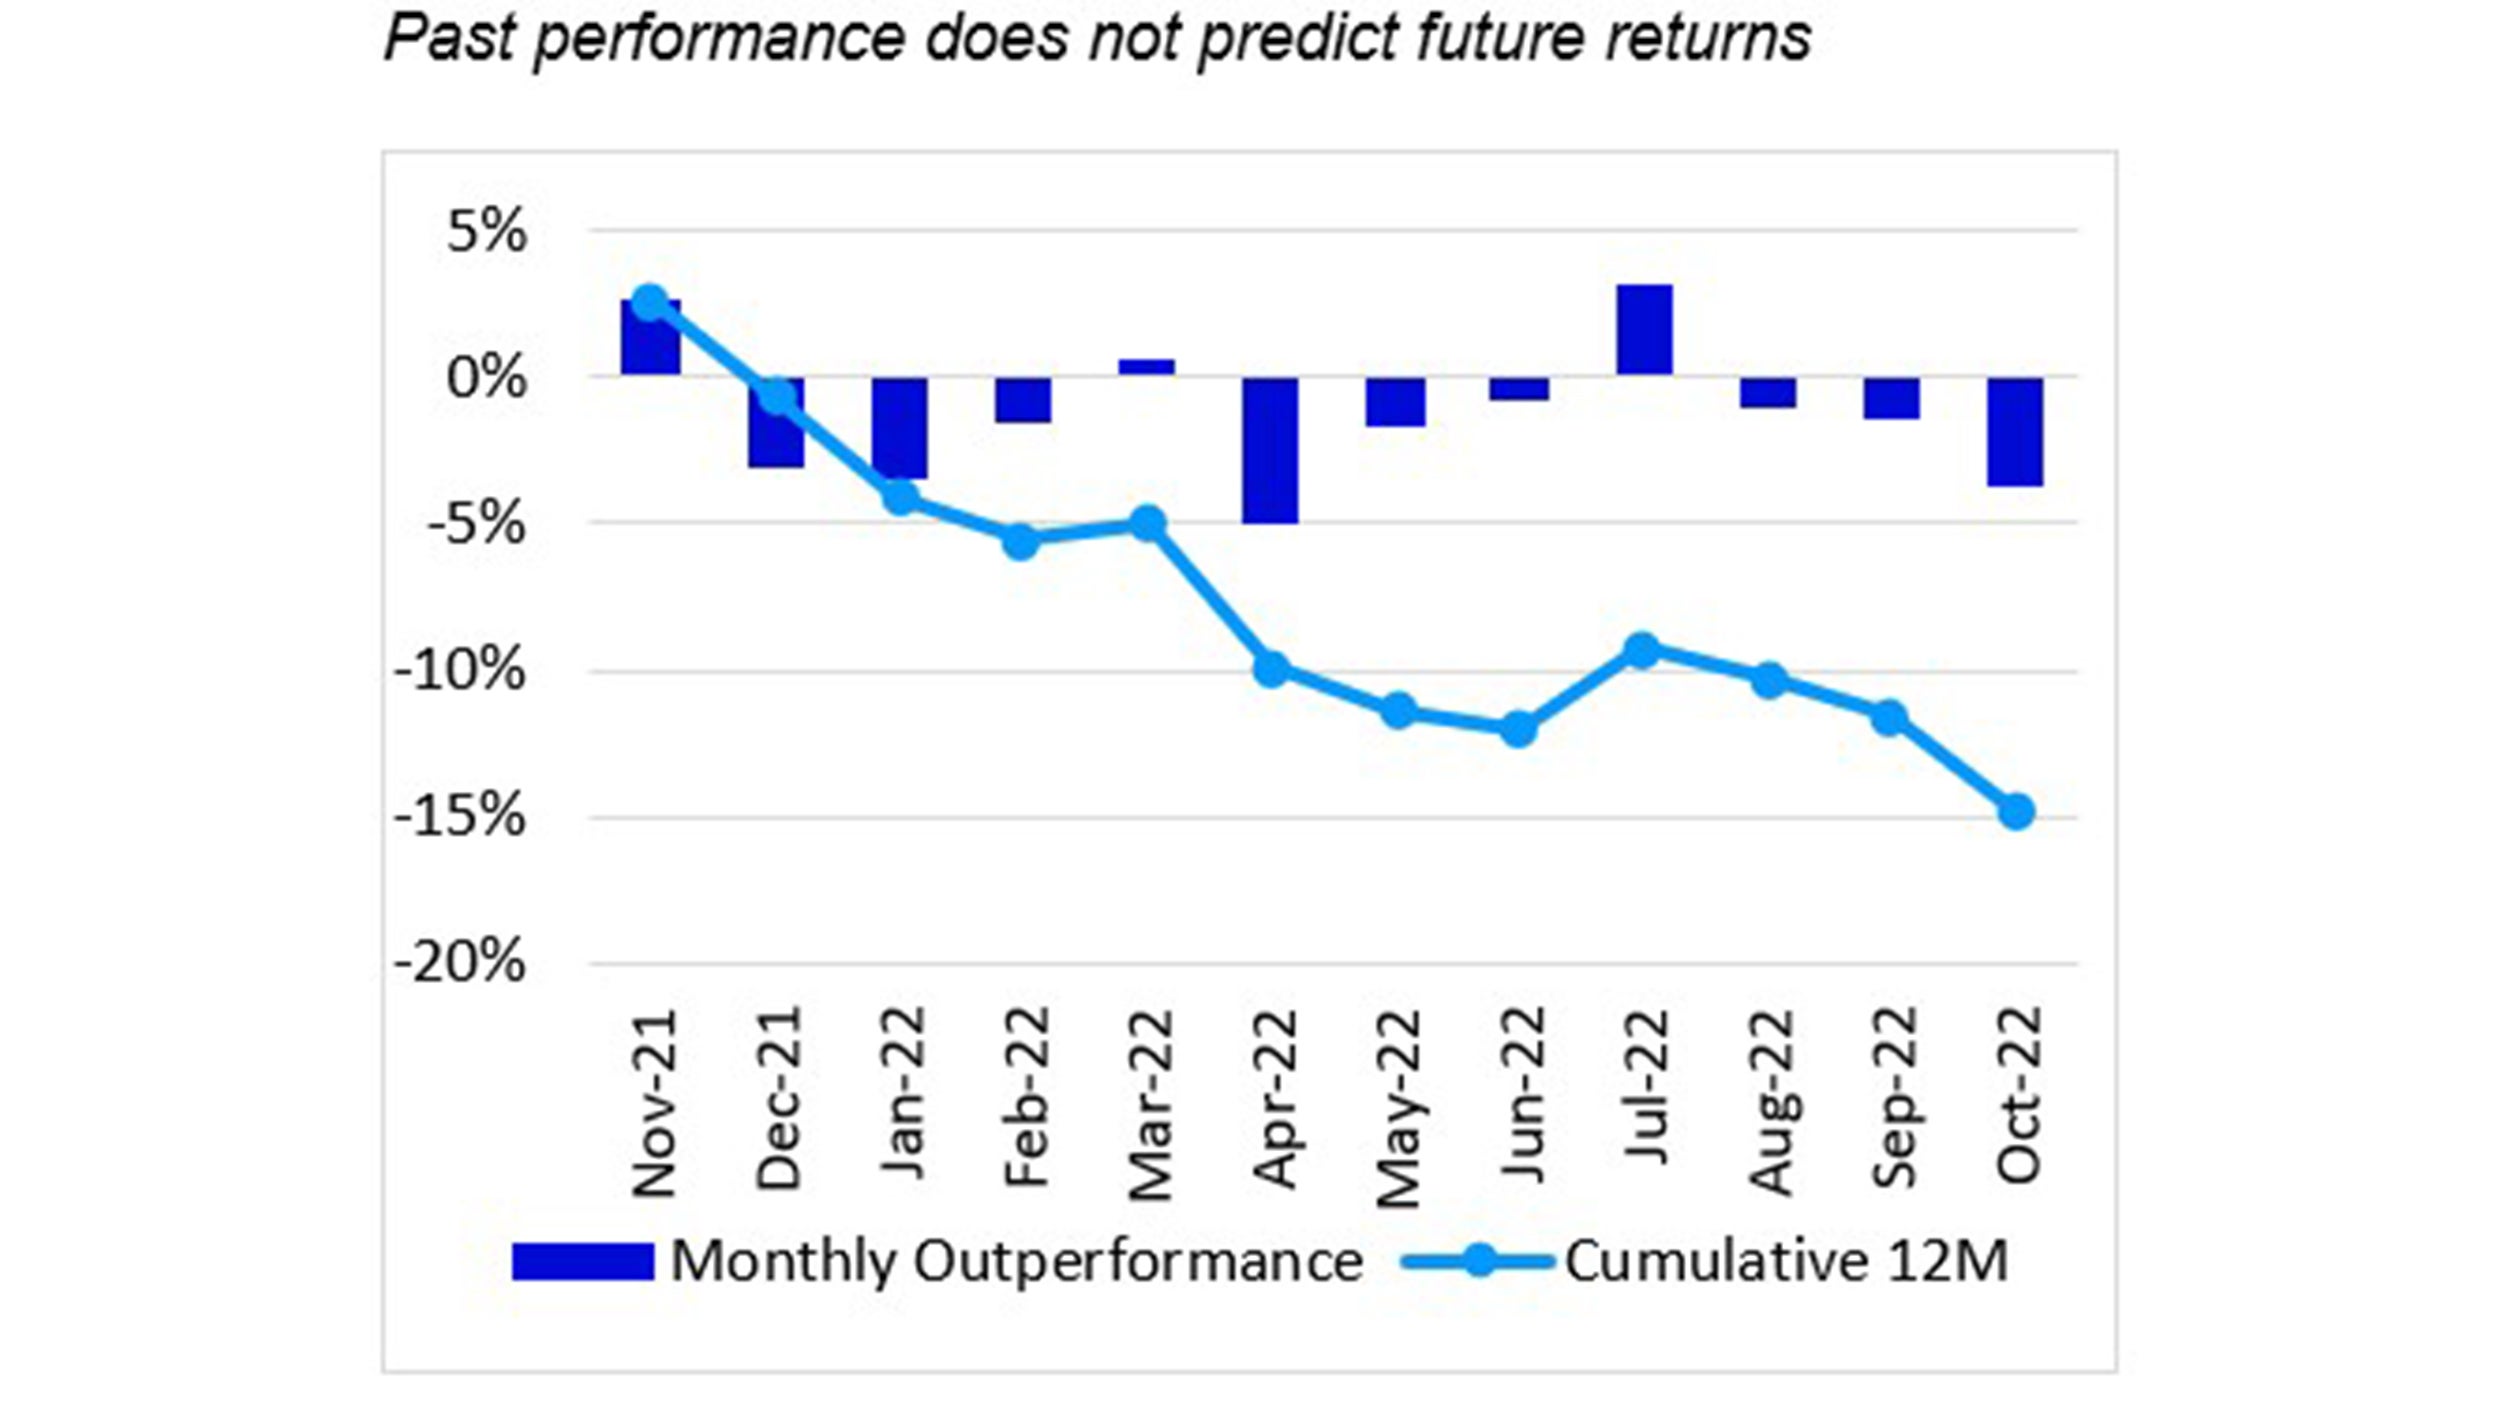
For the month of October, the Nasdaq 100 Index (NDX) returned 4.0%, underperforming the S&P 500 Index which returned 8.1%. The pullback that started in the middle of August came to an abrupt reversal on October 13th. The NASDAQ 100 Index set a new intraday 52-week low on this day but reversed as investors pushed the index up 5.7% off the low for the day. The subsequent rally was led by value-oriented companies as the Russell 1000 Value Index outperformed the S&P 500 Index by nearly 3% from the October lows through the end of the month. Despite continued uncertainty surrounding the current macroeconomic picture, earnings announcements from many companies came in better than expected and contributed to the move upwards in equities.
The most recent reading of the Consumer Price Index (CPI) was announced on October 13th and showed that year-over-year inflation remained near 40-year highs. The reading came in at 8.2%, higher than the expectation of 8.1%. The primary components of the CPI reading saw energy and commodities contract month-over-month, while the cost of services increased. Overall, the CPI reading dropped from 8.2% to 8.1% but the reading was not as low as investors had hoped. The reading caused the market to open lower on the 13th before the reversal to the upside took hold. This change proved to be the beginning of the positive performance we saw for the month.
Companies began to release calendar Q3 earnings during the month and were watched closely by investors to gain insight into the prospects of future growth from companies in Q4 and beyond. While many of the largest tech-focused companies reported disappointing revenue or earnings, investors reacted positively to several the announcements outside of the “Big Tech” names. This was especially seen within Mid and Small-Cap companies. Many of the companies that had notable earnings-per-share announcements were in the Energy sector.
Index performance
| 1M | YTD | 1Y | 10Y(ann.) | |
|---|---|---|---|---|
NASDAQ-100 |
4.0% | -29.8% | -27.6% | 16.6% |
| S&P 500 | 8.1% | -18.0% | -15.0% | 12.1% |
Relative |
-3.8% | -14.4% | -14.9% | 4.0% |
Source: Bloomberg as of 31 Oct 2022.
Returns may increase or decrease as a result of current fluctuations. An investment cannot be made directly into an index.

Source: Bloomberg as of 31 Oct 2022.
Returns may increase or decrease as a result of current fluctuations. An investment cannot be made directly into an index.

Data: Invesco, FactSet Data as of 31 Oct 2022. Data in USD. Returns may increase or decrease as a result of currency fluctuations.
Nasdaq 100 Performance Drivers
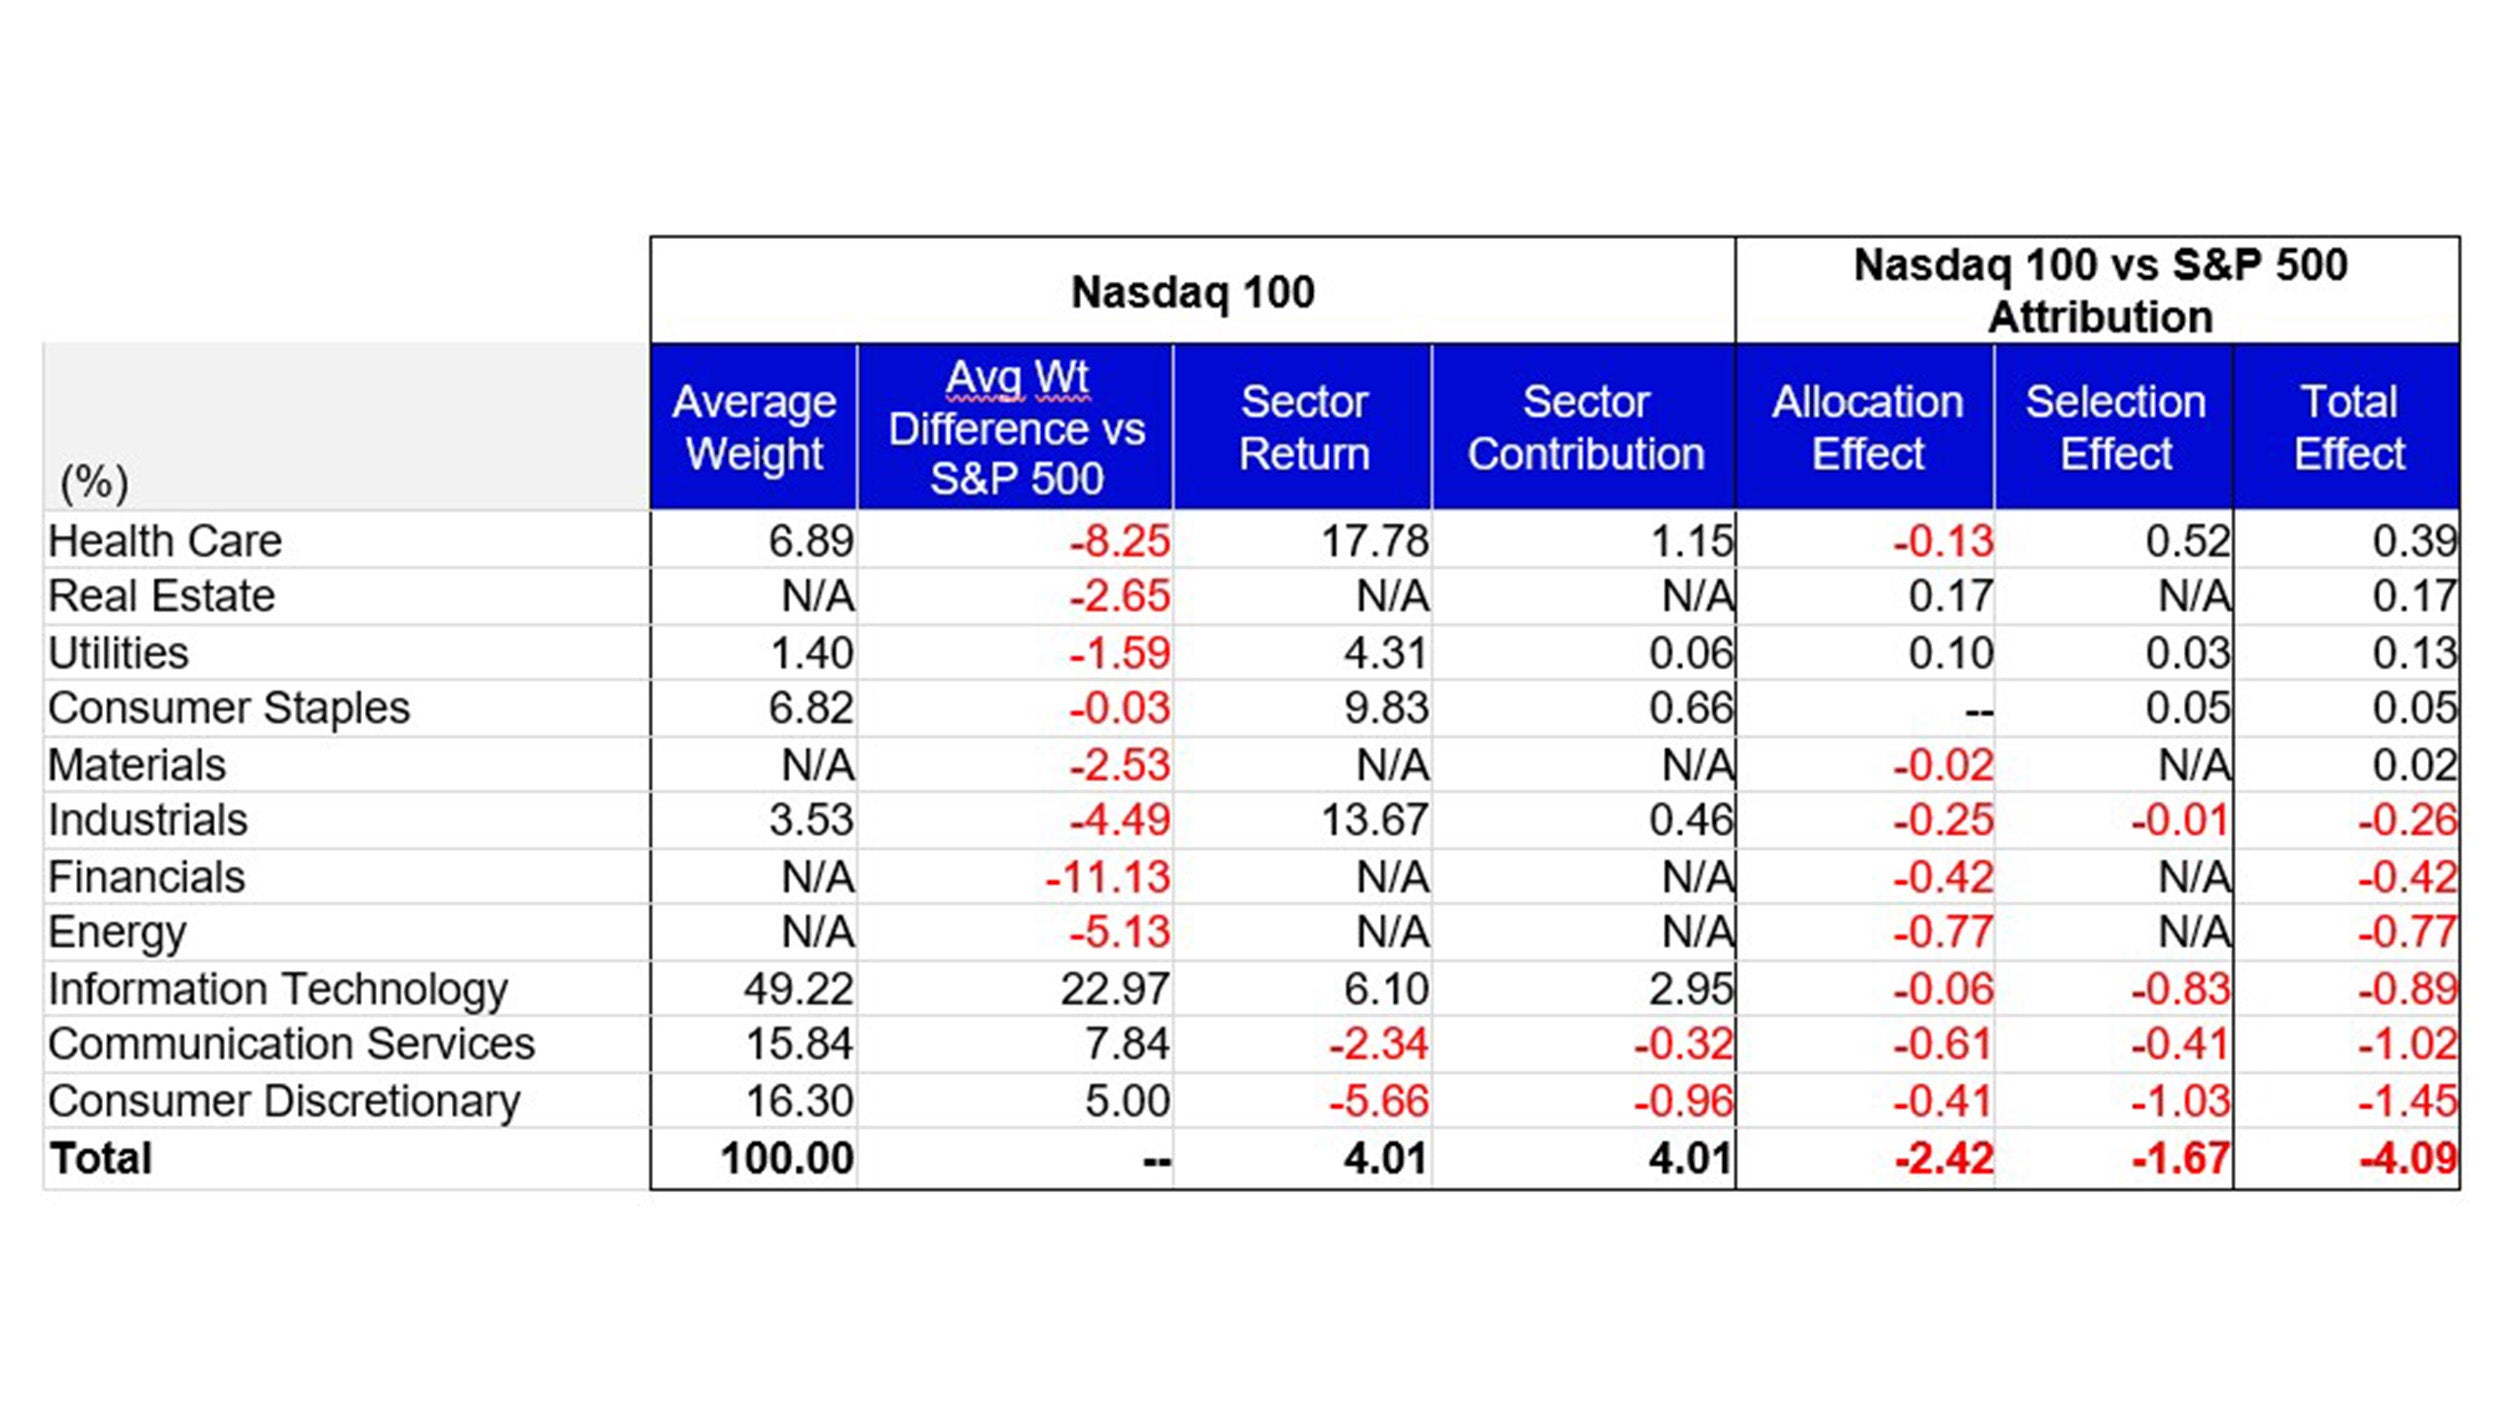
October performance attribution of the Nasdaq 100 vs the S&P 500 Index
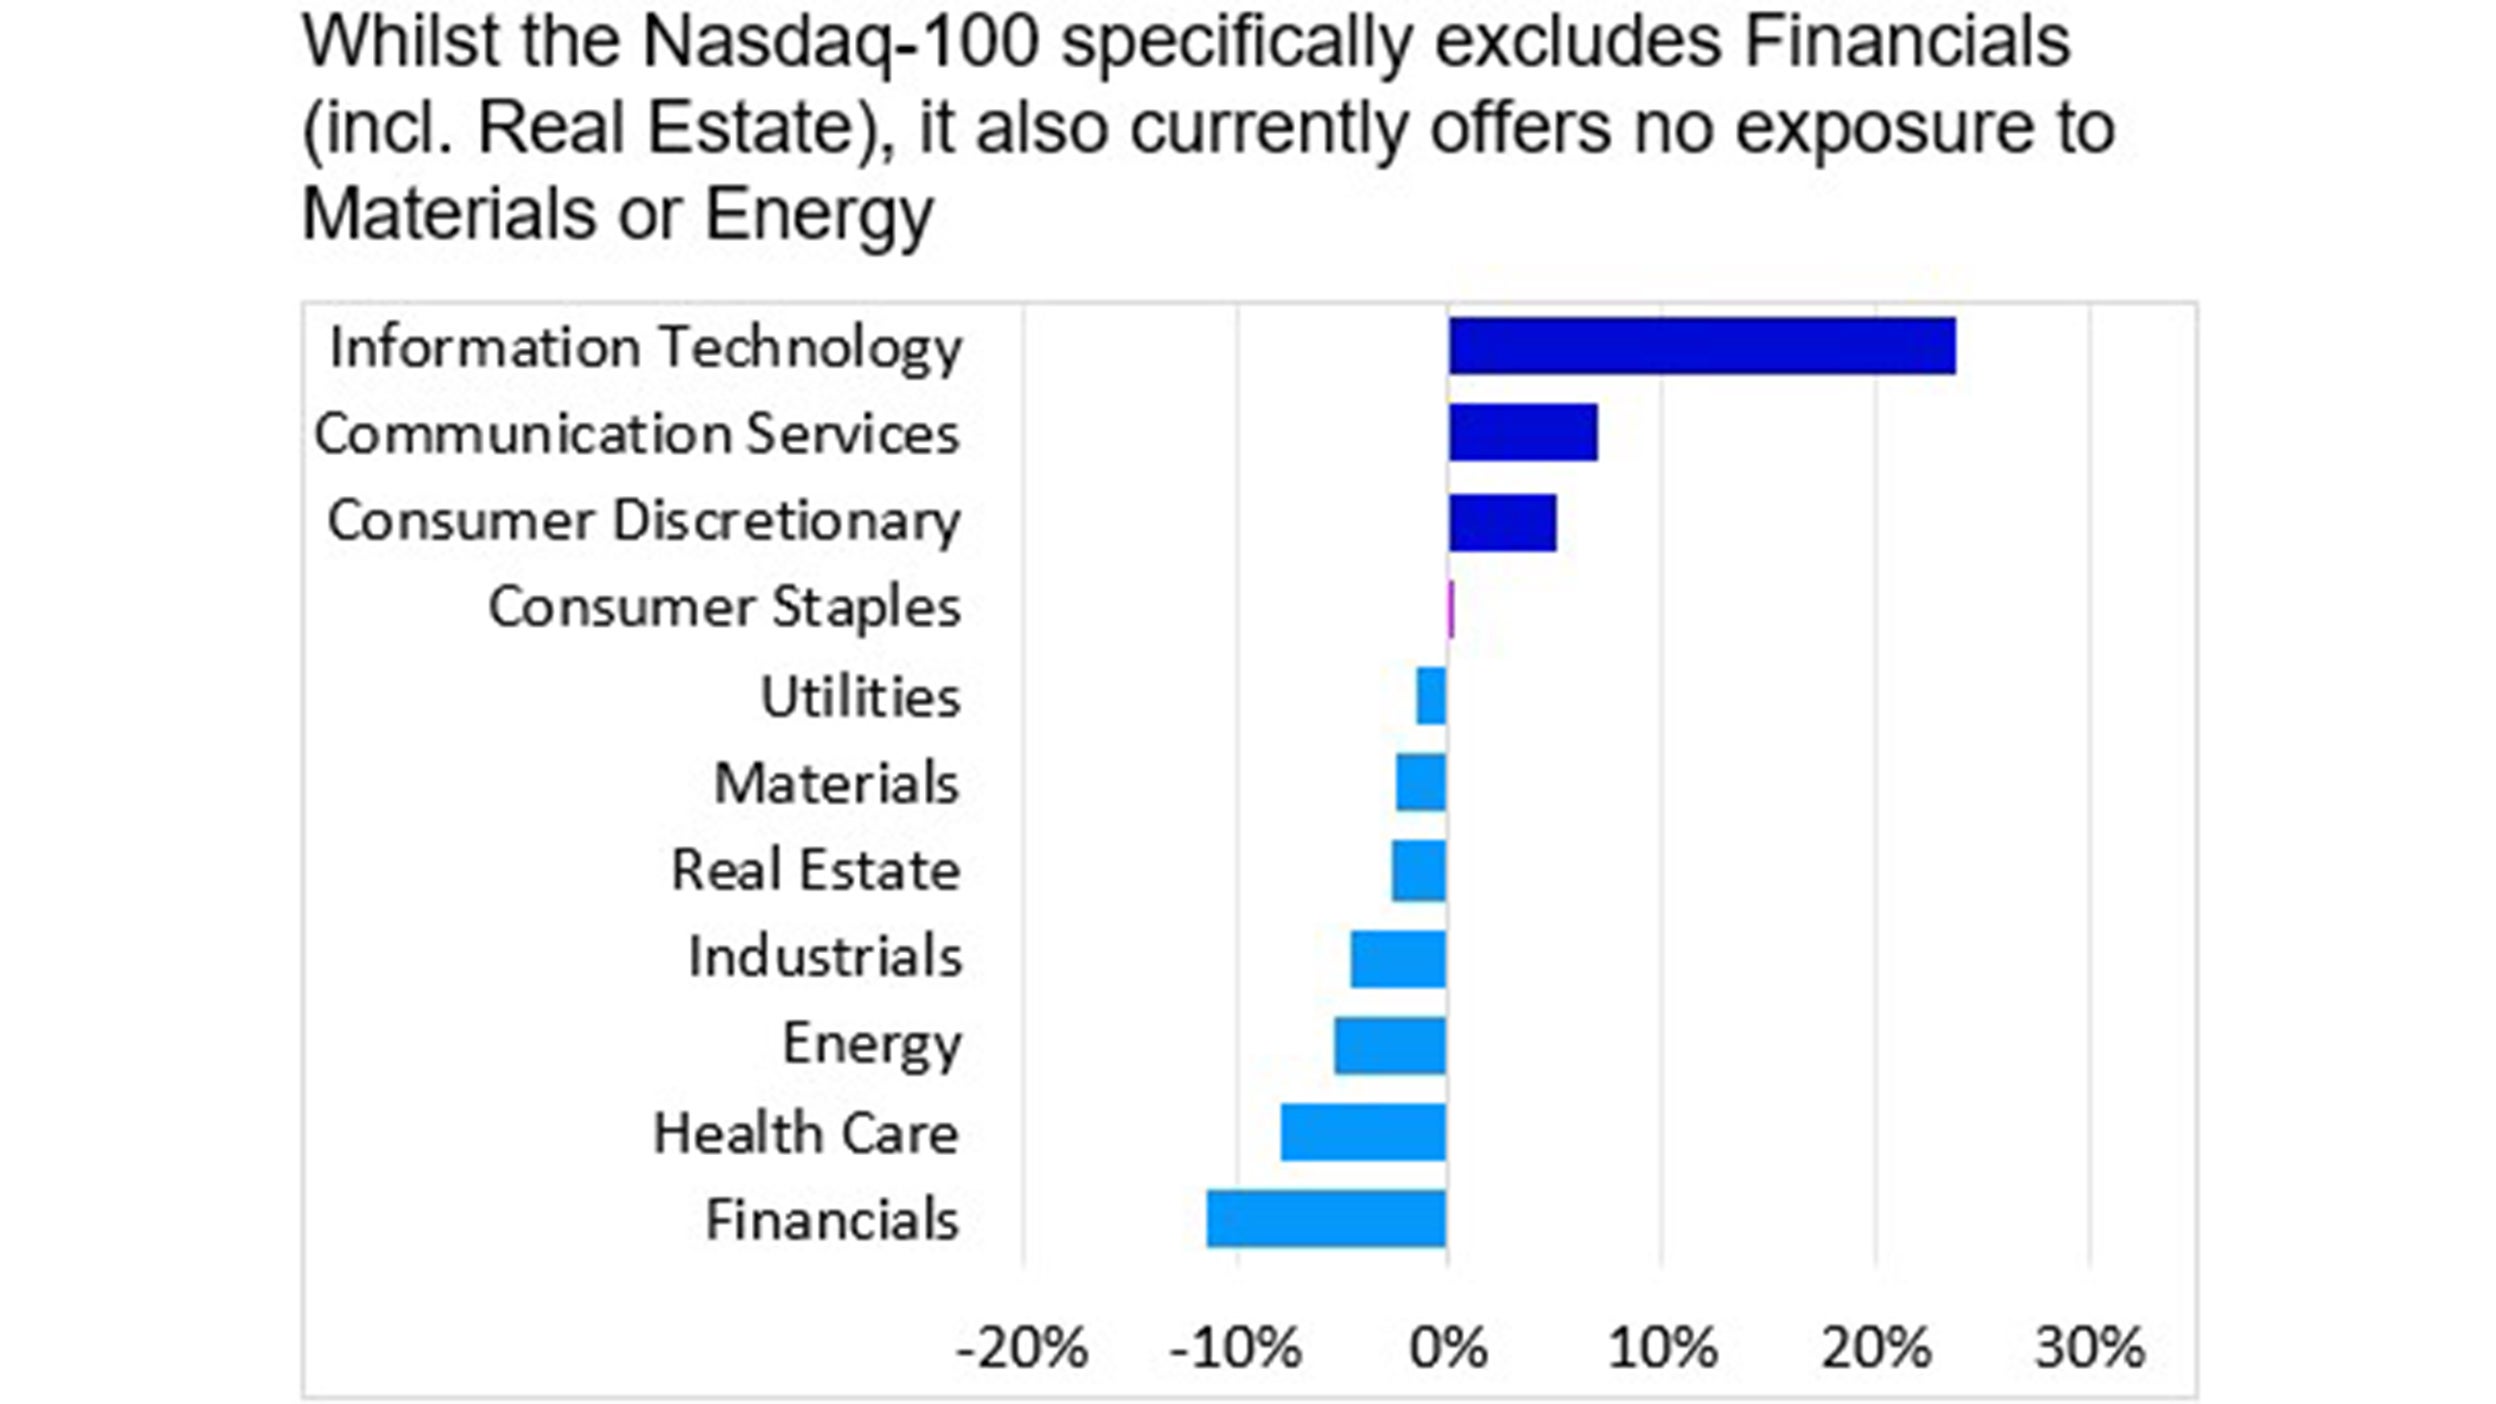
For the month of October, the Nasdaq 100 finished positive, but underperformed the S&P 500 by 380 bps. From a sector perspective, Health Care, Industrials, and Consumer Staples were the best performing sectors in the NASDAQ 100 and returned 17.78%, 13.67% and 9.83%, respectively. NDX’s underperformance versus the S&P 500 was largely driven by its overweight exposure and differentiated holdings in the Consumer Discretionary sector. NDX’s Communication Services overweight exposure and differentiated holdings also detracted from relative performance.

Data: Invesco, FactSet, as of 31 Oct 2022. Data in USD.
Investment Risks
The value of investments and any income will fluctuate (this may partly be the result of exchange rate fluctuations) and investors may not get back the full amount invested.


