Nasdaq 100 Index – Commentary - January 2024

US Market Recap
Investors shifted focus from Small-cap equities back to Large-Cap Growth in January, a trend seen for most of 2023. Major equity indices were relatively flat for most of the month until earnings started to be announced during the third week of the month. Investors paid close attention to economic releases throughout January with particular focus on results from the first Federal Open Market Committee (FOMC) meeting of the year that concluded on the last day of the month.
The FOMC met over January 30th and 31st and decided not to change the target range for the Fed Funds Rate. It was expected that the committee would keep the range between 5.25% and 5.50% where it has been since July 2023. Overall, this was interpreted as hawkish and that the FOMC would not be lowering rates as quickly as initially speculated. This was confirmed by Powell during his press conference where he stated that it was unlikely the committee would be cutting rates at the next meeting in March. Earlier in the month, Fed Fund Futures on Bloomberg showed that investors believed there was over a 70% chance of the first rate cut arriving in March. Following the meeting Fed Fund Futures moved lower to 35%. Despite the hawkish comments, Powell did state that inflation has moved down in a meaningful way since its peak in 2022. He also referenced that employment has remained healthy and that the economy has not slowed to raise concern.
The first reading of US Q4 Gross Domestic Product (GDP) was released on the 25th and surprised markets to the upside. The annualized quarter-over-quarter reading was reported at 3.3%, higher than the 2.0% expectation. Similar to Q3 of 2023, Personal Consumption Expenditures continued to be the largest component of growth for GDP. This was followed by Government Consumption Expenditures and then Net Exports. The largest decrease seen from Q3 came within the Change in Private Inventories.
The December year-over-year US Consumer Price Index (CPI) reading was announced on the 11th and came in higher than expected at 3.4%. Analysts were expecting 3.2% which still would have been higher than the prior month’s reading of 3.1%. The increase in the cost of Services continued to be the primary component of year-over-year inflation while the cost of Energy continued its decline. Month-over-month CPI was 0.3%, higher than the prior reading of 0.1% and the analysts’ estimate of 0.2%. The reading showed a decrease in the cost of Energy but was offset by rising costs in Services, Core Goods and Food.
Index performance
Past performance does not predict future returns.
| 1M | YTD | 1Y | 10Y(ann.) | |
|---|---|---|---|---|
NASDAQ-100 |
1.9% | 1.9% | 42.4% | 18.0% |
| S&P 500 | 1.7% | 1.7% | 20.2% | 12.0% |
Relative |
0.2% | 0.2% | 18.5% | 5.4% |
Source: Bloomberg as of 31 Jan 2024.
An investment cannot be made directly into an index.

Source: Bloomberg as of 31 Jan 2024.
An investment cannot be made directly into an index.

Data: Invesco, FactSet as of 31 Jan 2024. Data in USD
Nasdaq 100 Performance Drivers
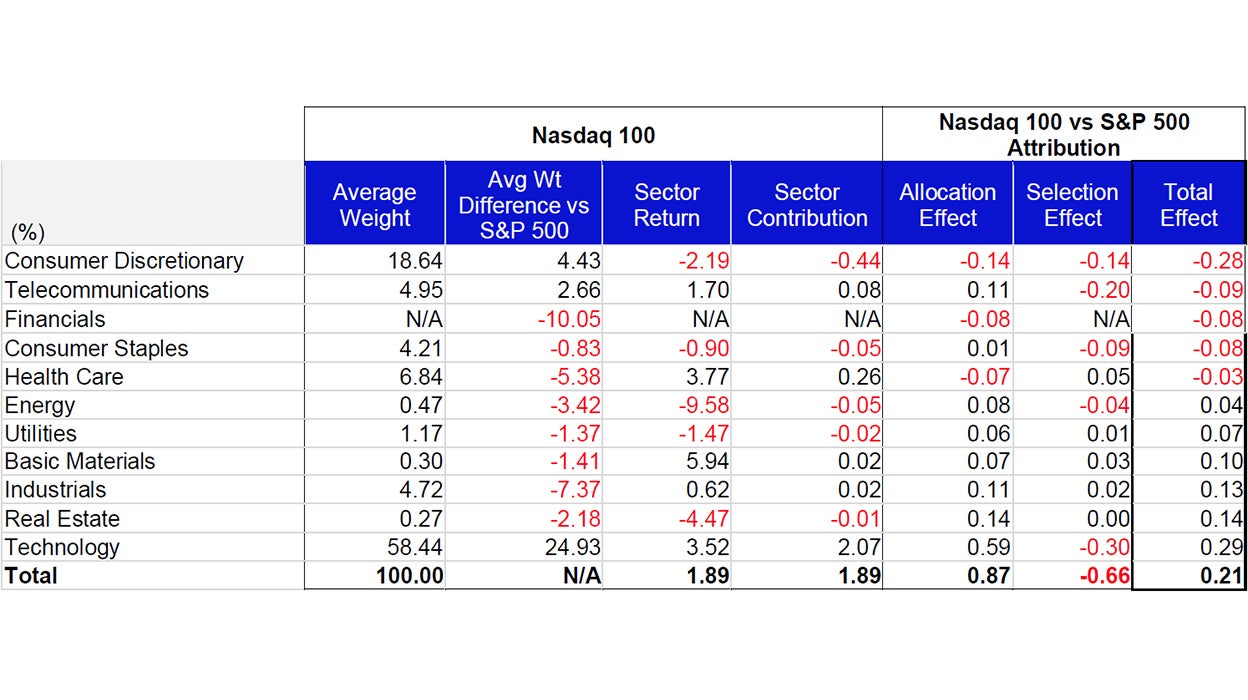
January’s performance attribution of the Nasdaq 100 (NDX) vs the S&P 500 Index
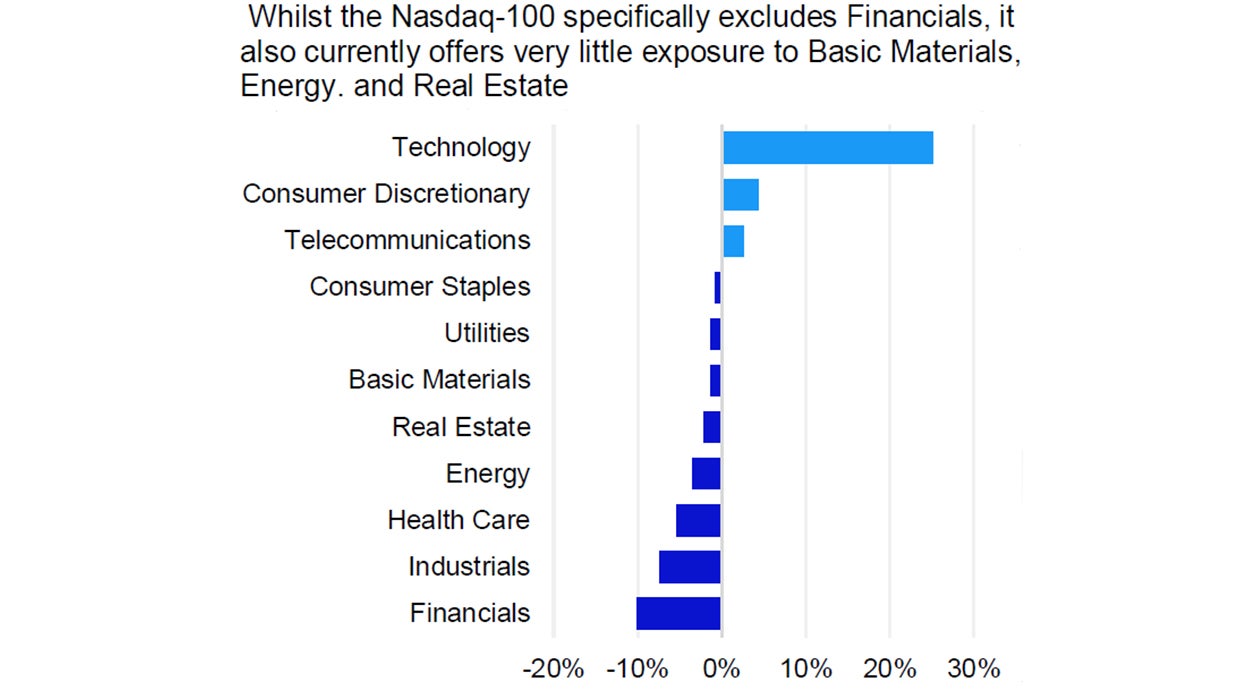
From a sector perspective, Basic Materials, Health Care and Technology were the best performing sectors in NDX and returned 5.94%, 3.77% and 3.52%, respectively. During the month, these three sectors had average weights of 0.30%, 6.84% and 58.44%, respectively. The bottom performing sectors in NDX were Energy, Real Estate and Consumer Discretionary with average weights of 0.47%, 0.27% and 18.64%, respectively. Energy returned -9.58%, Real Estate returned -4.47% while Consumer Discretionary returned -2.19%.
NDX’s outperformance vs. the S&P 500 was driven by its overweight exposure in the Technology sector. Despite being a bottom performing sector, the index’s underweight exposure to the Real Estate sector also contributed to relative performance. Underweight exposure and differentiated holdings to the Industrials sector was the third contributor to relative performance vs. the S&P 500. The Consumer Discretionary sector detracted the most from relative performance and was driven by its overweight exposure and differentiated holdings. Differentiated holdings in the Telecommunications sector, along with its differentiated holdings in the Consumer Staples sector also detracted from relative performance to the S&P 500.
NDX Contributor/Detractor Spotlight: Tesla’s stock was down over 15% prior to its earnings announcement on the 24th and proceeded to drop another 9% due to poor results and lower future guidance. The electric vehicle company missed on both revenue and adjusted earnings-per-share. Revenue was expected to come in at $25.60 billion but was reported at $25.17 billion and illustrated the effects of the price reductions made over the previous quarter. Adjusted earnings-per-share were reported at $0.71 vs. the $0.73 expectation. Tesla noted that vehicle volume growth “may be notably lower” in 2024.

Data: Invesco, FactSet, as of 31 Jan 2024 Data in USD. Sectors: ICB Classification. All figures in percentage terms. Market allocation effect shows the excess contribution due to sector/market allocation. A positive allocation effect implies that the choice of sector weights in the portfolio added value to the portfolio contribution with respect to the benchmark and vice versa. Selection effect shows the excess contribution due to security selection. A positive selection effect implies that the choice of stocks in the portfolio added value to the portfolio contribution with respect to the benchmark and vice versa. Total effect is the difference in contribution between the benchmark and portfolio.

Source: Bloomberg, as of 31 Jan 2024. Past performance does not predict future returns. Top and bottom performers for the month by relative performance. Holdings are subject to change and are not buy/sell recommendations.

Data: Invesco, Bloomberg, as of 31 Jan 2024. Data in USD.
Investment Risks
The value of investments and any income will fluctuate (this may partly be the result of exchange rate fluctuations) and investors may not get back the full amount invested.
Investments focused in a particular sector, such as technology, are subject to greater risk, and are more greatly impacted by market volatility, than more diversified investments.


