The basics of alternative investments - Part 3: What to expect from performance of alternatives

Welcome to the third installment in my summer blog series covering the basics of investing in alternative investments, with an emphasis on those alternatives available via mutual funds. Having covered the topics of what alternative investments are and why investors should consider alternatives, this post will focus on what investors should expect from a performance standpoint.
What to expect from performance of alternatives
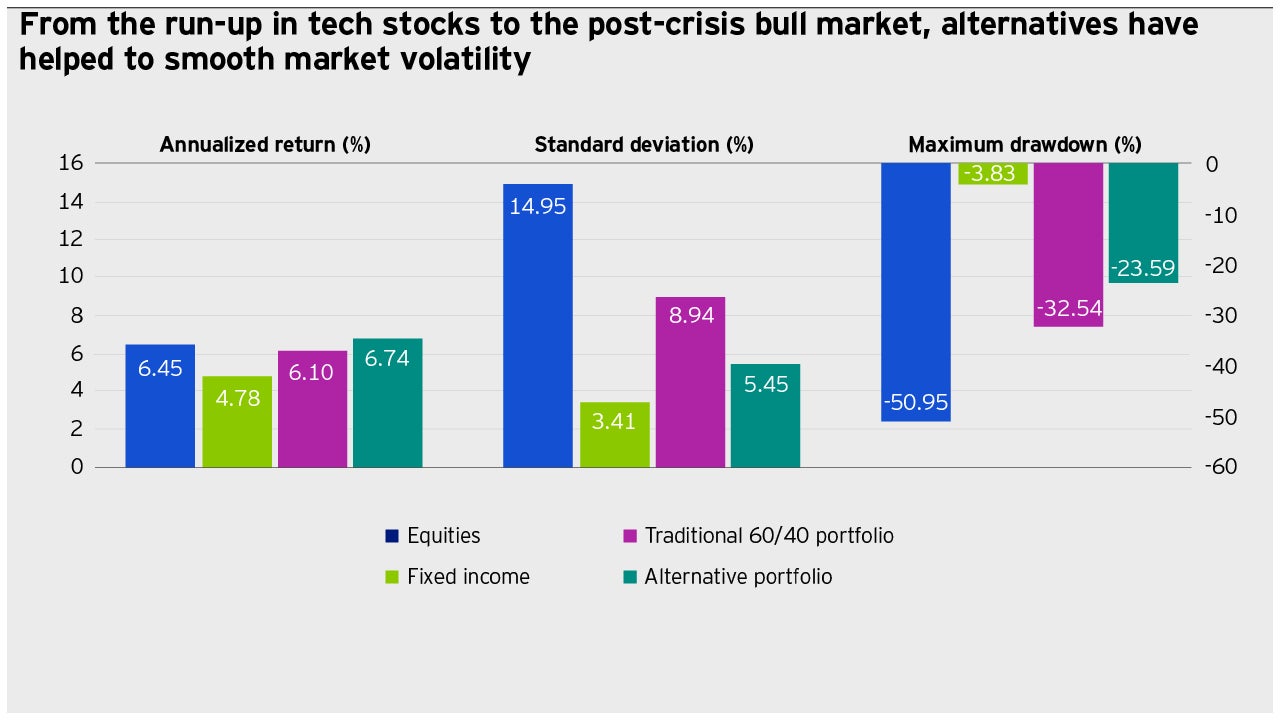
In my previous post, I used the below chart1 to compare the historical performance of alternatives2 to that of equities, fixed income and the traditional 60% stock/40% bond portfolio.

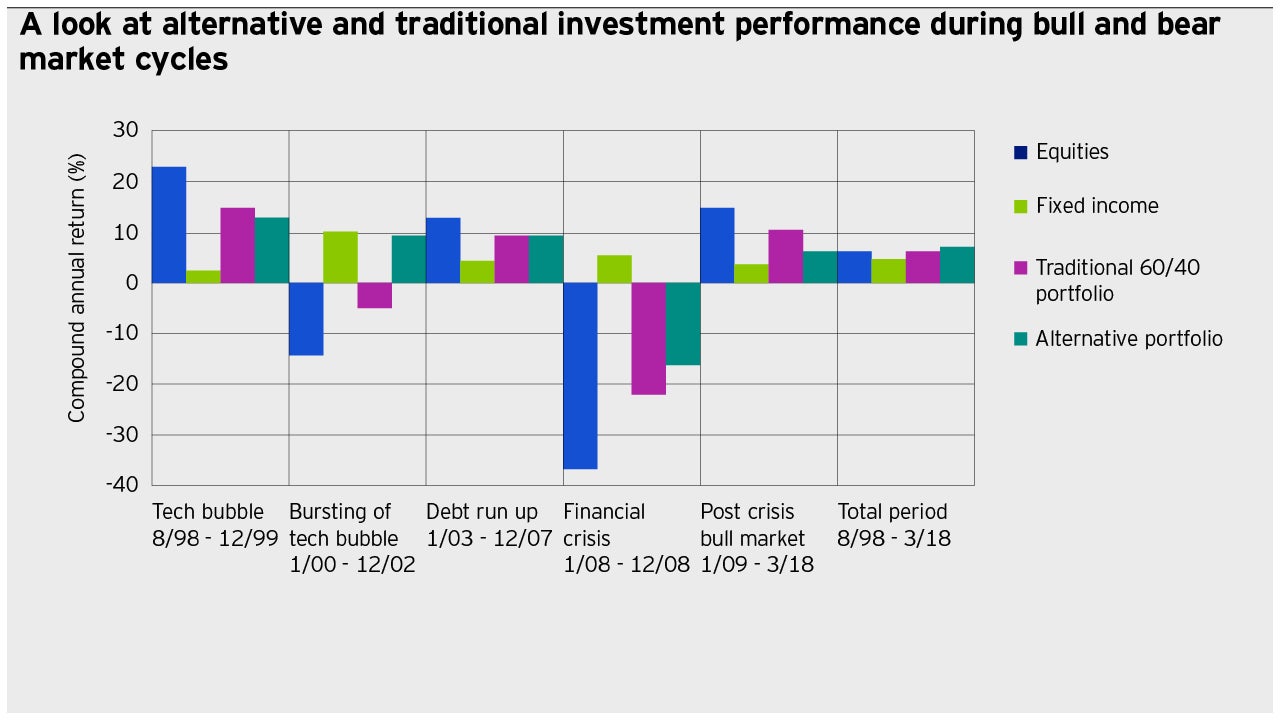
The chart does a good job comparing the long term returns and key risk measures of alternatives to that of traditional investments. That said, the one shortcoming of the chart is that it doesn’t show how alternatives perform in different equity market environments. As a result, an investor looking only at this chart might very well come away with the impression that they should expect alternatives to generate similar returns to equities in all parts of the market cycle. That impression and expectation would be false, as alternatives have historically performed differently than equities during various parts of the market cycle. For this reason, it is important to drill down further and examine performance during the different phases of the market cycle, as illustrated in the chart below3.

When comparing the performance of alternatives to stocks during different parts of the market cycle, it becomes clear that there is a “tortoise and hare” relationship between the two. During bull-market periods, alternatives have historically generated positive returns, but those returns lagged those of stocks. During bear-market periods, alternatives have historically generated superior returns relative to stocks. In some bear market periods, such as when the tech bubble burst in the early 2000s, alternatives generated positive returns, while in other periods, such as during the Great Financial Crisis in 2008, alternatives had negative returns, but the returns were less negative than that of stocks.
Returning to the “tortoise and hare” analogy, alternatives are a bit like the tortoise, taking a slow and steady approach by generating consistent and less volatile returns than stocks. Stocks are more like the hare in that they can generate significant returns quickly, but can also experience sharp periods of negative performance. Only when combining both parts of the market cycle do the returns for equities and alternatives end up in a similar place.
For investors considering alternatives, it is critical that they understand the nature of returns during different parts of the market cycle. Specifically, they should expect alternatives to underperform equities during periods of equity strength and to outperform equities during periods of equity weakness, while in the long term generating returns similar to that of equities.
1Source: Invesco, August 1998– March 2018. Past performance is not a guarantee of future results. Investments cannot be made directly into an index. Alternatives portfolio is represented by a portfolio consisting of: 20% Inflation-hedging assets; 20% Principal preservation strategies; 20% Portfolio diversification strategies; 20% Equity diversification strategies; 20% Fixed income diversification strategies. Traditional 60/40 Portfolio is represented by 60% S&P 500 Index and 40% Bloomberg Barclays US Aggregate Bond Index. Equities are represented by the S&P 500. Fixed Income is represented by the Barclays U.S. Aggregate Bond Index. 20% Inflation-hedging assets are represented by 15% FTSE NAREIT US Real Estate Index Series, All Equity REITs and 5% Bloomberg Commodity Index. The 15%/5% split reflects Invesco’s belief that investors tend to invest in strategies with which they are more familiar. 20% Principal preservation strategies are represented by the BarclayHedge Equity Market Neutral Index. 20% Portfolio diversification strategies are represented by 12% BarclayHedge Global Macro Index and 8% BarclayHedge Multi-Strategy Index. Multistrategy is underweighted in this example due to its potential overlap with global macro. 20% Equity diversification strategies are represented by the BarclayHedge Long/Short Index. 20% Fixed income diversification strategies are represented by the 20% BarclayHedge Fixed Income Arbitrage Index; N/A% S&P/LSTA US Leveraged Loan Index. Data for the Leveraged Loan index became available on Aug 20, 2001, and is not included.
2For purposes of this analysis, only the performance of liquid alternatives is included. The reason for this is that liquid alternatives are widely available to all investor types. In contrast, illiquid alternatives (e.g. private equity, venture capital, direct real estate, etc.) are only available to high net worth and institutional investors and are not available to retail investors.
3See footnote 1 above.


