Private markets through an outcome-oriented lens: Income

This is the second of a four-part blog series on looking at private markets through an outcome-oriented lens. Understanding the sources of return, risk, and diversification for private assets, and how it fits into a traditional portfolio is the first step toward full public and private portfolio integration. In this blog we discuss practical steps toward income-enhancement through private markets. In subsequent blogs we will delve deeper into the practicalities of incorporating private markets into portfolios with the other two major investment outcomes in mind: growth and real return.
As we enter the mid-year mark and continue our discussion on implementing private markets exposure through an outcome-oriented lens, this month’s piece will focus on income. Given the recent move by the U.S. Federal Reserve to pause interest rate hikes but leave the window open for multiple hikes later in 2023, investors continue to think through the income-generating assets in their portfolios to ensure alignment with the constantly shifting environment. One particular risk that remains is the continued upside to interest rates, which further reinforces the efficacy of private markets to both enhance income and diversify portfolios while also protecting against rising rates.
When engaging with investors globally, and specifically in Asia, the topic of income is front and center. We spent the first half of 2023 walking investors through pathways to diversifying portfolios and enhancing income utilizing traditional fixed income asset classes, but wanted to devote some time to discussing private markets applications and laying out our framework for portfolio construction. It’s fairly evident to investors that private markets are playing a more central role in portfolios, but the question of how to effectively construct private markets portfolios while targeting specific outcomes remains a less covered topic due to its inherent complexity. Our objective is to unpack this process and discuss practical steps toward income-enhancement through private markets.
While the topic of private credit has gained considerable traction in recent years, it’s important to discuss the specific components of this category. Investors often associate private credit with first lien direct lending, which is undoubtedly a key category underneath this broader umbrella, but it is only one of many sub-asset classes that complete this category. Real estate debt, infrastructure debt, mezzanine finance, and alternative credit such as medical royalties, aircraft leases, and niche financing opportunities can all be classified as private credit. Our view is that effectively combining these unique sub-asset classes can create substantially improved portfolio income and diversification, both in comparison to a single private credit sub-asset class and traditional fixed income.
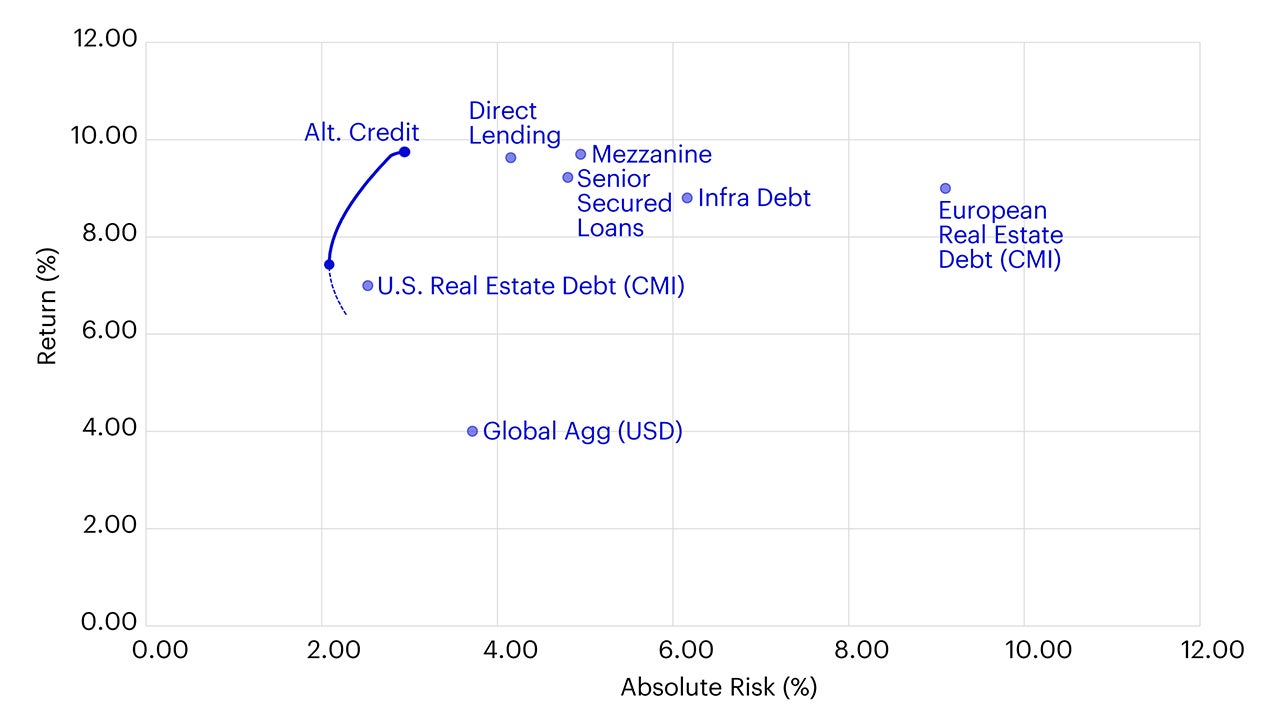
To do this, we leverage our long-term capital market assumptions and the Invesco Vision platform to construct portfolios which effectively balance return and risk and can be integrated into a traditional fixed income portfolio in a straightforward fashion. Let’s begin with the private credit allocation by inputting several sub-asset classes into a “multi-alternative income” universe, similar to how we’d construct a portfolio with traditional assets. We’ll start with an efficient frontier universe focused on the following assets: first lien direct lending, infrastructure debt, U.S. and European real estate debt, mezzanine debt, alternative credit, and senior secured loans.

Source: Invesco Vision, data as of 28 February 2023. Return estimates are based on the Q1 2023 Long-Term Capital Market Assumptions. These estimates are forward-looking, are not guarantees, and they involve risks, uncertainties, and assumptions.

Source: Invesco Vision, data as of 28 February 2023. These estimates are forward-looking, are not guarantees, and they involve risks, uncertainties, and assumptions.
As seen from the above frontier, the risk-return opportunities can vary greatly across sub-asset classes. This is also coupled with relatively low correlation between these assets (Table 1). We believe this diversification benefit is an integral reason why private markets income investors can look to broaden their opportunity set and focus on implementing multiple sub-asset classes or utilize vehicles which effectuate this. It is also evident that there are superior risk-return opportunities provided by private credit when compared to global aggregate bonds. As mentioned in last month’s piece, it is important to detail how return and risk are calculated. For return calculations, we leverage our long-term capital market assumptions, which span both public and private asset classes. Looking at risk, we actively adjust for the smoothed returns that can impact “realized” volatility, to increase alignment with public market volatility and allow for a more “like for like” comparison across asset classes.
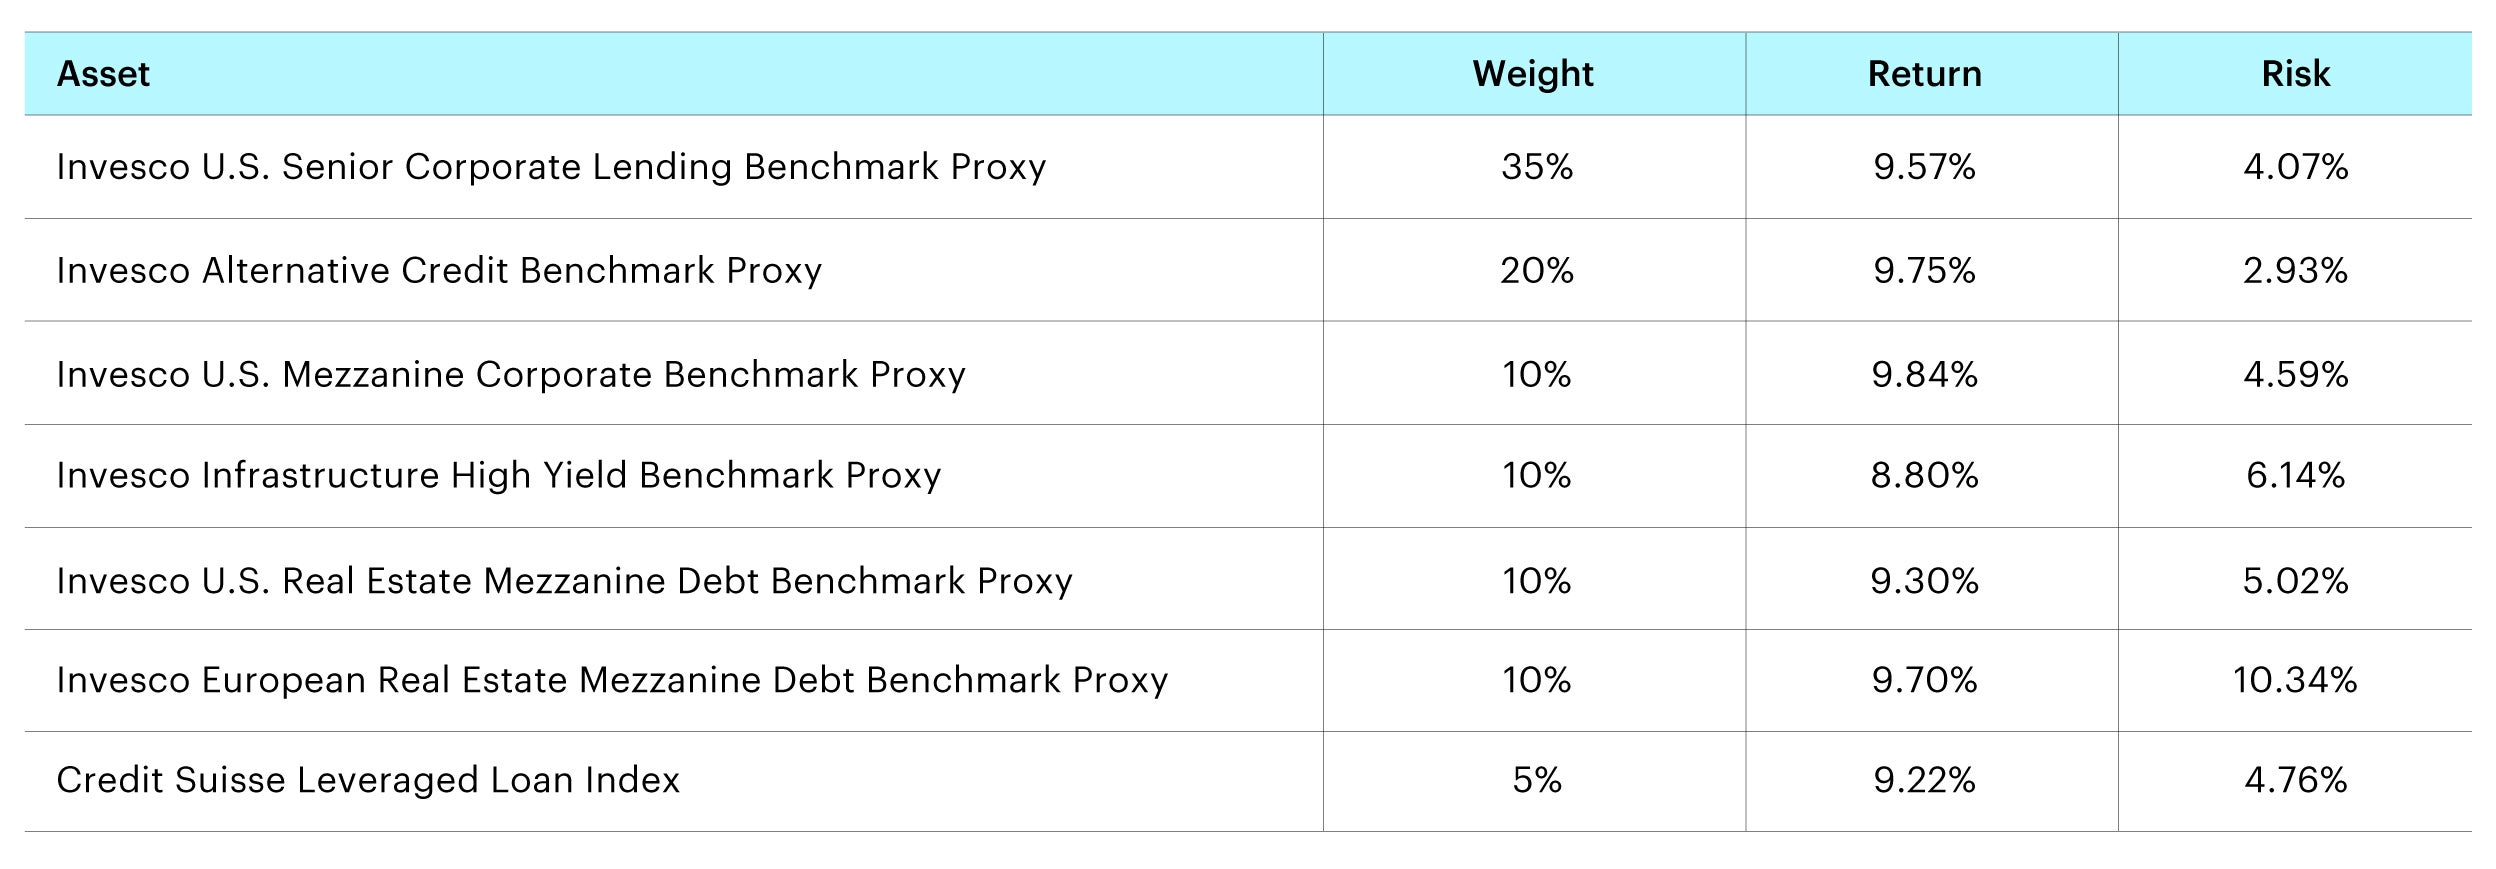
While we certainly would not argue for a complete replacement of traditional fixed income with private markets, the improved characteristics of these sub-asset classes warrant strong consideration for portfolio integration. However, the next step involves making sound allocation decisions across these private sub-asset classes to provide a portfolio with comparable risk to traditional fixed income, with meaningfully greater return prospects (to compensate for illiquidity) and improved diversification. Looking at the following private markets allocation, we have constructed something in-line with those expectations.
First lien direct lending: 35%
Infrastructure debt: 10%
European real estate debt (CMI): 10%
U.S. real estate debt (CMI): 10%
Mezzanine debt: 10%
Senior secured income (Liquidity sleeve): 5%

Source: Invesco Vision, data as of 28 February 2023. Return estimates are based on the Q1 2023 Long-Term Capital Market Assumptions. These estimates are forward-looking, are not guarantees, and they involve risks, uncertainties, and assumptions.
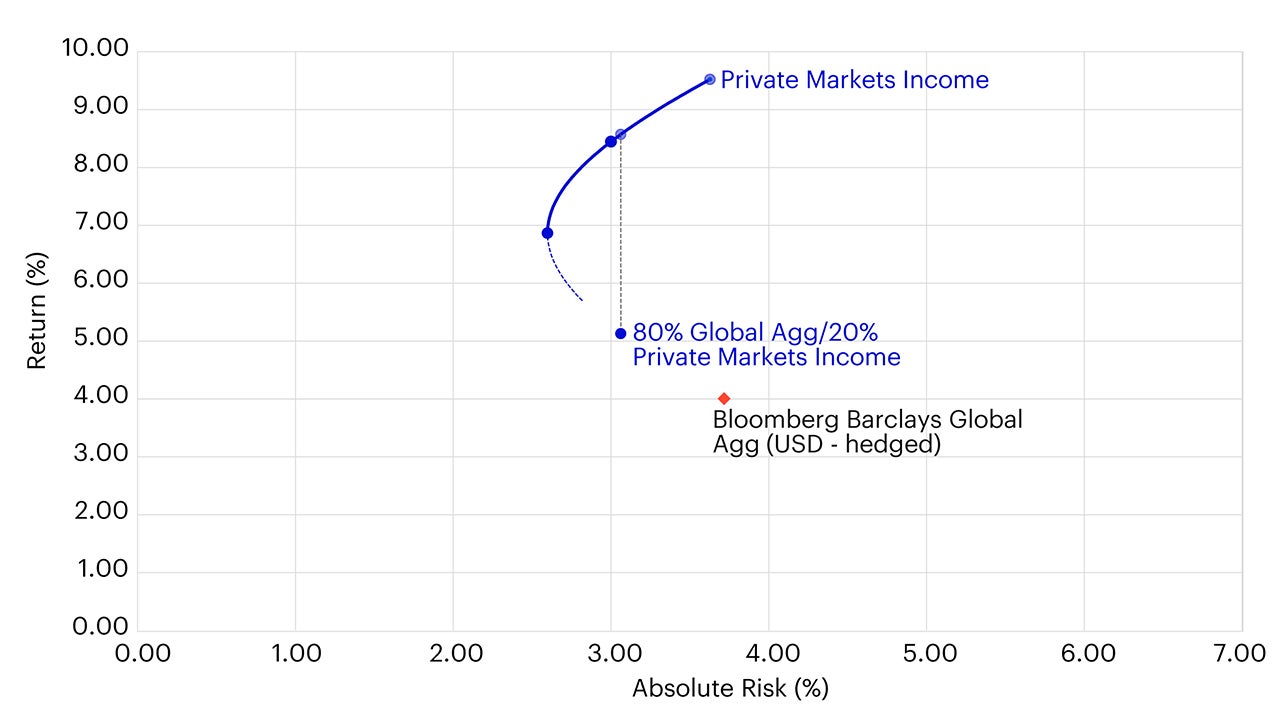
Looking at the Vision analysis, we consider the following allocation a single building block, titled “Private Markets Income”, in an efficient frontier universe with the Barclays Global Aggregate Bond Index (USD-hedged), along with aforementioned sample portfolio with an 80%/20% split. We review the following return/risk characteristics below:

Source: Invesco Vision, data as of 28 February 2023. These estimates are forward-looking, are not guarantees, and they involve risks, uncertainties, and assumptions.
Integrating private markets income into a traditional fixed income portfolio yields meaningful portfolio improvements, with the potential for increased return, risk, and diversification. The private and public sleeves of the portfolio maintain a 0.2 correlation with each other, which in an environment with considerable uncertainty around the path of interest rates, can provide investors with a viable source of diversification.
Summary
In sum, income can be greatly enhanced through private markets. While conceptually this notion is straightforward, important nuances arise when forecasting long-term private markets returns, understanding risk and how it differs from public markets and how to adjust for this, and how to build portfolios both within categories such as private credit and across public and private markets. Another point that is equally as important is having the appropriate private markets opportunity sourcing ecosystem to find superior building blocks to effectuate asset class-based views. We believe this should incorporate a diverse array of assets, and access to primary, secondary, and co-investments. To effectively execute this process in its entirety, we believe investors need to either maintain these capabilities themselves or leverage partners that can provide them by adopting an outcome-focused, client-centered approach.
Appendix

All data pulled from Invesco Vision as of 30 June 2023

All data pulled from Invesco Vision as of 30 June 2023
Investment risks
-
The value of investments and any income will fluctuate (this may partly be the result of exchange rate fluctuations) and investors may not get back the full amount invested.
Invesco Investment Solutions develops CMAs that provide long-term estimates for the behavior of major asset classes globally. The team is dedicated to designing outcome-oriented, multi-asset portfolios that meet the specific goals of investors. The assumptions, which are based on 5- and 10-year investment time horizons, are intended to guide these strategic asset class allocations. For each selected asset class, we develop assumptions for estimated return, estimated standard deviation of return (volatility), and estimated correlation with other asset classes. This information is not intended as a recommendation to invest in a specific asset class or strategy, or as a promise of future performance. Estimated returns are subject to uncertainty and errors and can be conditional on economic scenarios. In the event a particular scenario comes to pass, actual returns could be significantly higher or lower than these estimates.
Across a variety of alternative investment strategies, our objective is to capture the expected behavior of each strategy as represented by a broad proxy rather than a particular manager or fund. Granular data within private markets is difficult, and often impossible, to find. As such, we use objective, observable data from public proxies wherever possible as an input into our process; where data is not available, our alternatives specialists set forward-looking assumptions informed by their own experience.
Return assumptions vary by category. For Private equity, we use a building-block approach for US leveraged buyouts that captures earnings growth, valuation multiple expansion/contraction, fund leverage (and cost of financing), and fees to derive expected net returns. For other equity strategies such as venture capital, we compare historical returns to buyouts and then apply that difference to our forward-looking estimate for buyout returns on the assumption that return differences in the future will be consistent with the past.
Real Assets. For select real assets, namely Core US Real Estate and Core US Infrastructure, we utilize a building-block approach capturing rental income, maintenance CapEx, expected real income growth, expected inflation, expected valuation changes, leverage (and cost of financing), and fees to derive expected net returns. For other real assets, we utilize historical returns from NCREIF and Burgiss.
Private Credit. For most private credit proxies, we start with gross yields on underlying debt holdings and adjust for expected losses (based on historical averages), fund leverage (and cost of financing), and fees to derive expected net returns.
For a few private credit proxies, such as distressed debt, we utilize historical relationships to derive forward-looking assumptions as described above.
Approach to risk. A key principle of our risk methodology is to represent alternatives as a combination of both private and public exposures. This captures a distinct private element that is not correlated with traditional assets, while at the same time recognizing the underlying exposures themselves are often more public or traditional in nature. Taking private credit as an example, our methodology assumes exposure to a private debt factor as well as a public credit spread factor. The result is a private credit correlation with traditional assets that is greater than 0, but less than what would be suggested by public credit spread exposure alone. Because our Vision modeling platform extensively leverages the Barra framework, absolute risk for a number of alternative strategies is a byproduct of the Barra factor exposures. For alternative strategies not explicitly captured by Barra, we assume overall risk is consistent with history, with factors being mapped to the private and public factors that our alternatives specialists believe best represent the strategy.


