Private markets for Asian investors: Growth

This is the third of a four-part blog series on integrating private markets into Asian investor portfolios, while accounting for FX risk. The first blog in our series set the scene in terms of opportunities and challenges for Asian investors. The second blog in our series focused on private income investments, while this piece will focus on private growth. Our final blog will analyse real return opportunities.
As we continue the discussion on private markets for Asian investors, for this analysis we’ll focus specifically on growth investments. While we’ve discussed private growth investments in prior pieces, this series is geared toward Asian investors with specific local currency return considerations. We’ll continue our focus on analyzing the global interest rate regime and how this adds an additional layer of complexity to Asian investor’s portfolios. Ultimately, we expect that investors will need to deploy a wider investment opportunity set to meet this challenge, which will involve greater usage of private markets investments. However, as with any new investment, careful analysis is needed not only for selecting new investments but also implementing this exposure.
One meaningful shift from our last piece is around market expectations toward the path of Fed rate cuts. Market expectations have shifted toward a more dovish Fed policy, as inflation has moderated, and growth expectations have begun to decline. At this juncture, market participants have priced in at least two interest rates cuts, unlike in May when participants were predicting only one interest rate cut. We show the two graphs below to highlight the shift in market expectations, and ultimately discuss portfolio implications (Figure 1).
While the change in rate cut expectations might give Asian central banks a bit of “breathing room” for policy easing, it also creates a more obstacles if economic deceleration leads to a global recession. Also, if global central banks take cues from the Fed and ease simultaneously, one could argue that interest rate differentials will persist, which we’ve discussed at length in prior discussions on this topic.
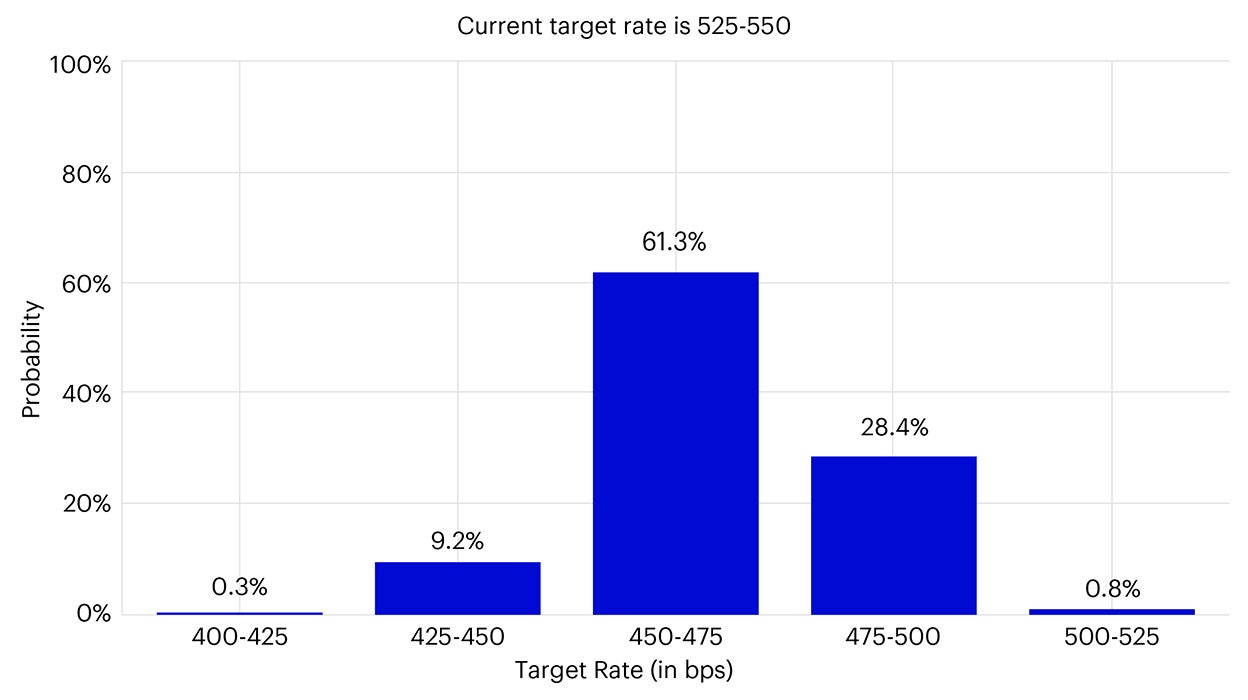
Source: CME Group, data as of 26 July 2024.
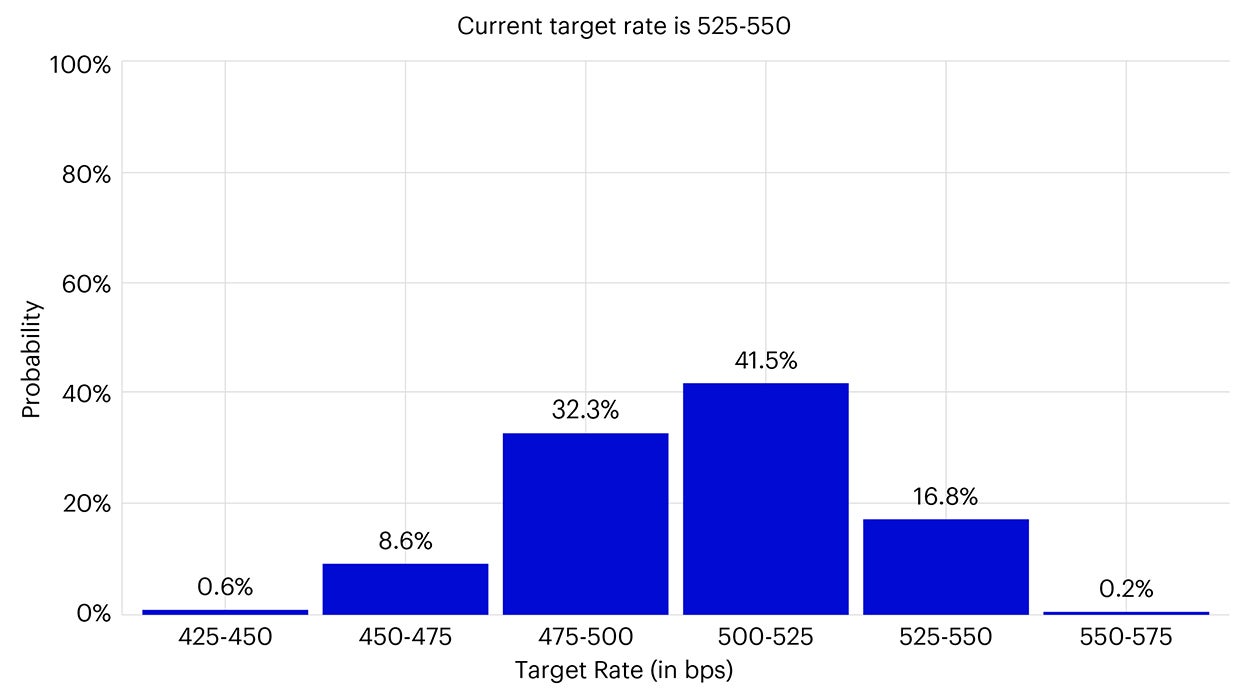
Source: CME Group, data as of 28 May 2024.
The increase in perceived softness of the US economy has been led by moderating inflation and persisting negative economic data versus consensus expectations. As an example, the Citi US Economic Surprise Index has been steadily declining over the last three months and at the time of writing stood at -30.1%.1 While we have commented on the continued resilience of the US economy, the ongoing restrictive monetary policy appears to have taken a firmer hold and pushed the market into a more contractionary regime.
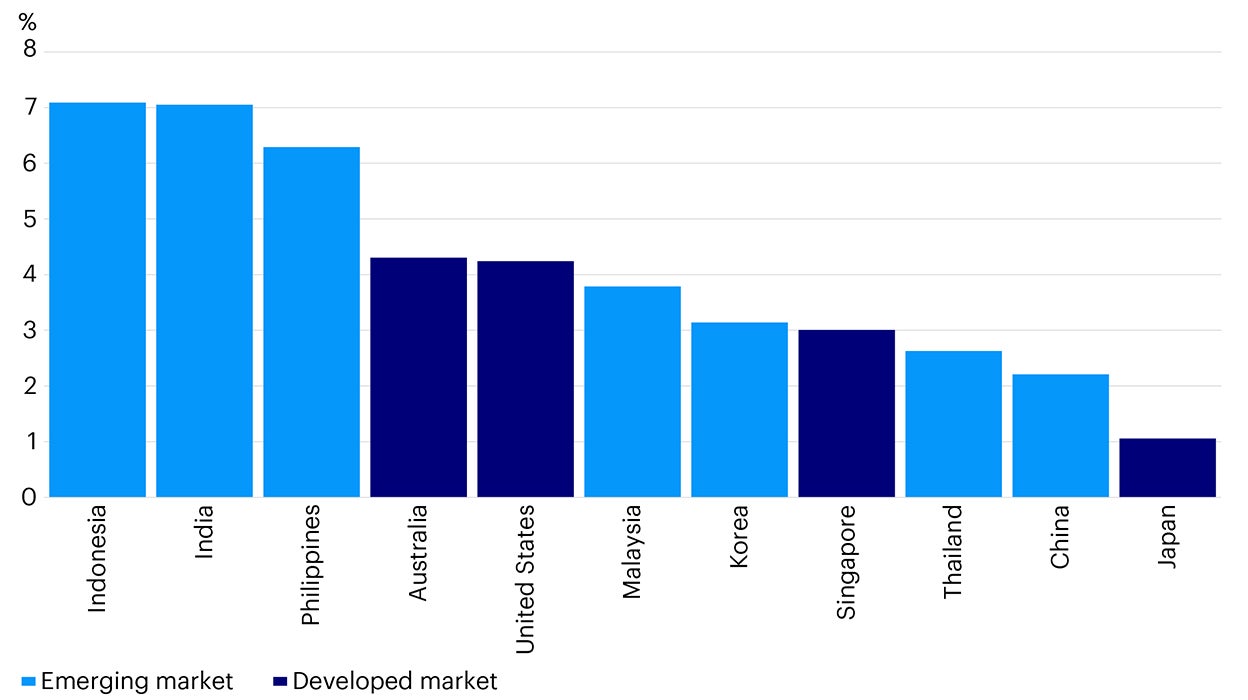
Source: Bloomberg, data as of 26 July 2024. Past performance does not guarantee future results.
Since the last publication, we have seen a slight shift in long-term yields, with Indonesia overtaking India, and the shift in the Bank of Japan policy leading to higher Japanese government bond yields. However, the overarching narrative remains the same, with the continued interest rate differential between the US and most other Asian economies expected to persist into the future, unless growth in Asian countries surprises to the upside. This formulates the basis of our analysis as we consider how private markets, particularly growth investments such as private equity, can bolster a portfolio in local currency terms.
When considering global investment through the perspective of Asian investors, one key difference in the approach to currency usually persists when looking at equity versus debt investments – whether to hedge currency risk. The general observation we’ve seen after hundreds of institutional investor conversations, is that credit exposure is hedged whereas equity exposure is left unhedged. So, we won’t dive into the specifics around currency hedging as we’ve done in prior pieces, but we should still emphasize that market forces remain intact. This is particularly through the observed phenomenon of interest rate parity, which implies that higher yielding currencies will depreciate versus lower yielding peers over the intermediate term, attaching a negative premium to USD exposure for many Asian investors. Essentially, we believe interest rate differentials will still have a meaningful impact on equity investors, whether a formal hedge is implemented or not.
To illustrate this and analyze the benefits of private markets growth investments on local currency returns, we’ll consider the addition or diversified growth investments to a public equity portfolio and observe the potential trade-offs. For this exercise, we’ll assume the investor has a base currency of Singapore dollar (in our previous analyses we chose Korean won and Thai baht, but as discussed we’ll explore multiple currencies in this series to demonstrate the efficacy of this analysis across geographies. The choice of SGD also pays homage to the author’s current home and strong love for nasi lemak and laksa).

We’ll now analyze this allocation through the Invesco Vision tool, which should help us to formulate an efficient frontier analysis. Please note, we included Singapore equities to reflect the common occurrence for local investors to overweight local markets relative to actual global exposure, typically measured by market cap. This principle could also be applied across other Asian countries, as this is a common practice in equity portfolio allocations.
For comparison’s sake, we’ll contrast USD and SGD-denominated frontiers to demonstrate the impact of long-term currency shifts (assuming interest rate parity) and associated local return reduction. Since the exercise is focused on public and private equity, we’ll home in on the expected returns of each portfolio, using our long-term capital market assumptions as a baseline and construct an efficient frontier accordingly.
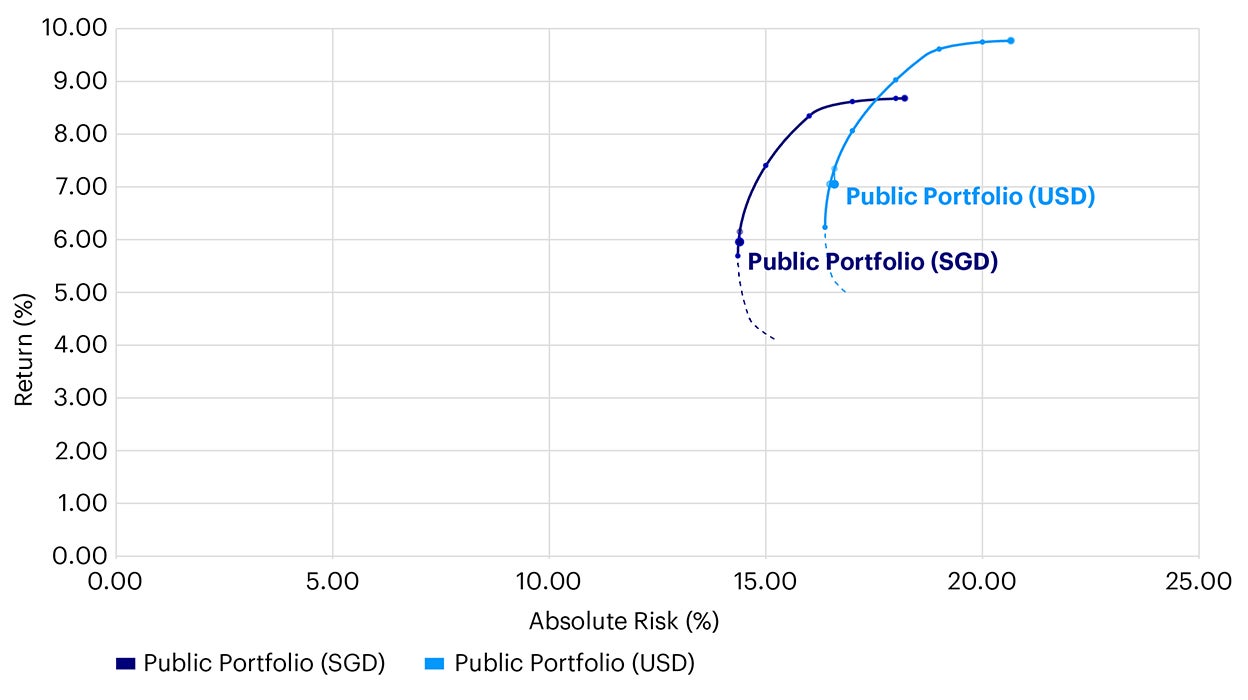
Source: Invesco Vision, data as of 30 June 2024. Return estimates are based on the 2024 Long-Term Capital Market Assumptions. These estimates are forward-looking, are not guarantees, and they involve risks, uncertainties, and assumptions. Note: Proxies are as follows: Developed ex-US equity – MSCI World ex US, US Equity – MSCI USA, Emerging market equity – MSCI Emerging Market, Singapore equity – MSCI Singapore
When we look at the portfolio return and risk assumptions leveraging Invesco Solutions long-term capital market assumptions, we see a noticeable return reduction when converting from USD to SGD, like we’ve seen in prior exercises.

For illustrative purposes only. There can be no assurance that any estimated returns or projections can be realized.
In this case, the difference is over 100 basis points. If local investors are looking to achieve returns like what would be expected through a USD-lens, it is essential to examine additional asset classes, such as private growth investments.
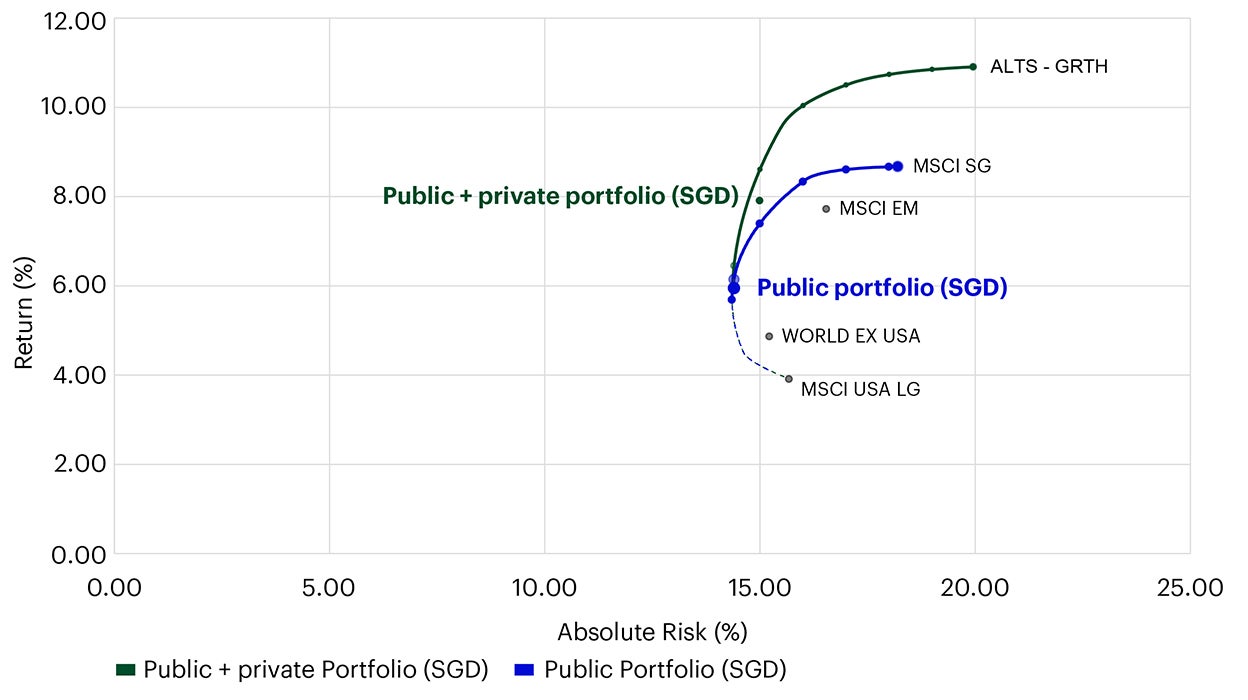
Considering this, we have created a new portfolio with a 30% allocation to diversified private markets growth investments. The portfolio has been constructed as follows:

Source: Invesco Vision, data as of 30 June 2024. Return estimates are based on the 2024 Long-Term Capital Market Assumptions. These estimates are forward-looking, are not guarantees, and they involve risks, uncertainties, and assumptions. Note: Proxies are as follows: Developed ex-US equity – MSCI World ex US, US Equity – MSCI USA, Emerging market equity – MSCI Emerging Market, Singapore equity – MSCI Singapore.

For illustrative purposes only. There can be no assurance that any estimated returns or projections can be realized.
Adding private markets growth investments clearly drives the expansion of the efficient frontier and increases expected returns by almost 200 basis points, whilst maintaining the same allocation to local equities and ensuring there is adequate portfolio liquidity. Our baseline return expectation for diversified private markets growth is 12% (net)2, with a volatility of roughly 20%3. This “premium” of private growth over public equity of about 600 bps4 is commensurate with historical results. Ultimately, by incorporating a diversified private markets growth sleeve into a public global equity portfolio, non-USD investors can meaningfully enhance portfolio returns, and better position their portfolios for the current market environment.
When looking at private growth investments, it’s also integral to consider diversification across asset classes, vintages, and managers. Additionally, we believe it’s important for investors to incorporate asset classes outside of private equity into their growth sleeve – notably value-add real estate and distressed debt. These two asset classes can also be categorized as growth investments as they fit the return and risk profile of equities.
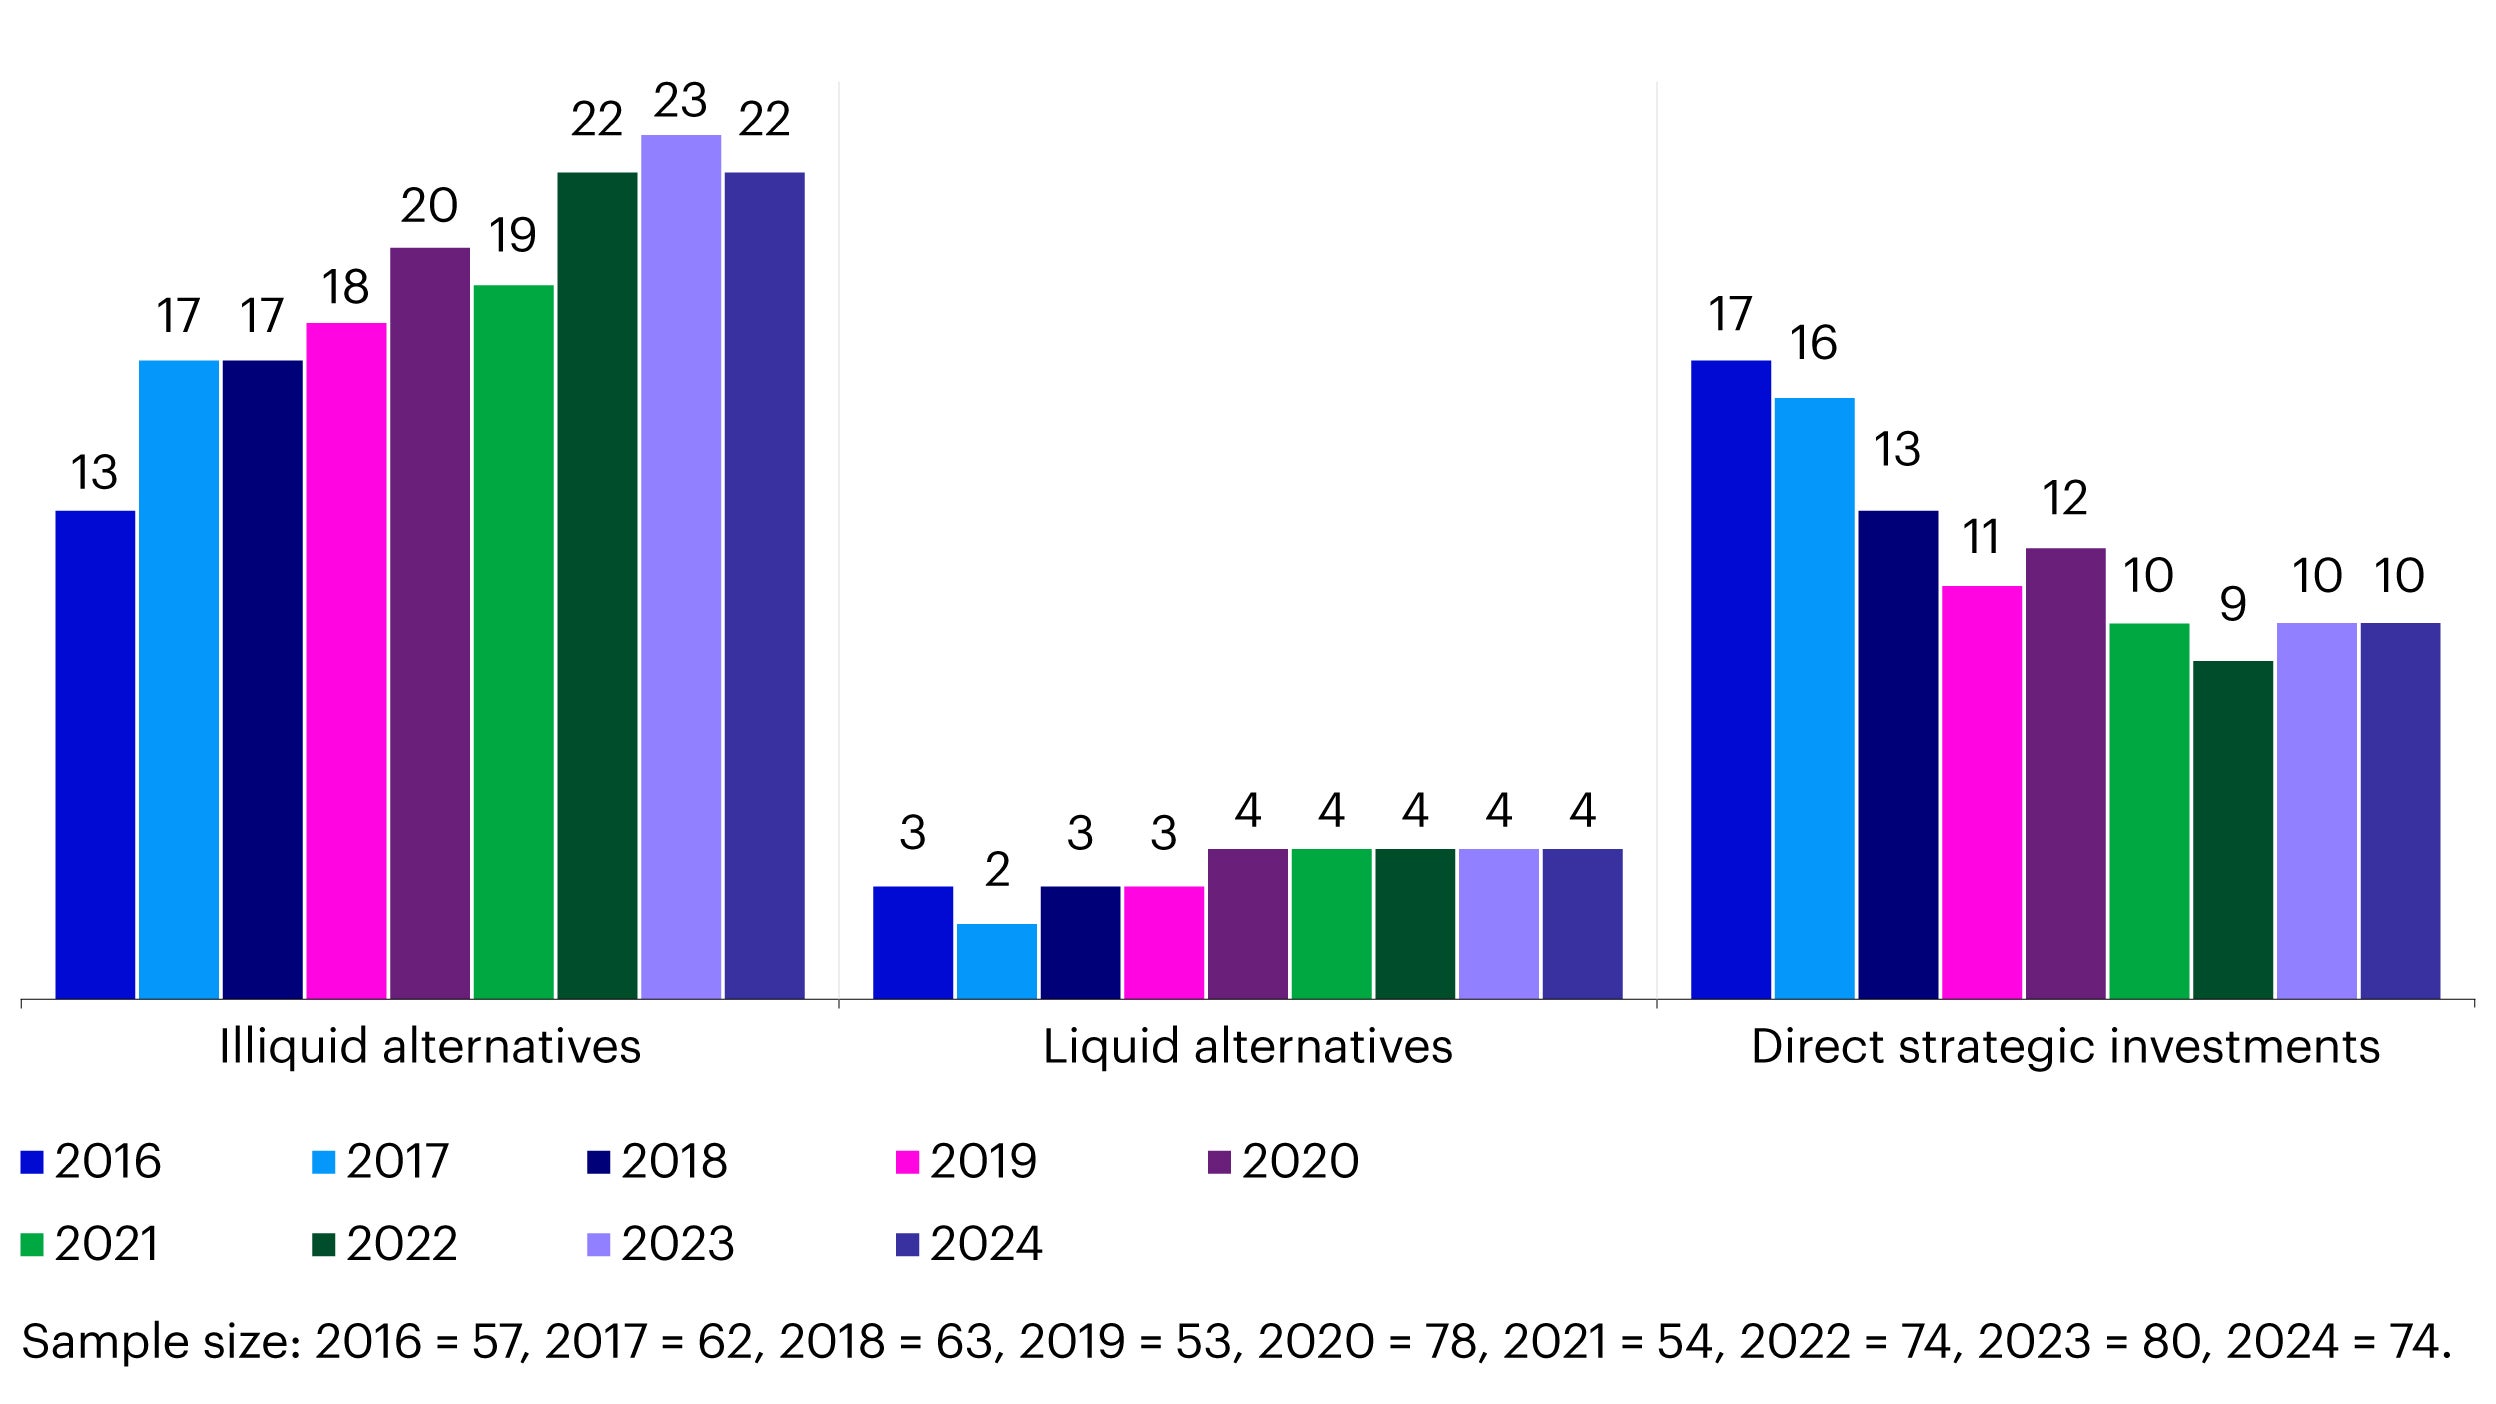
In addition, sovereign wealth funds allocated around 14% of their AUM to liquid alternatives and direct strategic investments in 2024 according to Invesco’s latest Global Sovereign Asset Management Study (IGSAMS).5 This figure has remained the same year-on-year indicating continued asset owner interest in private growth investments. One additional trend we notice is a decline in direct investments in favor of illiquid alternatives, which are typically implemented through diversified exposure such as funds. This insight points to a potential uptick in sovereign investor interest in partnering with external experts to achieve exposure to private markets, as opposed to investing directly.
Source: Invesco Global Sovereign Asset Management Study 2024
Going forward, we believe investors will face myriad challenges due to the changing interest rate environment, potentially decelerating macroeconomic headwinds, and downward shift in growth expectations. Private markets growth investments can fill an important void in portfolios to meet investment objectives over the next market cycle.
In sum, we believe Asian investors, many of whom have specific local currency return objectives, are well positioned to implement private growth investments into their public global equity allocations. The current US interest rate regime, which has lasted longer than anticipated, has impaired local currency expected returns. This warrants the consideration of additional approaches to portfolio construction and new asset classes, including private equity and other growth investments.
Appendix
Invesco Multi-Alternative Growth Proxy Benchmark Sub-Components

All data pulled from Invesco Vision as of 30 June 2024. For illustrative purposes only. There can be no assurance that any estimated returns or projections can be realized.


